Báo cáo y học: " A local glucose-and oxygen concentration-based insulin secretion model for pancreatic islets Peter Buchwald" potx
Bạn đang xem bản rút gọn của tài liệu. Xem và tải ngay bản đầy đủ của tài liệu tại đây (6.1 MB, 25 trang )
RESEARC H Open Access
A local glucose-and oxygen concentration-based
insulin secretion model for pancreatic islets
Peter Buchwald
Correspondence: pbuchwald@med.
miami.edu
Diabetes Research Institute and the
Department of Molecular and
Cellular Pharmacology, University
of Miami, Miller School of
Medicine, Miami, FL, USA
Abstract
Background: Because insulin is the main regulator of glucose homeostasis,
quantitative models describing the dynamics of glucose-indu ced insulin secretion are
of obvious interest. Here, a computational model is introduced that focuses not on
organism-level concentrations, but on the quantitative modeling of local, cellular-
level glucose-insulin dynamics by incorporating the detailed spatial distribution of
the concentrations of interest within isolated avascular pancreatic islets.
Methods: All nutrient consumption and hormone release rates were assumed to
follow Hill-type sigmoid dependences on local concentrations. Insulin secretion rates
depend on both the glucose concentration and its time-gradient, resulting in
second-and first-phase responses, respectively. Since hypoxia may also be an
important limiting factor in avascular islets, oxygen and cell viability considerations
were also built in by incorporating and extending our previous islet cell oxygen
consumption model. A finite element method (FEM) framework is used to combine
reactive rates with mass transport by convection and diffusion as well as fluid-
mechanics.
Results: The model was calibrated using experimental results from dynamic glucose-
stimulated insulin release (GSIR) perifusion studies with isolated islets. Further
optimization is still needed, but calculated insulin responses to stepwise increments
in the incoming glucose concentration are in good agreement with existing
experimental insulin relea se data characterizing glucose and oxygen dependence.
The model makes possible the detailed description of the intraislet spatial
distributions of insulin, glucose, and oxygen levels. In agreement with recent
observations, modeling also suggests that smaller islets perform better when
transplanted and/or encapsulated.
Conclusions: An insulin secretion model was implemented by coupling local
consumption and release rates to calculations of the spatial distributions of all
species of interest. The resulting glucose-insulin control system fits in the general
framework of a sigmoid proportional-integral-derivative controller, a generalized PID
controller, more suitable for biological systems, which are always nonlinear due to
the maximum response being limited. Because of the general framework of the
implementation, simulations can be carried out for arbitrary geometries including
cultured, perifused, transplanted, and encapsulated islets.
Keywords: diabetes mellitus, FEM model, glucose-insulin dynamics, Hill equation,
islet perifusion, islets of Langerhans, oxygen consumption, PID controller
Buchwald Theoretical Biology and Medical Modelling 2011, 8:20
/>© 2011 Buchwald; lice nsee BioMed Central Ltd. This is an Open Access article distributed under the terms of the Creative Commons
Attribution License ( which permits unrestricted use, distribution, and reproduction in
any medium, provided the original work is properly cited.
Background
In healthy humans, blood glucose levels have to be maintained in a rela tively narrow
range: typically 4-5 mM and usually within 3.5-7.0 mM (60-125 mg/dL) in fasting sub-
jects [1,2]. This is mainly achieved via the finely-tuned glucose-insulin control system
whereby b-cells located in pancreatic islets act as glucose sensors and adjust their insu-
lin output as a function o f the blood glucose level. Pancreatic islets are structurally
well -defined spheroi dal cell ag gregates of about one to two thousand hormone-secret-
ing endocrine cells (a, b, g, and PP-cells). Human islets have diameters ranging up to
about 500 μm with a size distribution that is well described by a Weibull distribution
function, and islets with diameters of 100-150 μmarethemostrepresentative[3].
Because abnormalities in b-cell function are the main culprit behind elevated glucose
levels, quantitative models describing the dynamics of glucose-stimulated insulin
release (GSIR) are of obvious interest [1] for both type 1 (insulin-dependent or juve-
nile-onset) and type 2 (non-insulin dependent or adult-onset) diabetes mellitus. They
could help not only to better understand the process, but also to more accurately
assess b-cell function and insulin resistance. Abnormalities in b-cell function are criti-
cal in defining the risk and development of type 2 diabetes [4], a rapidly increasing
therapeutic burden in industrialized nations due to the increasing prevalence of obesity
[5,6]. A quantitative understanding of how healthy b-cells maintain normal glucose
levels is also of critical impor tance for the development of ‘ artificial pancreas’ systems
[7] including automated closed-loop insulin delivery systems [8-10] as well as for the
development of ‘bioartificial pancreas’ systems such as those using immune-isolated,
encapsulated islets [11-13]. Accordingly, mathematical models have been developed to
describe the glucose-insulin regulatory system using organism-level concentrations,
and they are widely used, for example, to estimate glucose effectiveness and insulin
sensitivity from intravenous glucose tolerance tests (IVGTT). They include curve-fit-
ting models such as the “minimal model” [14] and many others [15-17] as well as para-
digm models such as HOMA [18,19]. There is also considerable interest in models
focusing on insulin release from encapsulated islets [20-26], an appro ach that is being
explored as a possibility to immunoisolate and protect transplanted islets.
The goal of the present work is to develop a finite element method (FEM)-based
model that (1) focuses not on organism-level concentrations, but on the quantitative
modeling of local, cellular-level glucose-insulin dynamics by incorporating the detailed
spatial distribution of the concentrations of interest and that (2) was calibrated by fit-
ting experimental results fro m dynamic GSIR perifusion studies with isolated islets.
Such perifusion studies allow the quantitative assessment of insulin release kinetics
under fully controllable experimental conditio ns of varying external concentrations of
glucose, oxygen, or other compounds o f interest [27-30], and are now routinely used
to assess islet quality and function. Microfluidic chip technologies make now possible
even the quantitative monitoring of single islet insulin secretion with high time-resolu-
tion [31]. We focused on the modeling of such data becau se they are better suited for
a first-step modeling than those of insulin releas e studies of fully vasc ularized islets in
live organism, which are difficult to obtain accurately and are also influenc ed by many
other factors. Lack of vasculature in the isolated islets considered here might cause
some delay in the response compared with normal islets in their natural enviro nment;
however, the diffusion time (L
2
/D) [32] to (or from) the middle of a ‘standard’ islet (d
Buchwald Theoretical Biology and Medical Modelling 2011, 8:20
/>Page 2 of 25
=150μm) is roughly of the order of only 10 s f or glucose and 100 s for insulin (with
the diffusion coefficients used here)-relatively small delays. Furthermore, because of
the spherical structure, most of the cell mass is located in the oute r regions of the
islets (i.e., about 70% within the outer third of the radius ) further diminishing the roles
of these delays.
By using a general approach that couples local (i.e., cellular level) hormone release
and nutrient consumption rates with mass transport by convection and diffusion, the
present approach allows implementation for arbitrary 2D or even 3D geometries
including those with flowing fluid phases. Hence, the detailed spatial distribution of
insulin release, hypoxia, and cell survival can be modeled within a unified framework
for cultured, transplanted, encapsulated, or GSIR-perifused pancreatic islets. While
there has been considerable work on modeling insulin secretion, no models that couple
both convective and diffusive transport with reactive rates for arbitrary geometries have
been published yet. Most published models incorporating mass transport focused on
encapsulated islets for a bioartificial pancreas [20-26]. Only very few [21,24] included
flow, and even those had to assume cylindrical symmetry. Furthermore, the present
model also incorpor ates a comprehensive approach to account not only for first-and
second-phase insulin respons e, but also for both the glucose-and the oxygen-depen-
dence of insulin release. Because the lack of oxygen (hypoxia) due to oxygen diffusion
limitations in avascular islets can be an important limiting [33] factor especially in cul-
tured, encapsulated, and freshly transplanted islets [27,28,34,35], it was important to
also incorporate this aspect of the glucose-insulin response in the model.
In response to a stepwise increase of glucose, normal, functioning islets release insu-
lin in a biphasic manner: a relatively quick first phase consisting of a transient spike of
5-10 min is followed by a sustained second phase that is slower and somewhat delayed
[36-39]. The effect of hypoxic conditions on the insulin release of perifused islets has
been studied by a number of groups [27,28,34,35], and they seem to indicate that insu-
lin release decreases nonlinearly with decreasing oxygen availability; however, only rela-
tively few detailed concentration-dependence studies are available. Parametrization of
the insulin release model here has b een done to fit experimental insulin release data
mainly from two studies with the most detailed concentration dependence data avail-
able: by Henquin and co-workers for glucose dependence [40] and by Dionne, Colton
and co-workers for oxygen dependence [27].
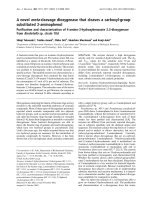
In the present model, the insulin-secreting b-cells were assumed to act as sensors of
both the local glucose concentration and itschange(Figure1).Insulin is released
within the islets following Hill-type sigmoid response functions of the local (i.e., cellu-
lar level) glucose concentration, c
gluc
, as well as its time-gradient, ∂c
gluc
/∂t, resulting in
second-and first-phase insulin responses, respectively. Oxygen and glucose consump-
tion by the islet cells were also incorporated in the model using Michaelis-Menten-
type kinetics (Hill equation with n
H
= 1). Since lack of oxygen (hypoxia) can be impor-
tant in avascular islets [33], oxygen conce ntrations were allowed to limit the rate of
insulin secretion using again a Hill-type equation. Finally, all the local (cellular-level)
oxygen, glucose, and insulin concentrations were tied together with solute transfer
equations to calculate observable, external concentrations as a function of time and
incoming glucose and oxygen concentrations.
Buchwald Theoretical Biology and Medical Modelling 2011, 8:20
/>Page 3 of 25
Methods
Mass transport model (convective and diffusive)
For a fully comprehensive description, a total of four concentrations were used each
with their corresponding equation (application mode) for ‘local’ and released insulin,
glucose, and oxygen, respectively (c
insL
, c
ins
, c
gluc
,andc
oxy
). Accordingly, f or each of
them, diffusion w as assumed to be governed by the generic diffusion equation in its
nonconservative formulation (incompressible fluid) [32,41]:
∂c
∂t
+ ∇·(−D∇ c)=R − u ·∇c
(1)
where, c denotes the co ncentration [mol m
-3
] and D the diffusion coefficient [m
2
s
-1
]
of the species of interest, R the reaction rate [mol m
-3
s
-1
], u the velocity field [m s
-1
],
and ∇ the standard del (nabla) operator,
∇ = i
∂
∂x
+ j
∂
∂y
+ k
∂
∂z
[42]. The following diffu-
sion coefficients were used as consensus estima tes of values available from the litera-
ture: oxygen, D
oxy,w
= 3.0 × 10
-9
m
2
s
-1
in aqueous media and D
oxy,t
=2.0×10
-9
m
2
s
-
1
in islet tissue ([33] and reference s therein); glucose, D
gluc,w
=0.9×10
-9
m
2
s
-1
and
D
gluc,t
=0.3×10
-9
m
2
s
-1
; insulin, D
ins,w
=0.15×10
-9
m
2
s
-1
and D
ins,t
=0.05×10
-9
m
2
s
-1
[23,24].Publishedtissuevaluesforglucosevaryoverawiderange(0.04-0.5×
10
-9
m
2
s
-1
) [32,43-46]; a value toward the higher end of this range (0.3 × 10
-9
m
2
s
-1
)
was used here. Very few tissue values for insulin are available (and the existence of
dimers and hexamers only complicates the situation) [32,47]; the value used here was
lowered compared to water in a manner similar to glucose. For the case of
Figure 1 Schematic concept of the present model of glucose-stimulated insulin release in b-cells.It
is implemented within a general framework of sigmoid proportional-integral-derivative (SPID) controller,
and responds to glucose concentrations, but is also influenced by the local availability of oxygen. A total of
four concentrations are modeled for ‘local’ and released insulin (c
insL
, c
ins
), glucose (c
gluc
), and oxygen (c
oxy
),
respectively.
Buchwald Theoretical Biology and Medical Modelling 2011, 8:20
/>Page 4 of 25
encapsulated islets, the following diffusion coefficients were used for the capsule (e.g.,
hydrogel matrices such as alginate): D
oxy,c
= 2.5 × 10
-9
m
2
s
-1
, D
gluc,c
= 0.6 × 10
-9
m
2
s
-
1
, D
ins,c
= 0.1 × 10
-9
m
2
s
-1
[23,48].
Consumption and release rates
All consumption and release rates were assumed to follow Hill-type dependence on the
local concentrations (generalized Michaelis-Menten kinetics):
R = f
H
(c)=R
max
c
n
c
n
+ C
n
Hf
(2)
The three parameters of th is function are R
max
, the maximum reaction rate [mol m
-3
s
-1
], C
Hf
, the concentration correspondi ng to half -maximal response [mol m
-3
], and n,
the Hill slope characterizing the shape of the response. This function introduced by A.
V. Hill [49,50] provides a convenient mathematical function for biological/pharmacolo-
gical applications [51]: it allows transit ion from zero to a limited maximum rate via a
smooth, continuously deriv able function of adjustable width. Mathematically, the well-
known two-parameter Michaelis-Menten equation [52] represents a special case (n =
1) of th e Hill equation, and eq. 2 also shows analogy with the logistic equation, one of
the most widely used sigmoid functional forms, being e quivalent with a logarithmic
logistic function, y = f(x)=R
max
/(1 + be
-n lnx
). Obviously, different parameter values
are used for the different release and consumption functions (i.e., insulin, glucose, oxy-
gen; e.g., C
Hf,gluc
, C
Hf,oxy
, etc.).
Oxygen consumption and cell viability
For oxygen consumption, the basic values used in our previous model [33,53] were
maintained (n
oxy
=1,R
max,ox y
= -0.034 mol m
-3
s
-1
, C
Hf,oxy
=1μM-correspondin g to a
partial oxygen pressure of p
Hf,oxy
= 0.7 mmHg) since, by all indications, the assumption
of a regular Michaelis-Menten kinetics (i.e., n
oxy
= 1) gives an adequate fit [54,55].
Accordingly, at very low oxygen concentrations, where cells only try to survive, oxygen
consumption scales with the availabl e concentration c
oxy
and , at sufficiently high con-
centration, it plateaus at a maximum (R
max
). As before [33], to account for the
increased metabolic demand of insulin release and production at higher glucose con-
centrations, a dependence of R
oxy
on the local glucose concentration was also intro-
duced via a modulating function
o,g
(c
gluc
):
R
oxy
= R
max,oxy
c
oxy
c
oxy
+ C
Hf ,oxy
· ϕ
o,g
(c
gluc
) · δ( c
oxy
> C
cr,oxy
)
(3)
A number of experiments have shown increased oxygen consumption rate in islets
when going from low to hig h glucose concent rations [56-58]. Here, i n a slight update
of our previous model [33], we assumed that the oxygen consumption rate contains a
base-rate and an additional component that increases due to the increasing meta bolic
demand in parallel with the insulin secretion rate (cf. eq. 6) as a function of the glucose
concentration:
ϕ
o,g
(c
gluc
)=φ
sc
ϕ
base
+ ϕ
metab
c
n
ins 2,gluc
gluc
c
n
ins 2,gluc
gluc
+ C
n
ins 2,gluc
Hf ,ins2,gluc
(4)
Buchwald Theoretical Biology and Medical Modelling 2011, 8:20
/>Page 5 of 25
Lacking detailed data, as a first estimate, we assumed the base rate to represent 50%
of the total rate possible (
base
=
metab
= 0.5). To maintain the previously used con-
sumption rate at low (3 mM) glucose, a scaling factor is used, F
sc
= 1.8. The metabolic
component fully parallels that used for insulin secretion (n
ins2,gluc
=2.5,C
Hf,ins2,gluc
=7
mM; see eq. 6 later). With this selection, oxygen consumption increases about 70%
when going from low (3 mM) to high glucose (15 mM)-slightly less than used pre-
viously in our preliminary model [33], but in good agreement with the approximately
50%-100% fold increase seen in various experi mental settings [35,36,56-60]. As before
[33], a step-down function, δ, was also added to account for necrosis and cut the oxy-
gen consumption of those tissues where the oxygen concentration c
oxy
falls below a
critical value, C
cr,oxy
=0.1μM (corresponding to p
cr,oxy
= 0.07 mmHg). To avoid com-
putational problems due to abrupt transitions, COMSOL’ssmoothedHeavisidefunc-
tion with a continuous first derivative and without overshoot flc1hs [61] was used as
step-down function, δ(c
oxy
>C
cr,oxy
) = flc1hs(c
oxy
- 1.0x10
-4
, 0.5x10
-4
).
Glucose consumption
Glucose consumption, in a manner very similar to oxygen consumpti on, was assumed
to also follow simple Mich aelis-Menten kinetics (n
gluc
=1)withR
max,gluc
= -0.028 mol
m
-3
s
-1
and C
Hf,gluc
=10μM [23,24,46]:
R
gluc
= R
max,gluc
c
gluc
c
gluc
+ C
Hf ,gluc
(5)
These parameter values are draft first estimates only; however, changes in glucose
concentrations due to glucose consumptio n by islets have on ly minimal influence on
insulin release or cell survival because oxygen diffusion limitations in tissue or in
mediaarefarmoreseverethanforglucose[55,62].Evenifoxygenisconsumedat
approxim ately the same rate as glucose on a molar basis and has a 3-4-fold higher dif-
fusion coefficient (i.e., D
w
susedhereof3.0×10
-9
vs. 0.9 × 10
-9
m
2
s
-1
), this is more
than offset by the differences in the concentrations available under physiological condi-
tions. The solubility of oxygen in culture media or in tissue is much lower than that of
glucose; hence, the availab le oxygen concentrations are much mo re limited (e.g.,
around 0.05-0.2 mM vs. 3-15 mM assuming physiologically relevant conditions) [62].
Glucose consumption by isle t cells alters the glucose levels reaching the glucose-sen-
sing b-cells only minimally.
Insulin release
Obviously, the most crucial part of the present model is the functional form describing
the glucose-(and oxygen) dependence of the insulin secretion rate, R
ins
.Glucose(or
oxygen) is not a substrate per se for insulin production; hence, there is no direct justifi-
cation for the use of Michaelis -Menten-type enzyme kinetics. Nevertheless, the corre-
sponding generalize d form (Hill equation, eq. 2) provides a mathematically convenient
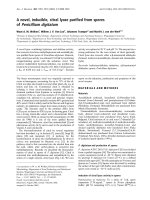
functionality that fits well the experimental results. A Hill function with n >1is
needed because glucose-insulin response is clearly more abrupt than the rectangular
hyperbola of the Michaelis-Menten equation corresponding to n = 1 as clearly illu-
strated by the sigmoid-type curve of Figure 2 and by other similar data from various
sources [36,40,63,64]. In fact, such a function has been used as early as 1972 by
Grodsky (n =3.3,C
Hf,ins,gluc
= 8.3 mM; isolated rat pancreas) and justified as resul ting
from insulin release from individual packets with normally distributed sensitivity
Buchwald Theoretical Biology and Medical Modelling 2011, 8:20
/>Page 6 of 25
thresholds [63]. However, except for some recent work by Pedersen, Cobelli and co-
workers [65,66], such a sigmoid functional dependence has been mostly neglected
since then, and most models [21,23,24] used flatter (n = 1) response functions com-
bined with exponentially decreasing time-function s. To have a model that can be used
for arbitrary incoming glucose profiles, the use of explicit time dependency was
avoided here; however, use of an additional ‘local’ insulin compartment with first order
release kinetics (see later) achieves a similar effect. A sufficiently abrupt sigmoid
response function on c
gluc
ensures an upper limit (plateau) at high glucose concentra-
tions as well as essentially no response at low concentrations (Figure 2) eliminating the
need for a specified minimum threshold for effect.
Accordingly, the main function used here to describe the glucose-insulin dynamics of
the second-phase response is:
R
ins,ph2
= R
max,ins2
c
n
ins 2,gluc
gluc
c
n
ins 2,gluc
gluc
+ C
n
ins 2,gluc
Hf ,ins2,gluc
(6)
with n
ins2,gluc
= 2.5, C
Hf,ins2,gluc
= 7 mM, and R
max,ins2
= 3.0 × 10
-5
mol m
-3
s
-1
. These
values were obtained here by calculating the predicted insulin output in response to a
stepwise increase in incoming glucose and adjusting n
ins2,gluc
and C
Hf,ins2,gluc
to obtain
best fit with the human islet data of Henquin and co-workers (staircase experiment)
[40] (Figure 2). Topp and co-workers used a sim ilar Hill function (n =2,C
Hf
=7.8
mM) for insulin secretion based on (rat) data from Malaisse [67]. Compared to
Figure 2 Glucose-dependence of insulin s ecretion rate in perifused islets. Experimental data are for
perifused human islets (blue diamonds) [40] and isolated rat pancreas (blue circles) [63]. Fit of the human
data with general Hill-type equations (eq. 2) is shown without any restrictions (best fit, n = 2.7, C
Hf,gluc
=
6.6 mM; blue line), with restricting the Hill slope to unity (n = 1, Michaelis-Menten-type function, C
Hf,gluc
=
4.9 mM; dashed blue line), and with the present model used for the local concentration (eq. 6) (n = 2.5,
C
Hf,gluc
= 7 mM; red line).
Buchwald Theoretical Biology and Medical Modelling 2011, 8:20
/>Page 7 of 25
rodents, human insul in response is left-shifted, and a half-maximal response for a glu-
cose concentration around 7 mM seems reasonable [40,68]. The activity of glucokinase,
which serves as glucose sensor in b-cells and is also generally considered as rate-limit-
ing for their glucose usage, shows a sigmoid-type dependence on c
gluc
(i.e., eq. 2 with
C
Hf,gluc
=8.4mM,n
gluc
= 1.7 [69] or C
Hf,gluc
=7.0mM,n
gluc
= 1.7 [70]) in general
agreement with eqs. 5 and 6 and their parameterization (Table 1). R
max,ins2
corresponds
to a maximum (second phase) secretion rate of ~20 pg/IEQ/min for human islets
[37,40,71].
Toincorporateasimplemodelofthefirst-phaseresponse,wealsoaddedacompo-
nent that depends on the glucose time-gradient (c
t
= ∂c
gluc
/∂t). This is non-zero only
when the glucose concentration is increasing, i.e., only when c
t
> 0. Again, a Hill-type
sigmoid response was assumed to ensure a plateau:
R
ins,ph1
= R
max,ins1
∂c
gluc
∂t
n
ins1,gluc
∂c
gluc
∂t
n
ins1,gluc
+ Ct
n
ins1,gluc
Hf ,ins1,gluc
· σ
i1,g
(c
gluc
)
(7)
with n
ins1,gluc
=2,Ct
Hf,ins1,gluc
=0.03mMs
-1
, and R
max,ins1
= 21.0 × 10
-5
mol m
-3
s
-1
.
These parameters are more difficult to directly calibrate from existing data on insulin
responses to stepwise glucose increases; hence, they have to be considered as explo ra-
tory settings. Constant glucose ramps have been explored with perifused rat islets in
an attempt to quantify these responses [72]; however, the gradients used ther e are too
small (1.5-4.5 μM/s) to allow a clear separation between first-and second-phase
responses for quantitation. The Ct
Hf
value used here (0.03 mM/s) was selected so as to
give an approximately linear response for a range that likely covers normal physiologic
conditions (e.g., 5 mM increase in 10-20 min: 0.005-0.01 mM/s) as well as dynamic
perifusion conditions (e.g., 2-6 mM increases in 1 min: 0.03-0.10 mM/s). A completely
linea r (i.e., proportional) glucose gradient dependent term has been used in a few pre-
vious models mainly following Jaffrin [20,26,72-74] (one of them [73] also allowing
modulation of the proportionalit y constant by glucose concentration). Here, one
Table 1 Summary of Hill function (eq. 2) parameters used in the present model (Figure
1, eq. 3-9)
Model Var. C
Hf
nR
max
Comments
R
oxy
, oxygen
consumption,
base
c
oxy
1 μM 1 -0.034 mol/m
3
/s Cut to 0 below critical value, c
oxy
<C
cr,oxy
.
R
oxy
, oxygen
consumption,
o,g
metabolic part
c
gluc
7 mM 2.5 N/A Due to increasing metabolic demand;
parallels second-phase insulin secretion
rate.
R
gluc
, glucose
consumption
c
gluc
10 μM 1 -0.028 mol/m
3
/s Contrary to oxygen, has no significant
influence on model results.
R
ins,ph2
, insulin
secretion rate,
second-phase
c
gluc
7 mM 2.5 3 × 10
-5
mol/m
3
/s Total secretion rate is modulated by local
oxygen availability (last row).
R
ins,ph1
, insulin
secretion rate,
first-phase
∂c
gluc
/∂t 0.03 mM/s 2 21 × 10
-5
mol/m
3
/s Modulated via eq. 8 to have maximum
sensibility around c
gluc
= 5 mM and be
limited at very large or low c
gluc
.
Insulin secretion
rate,
o,g
oxygen
dependence
c
oxy
3 μM 3 N/A To abruptly limit insulin secretion if c
oxy
becomes critically low.
Buchwald Theoretical Biology and Medical Modelling 2011, 8:20
/>Page 8 of 25
additional modulating function, s
i1,g
has also been incorporated to reduce t his gradi-
ent-dependent response for islets that are already operating at an elevated second-
phase secretion rate and to maximize it around c
gluc
values where islets are likely to be
most sensitive (C
m
= 5 mM) using a derivative of a sigmoid function:
σ
i1,g
(c
gluc
)=
4c
4
gluc
C
4
m
c
4
gluc
+ C
4
m
2
(8)
With all these, total insulin release is obtained as the sum of first-and second-phase
releases and an additional modulating function to account for the limiting effect of
oxygen availability, whic h can become important in the core region of larger avascular
islets especially under hypoxic conditions:
R
ins
=(R
ins,ph1
+ R
ins,ph2
) · ϕ
i,o
(c
oxy
)
(9)
We assumed an abrupt Hill-type (eq. 2) modulating function as
i,o
(c
oxy
)withn
ins,oxy
=
3 and C
Hf,ins,oxy
=3μM(p
Hf,ins,oxy
= 2 mmHg) so that insulin secretion starts becoming
limited for local oxygen concentrations that are below ~6 μM (corresponding to a partial
pressure of p
O2
≈ 4 mmHg) (Additional file 1, Figure S1). This is a somewhat similar,
but mathematically more convenient function than the bilinear one introduced by
Avgoustiniatos [75] and used by Colton and co-workers [76] to account for insulin
secretion limitations at low oxygen (p
O2
< 5.1 mmHg assume d by them) as it is a
smooth sigmoid function with a continuous derivative (Additional file 1, Figure S1).
For a correct time-scale of insulin release, an extra compartment had t o be added;
otherwi se insulin responses decreased too quickly compared to experimental observa-
tions (~1 min vs. ~5-10 min). Hence, insulin is assumed to be first secreted in a ‘local’
compartment (Figure 1) in response to the current local glucose concentration (R
ins
,
eq. 9) and then released from here following a first order kinetics [dc
insL
/dt = R
ins
-
k
insL
(c
insL
- c
ins
); k
insL
=0.003s
-1
, corresponding to a half-life t
1/2
of approximately 4
min]. ‘Local’ insul in was modeled as an additional concentration with the regular con-
vection model (eq. 1), but having a very low diffusivity (D
insL,t
=1.0×10
-16
m
2
s
-1
).
Throughout the entire model building process, special care was taken to keep the
number of parameters as low as possible to avoid over-parameterization [77]; however,
inclusion of t his compartment was necess ary. The model has been parameterized by
fitting experimental insulin release data from two detailed c oncentration-dependenc e
perifusion studies: one concentrating on the effect of glucose using isolated human
islets [40] and one concentrating on the effect of hypoxia using isolated rat islets [27].
Fluid dynamics model
To incorporate media flow in the perifusion tube, these convection and diffusion mod-
els need to be coupled to a fluid dynamics model. Accordingly, the incompressible
Navier-Stokes model for Newtonian flow (constant vis cosity) was used for fluid
dynamics to calculate the velocity field u that results from convection [32,41]:
ρ
∂u
∂t
− η∇
2
u + ρ(u ·∇)u + ∇p = F
∇·u =0
(10)
Buchwald Theoretical Biology and Medical Modelling 2011, 8:20
/>Page 9 of 25
Here, r denotes density [kg m
-3
], h viscosity [kg m
-1
s
-1
= Pa s], p pressure [Pa, N m
-
2
,kgm
-1
s
-2
], and F volume force [N m
-3
,kgm
-2
s
-2
]. The first equation is the
momentum balance; the second one is simply the equation of continuity for incom-
pressible fluids. The flowing media was assumed to be an essentially aqueous media at
body temperature; i.e., the following values were used: T
0
=310.15K,r = 993 kg m
-3
,
h=0.7×10
-3
Pa s, c
p
= 4200 J kg
-1
K
-1
, k
c
=0.634Js
-1
m
-1
K
-1
, a =2.1×10
-4
K
-1
.As
previously [33], incoming media was assumed to be in equilibrium with atmospheric
oxygen and, thus, have an oxygen concentration of c
oxy,in
= 0.200 mol m
-3
(mM) corre-
sponding to p
O2
≈ 140 mmHg. A number of GSIR perifusion studies including [40]
used solutions gassed with enriched oxygen (e.g., 95% O
2
+5%CO
2
; p
O2
≈ 720
mmHg); however, with the islet sizes used here, atmospheric oxygen already provides
sufficient oxygenation so that the extra oxygen has no effect on model-calculated insu-
lin secretion (se e Results section). Inflow velocity was set to v
in
=10
-4
ms
-1
(corre-
sponding to a flow rate of 0 .1 mL/min in a~4mmtube),andalongtheinlet,a
parabolic inflow velocity profile was used: 4v
in
s(1-s), s being the boundary segment
length.
Model implementation
The models were implemented in COMSOL Multiphysics 3.5 (formerly FEMLAB;
COMSOLInc.,Burlington,MA)andsolvedas time-dependent (transient) problems
allowing intermediate time-steps for the solver. Computations were done with the Par-
diso direct solver as linear system solver with an imposed ma ximum step of 0.5 s,
which was needed to not miss changes in the incoming glucose concentrations that
could be otherwise overstepped by the solver. With these setting, all computation
times were reasonable being about real time; i.e., about 1 h for each perifusion simula-
tions of 1 h interval.
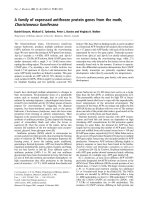
As a representative case, a 2D cross-section of a cylindrical tube with two spherical
islets of 100 and 150 μm diameter was used allowing for the possibility of either free
or encapsulated islets (capsule thickness l =150μm; fluid flowing from left to right)
(Figure 3). Stepwise increments in the incoming glucose concentration were implemen-
ted using again the smoothed Heaviside step function at predefined time points t
i
, c
gluc
= c
low
+ Σc
step,i
flc1hs(t - t
i
, τ). For FEM, COMSOL’ s predefined ‘Extra fine’ mesh size
was used (5,000-10,000 mesh elements; Figure 3). In the convection and diffusion
models, the following boundary conditions were used: insulation/symmetry, n (-D∇c
+cu) = 0, for wal ls, continuity for islets. For the outflow, convective flux was used for
insulin, glucose, and oxygen, n (-D∇c) = 0. For the inflow, inward flux was used for all
components with zero for i nsulin (N
0
=0),c
gluc
v
in
for glucose, and c
oxy,in
v
in
for oxy-
gen. In the incompressible Navier-Stokes model, no slip (u = 0) was used along all sur-
faces corresponding to liquid-solid interfaces. For the outlet, pressure, no viscous stress
with p
0
= 0 was imposed.
For visualization of the results, surface plots were used for c
ins
, c
oxy
, and R
ins
.For3D
plots, c
ins
was also used as height data. A contour plot (vector with isolevels) was used
for c
gluc
to highlight the changes in glucose. To characterize fluid flow, arrows and
streamlines for the velocity field were also u sed. Animations were generated with the
same settings used for the corresponding graphs. Total insulin secretion as a function
Buchwald Theoretical Biology and Medical Modelling 2011, 8:20
/>Page 10 of 25
of time was visualized using boundary integration for the total flux along the outflow
boundary.
Results and Discussion
First-and second-phase insulin responses
Following implementation of the model, the values of the adjustable parameters of eqs.
4-9 were selected (Table 1) so as to fit insulin secretion data from islet perifusion
experiments with detailed dose responses for glucose-[40,78] and oxygen-dependence
[27]. For this purpose, model-predicted insulin responses to stepwise increments in the
incoming glucose content were calcul ated as boundary integrals on the exiting surface
of the out-flowing fluid, and these were then fitted to the experimental insulin
responses measured as a function of time. First, the parameters of the second-phase
response (eq. 6) were fitted to the results of the staircase experiment [40], then those
of the first-phase response (eq. 7 and 8). Fine-tuning of the values has been done in a
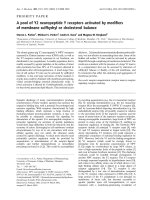
few iterative rounds to also fit the oxygen dependence [27]. As Figure 4 shows, accep-
table quantitative agreement can be obtained for both phase 1 and phase 2 responses
of the insulin secretion of human islets as measured recently in detailed experiments
[40]. The amplitude of the insulin response, which depends on the mass of functional
islets present, was adjusted for best fit , but it is within the expected range if calculated
for the corresponding number of islet equivalents (IEQ). Du ring the m odeling [79], it
became apparent that in order to have a correct time-scale and not a very short-term
first-phase release, some delay mechanism has to be introduced. After exploring several
possibilities, the delay was modeled by incorporation of a ‘localized’ insulin compart-
ment (e.g., intracellular) from which insulin is then released to the surroundings via
Figure 3 Geometry and a representative mesh used for the present FEM model. Two representative
spherical islets, which can be either free or encapsulated, are included in a tube with fluid flowing from
left to right.
Buchwald Theoretical Biology and Medical Modelling 2011, 8:20
/>Page 11 of 25
first order kinetics (k
insL
) (Figure 1). A main reason for this choice was that c on ce p -
tually,toagoodextent,thisinsulin secreted and stored ‘locally’ can be considered as
the insulin in the readily releasable pool (RRP) of granules in current dynamic cellu-
lar models of biphasic insulin secretion [37,65]. It is being filled in response to glu-
cose stimulation (R
ins
, eq. 9) and then gradually emptied (k
insL
). Our goal at this
point, is not to model the detailed cellular a nd subcellular mech anisms responsible
for the biphasic secretion and the staircase response [37,65,66], but to identify func-
tional forms for local responses (R
ins
)thatwhenintegratedwiththedescriptionsof
spatial distribution of the relevant concentrations can give an adequate quantitative
description (c
gluc
, c
oxy
® R
ins
® c
ins
). Most perifusion experiments intended to assess
islet quality are performed as single step low-high-low glucose perifusion experi-
ments; a fit for o ne such data is shown in Figure 5. Again, except for an underesti-
mate of the first-phase peak, acceptable agreement is obtained. First-phase insulin
secretion has been shown to be greater following a larger step-up in glucose to the
same final value (e.g., both in human [40] and in mouse [80] islets). The present
model should account for this as its first-phase insulin secretion rate is determined
by the glucose gradient, which increases directly with the size of the s tep-up; how-
ever, some fine-tuning of the parameters is still needed. The predicted first-phase
decay (resulting from k
insL
) may be a bit too slow (t
1/2
≈ 4min);however,thepredic-
tion of the second-phase decay is more adequate, and to keep the model as simple as
possible, we chose to use only one single ‘ local’ insulin ‘compartment’, hence, a single
first-order release rate k
insL
.
Figure 4 Glucose-induced insulin secretion in perifused human islets in response to stepwise
glucose increments. Glucose concentration in the perifusing solution increases from 1 mM (G1) to 30
mM (G30) as indicated. Values calculated with the present model (red line, — ) are shown superimposed
on the same time-scale over data determined experimentally (blue disks, ●; redrawn from [40]).
Buchwald Theoretical Biology and Medical Modelling 2011, 8:20
/>Page 12 of 25
Oxygen dependence
Because oxygen diffusion is a limiting factor in avascular islets, hypoxia can limit insu-
lin secretion. The oxygen dependence of local insulin release has be en parameterized
so as to fit the only detailed data available, which, however, are for rat islets [27]. Insu-
lin secretion profiles calculated here for different incoming oxygen concentrations in
response to a single glucose step are shown in Figure 5 for a few representative cases.
AsFigure6shows,theygiveagoodquantitativefitoftheexperimentaldataofrefer-
ence [27]. The problem, however, is complicated by the fact that due to the larger dif-
fusion distance, hypoxia is much more severe in the core regions of larger islets [33];
hence, hypoxia will have different effects on the insulin response of differently sized
islets. This can be seen in Figure 7 and Figure 8, which show the calculated spatial dis-
tributions of insulin, oxygen, and glucose concentrations under normoxic and slightly
hypoxic conditions as surface plots. Figure 9 provides further illustration by co mparing
oxygen concentrations and insulin secretion rates along a vertical cross section of the
two islets.
Accordingly, the overall experimental response to hypoxic conditions will depend on
the size-distri bution of the islet sample. Human islets seem to follow a Weibull distri-
bution with the expected value of islet diameter being around 95 μm and the expected
Figure 5 Oxygen dependence of the calculated GSIR in perifused human islets. Calculated insulin
outflow in response to a stepwise glucose increment from 1 mM (G1) to 15 mM (G15) and back for
different incoming oxygen concentrations as indicated by the pO
2
values shown at right. For the normoxic
values (red line, —), corresponding values determined experimentally (blue circles, ○; redrawn from [40])
are also shown for comparison.
Buchwald Theoretical Biology and Medical Modelling 2011, 8:20
/>Page 13 of 25
value of islet volume being 1.2 × 10
6
μm (corresponding to an islet with d =133μm)
[3]. In other words, most (human) islets are expected to have a diameter around 100
μm, but most of the islet mass (vol ume) is coming from islets with a diameter around
150 μm, which has been traditionally used as the standard islet (islet equivalent, IEQ)
[81,82]. Consequently, we ch ose two islets with d = 100 and 150 μmasrepresentative
for our simplified modeling.
It is important to note that even though local insulin release is becoming limited
only for oxygen concentrations below 4 mmHg (≈6 μM; eq. 9), the total insulin secre-
tion of the islets starts decreasing rapidly if surrounding oxygen levels drop below ~50
mmHg and is already half-maximal a round 25 mmHg (Figure 6). The reason, of
course, is that oxygen concentrations in the core of larger islets are considerable less
than in the surrounding media due to diffusion limitations (see Figure 8 and 9). It is
also worth noting that overall insulin response remains essentially unchanged until
oxygen pressures decrease down to ~50 mmHg (Figure 6), values that are present in
well vascularized tissues, and then decreases rapidly. This agrees well even with results
of in vivo experiments in dogs suggesting that moderate hypoxia (p
O2
≈ 40 mmHg)
does not affect insulin response, whereas more severe hypoxia (p
O2
≈ 25 mmHg) mark-
edly inhibits it [83]. A number of GSIR perifusion studies including [40] used solutions
gassed with enriched oxygen (e.g., 95% O
2
+5%CO
2
; p
O2
≈ 720 mmHg). Compared to
atmospheric oxygen (p
O2
≈ 140 mmHg), this does not produces any changes in the
insulin profile calculated with the present model (e.g., Figure 4) since w ith the islet
sizes used here atmospheric oxygen already provides sufficient oxygenation so that
insulin secretion is not limited (Figure 8A, Figure 9A). On the other hand, transplanted
Figure 6 Influence of oxygen concentration on the insulin secretion rate of perifused islets.Data
represent the fraction of normoxic (second-phase) rate at various oxygen levels in the perifusing media;
experimental data (blue triangles) are from [27] and values calculated here are shown as red disks for free
islets and orange circles for encapsulated islets. The size-distribution of the islet sample influences these
results as larger islets are more severely affected by hypoxia.
Buchwald Theoretical Biology and Medical Modelling 2011, 8:20
/>Page 14 of 25
islets are likely to be subject to oxygen levels below 50 mmHg [84] depending on the
seeding density and the vascularization of the surrounding tissue, which can further
limit their insulin secreting ability. Availability of oxygen is the main limiting factor
because, under physiological conditions, oxygen concentrations are considerably lower
than glucose concentrations (e.g., around 0.05-0.2 mM vs. 3-15 mM) [62], and this is
well illustrated by the present calculation in Figure 8 that compares oxygen and
Figure 7 Comparison of the calc ulated insulin distribut ion and secretion rate under variou s
conditions. Model calculated concentrations during an increase of incoming glucose to 10 mM
(corresponding to t = 120.5 min in Figure 4) in two perifused islets (d = 100 and 150 μm; flow from left to
right) under normoxic conditions (A), slightly hypoxic conditions (45 mmHg) (B), and slightly hypoxic
conditions and encapsulation (C). Data shown as surface plot are insulin concentration (1; shown color-
coded from blue for low to red for high-note different scales) and total insulin secretion rate (eq. 9) (2;
color-coded from green for 0 to red for high and shown on same scale). Gray streamlines and arrows
illustrate the velocity field of the flowing perifusion fluid, and colored contour lines show isolevels for the
perifusing glucose.
Buchwald Theoretical Biology and Medical Modelling 2011, 8:20
/>Page 15 of 25
glucose concentrations across the islets. Whereas glucose concentrations in the center
of larger islets are o nly a few percent lower than at the periphery, oxygen concentra-
tions in the center are considerably lower than at the periphery. R. T. Kennedy and
co-workers measured somewhat larger glucose concentration decreases in the center of
cultured islets (10-20%) [45], but even those are much less severe than the correspond-
ing oxygen decreases.
With the calibrated model, detailed simulations for arbitrary inflow conditions and
for arbitrary islet arrangements can be performed, and corresponding detailed graphics
Figure 8 Comparison of the calculated oxygen and glucose concentrations under various
conditions. Model calculated concentrations in two perifused islets under the same conditions as in
Figure 7: normoxic (A), slightly hypoxic (45 mmHg) (B), and slightly hypoxic and encapsulation (C). Data
shown as surface plot are oxygen concentration (3; shown color-coded from red for low to blue for high
with white indicating levels below the critical value C
cr,oxy
) and glucose concentration (4; shown color-
coded from blue for low to red for high). Oxygen concentrations are shown during an increase of
incoming glucose to 10 mM (same as in Figure 7); glucose concentrations are shown at a slightly later
time point at a constant incoming glucose of 10 mM to avoid the masking effect of the incoming glucose
gradient. Note differences in scale between oxygen and glucose, glucose concentrations decreasing by a
much smaller percentage than oxygen.
Buchwald Theoretical Biology and Medical Modelling 2011, 8:20
/>Page 16 of 25
Figure 9 Compar ison of oxygen le vels and insulin secretion ra tes along a vert ical cross section.
Calculated values along the vertical mid-section of Figure 3 (or Figure 7) through the two perifused islets
under normoxic conditions (atmospheric oxygen, 140 mmHg) (A), hypoxic conditions (resembling tissue
oxygen concentrations, 45 mmHg) (B), and hypoxic conditions and encapsulation (C). The two sets of
color-coded curves in each figure indicate calculated oxygen concentrations and insulin secretion rates,
respectively at various time-points corresponding to glucose concentrations of 3, 5, 7, and 10 mM. At
oxygen concentrations that transplanted islets are likely to encounter in their surrounding tissue (~40
mmHg), the insulin secretion of the core region of larger islets is severely compromised.
Buchwald Theoretical Biology and Medical Modelling 2011, 8:20
/>Page 17 of 25
and animations can easily be generated. For example, calculated insulin, oxygen, and
glucose concentrations along the perifusion chamber with two islets during a glucose
gradient are shown in Figure 7 together with the insulin secretion rates. A set of simi-
lar results is shown in Figure 9 along a vertical cross-section through the middle of
these figures. To illustrate the easy generalizability of the present approach, Additional
file 1, Figure S2 shows the results of calculations obtained for a case where a support-
ing filter was included in the tube. While this perturbs the flow, it has essentially no
effect on the overall insulin output justifying the simplifying assumptions made for the
present geometry (Figure 3). Increases in the perifusion rate (e.g., up to ten-fold) also
have no significant effect on calculated insulin output.
Figure 10 shows 3D graphs with insulin as height data and color-coded for the oxy-
gen concentrations to further highlight the results of d ecreasing oxygen concentration
inthecoreregionoflargerislets.Acorresponding set of animations a re included as
Supporting Information to illustrate the time-course of the first-and second-phase
responses following a glucose step (Additional file 2, Video S1; Additional file 3, Video
S2). At normoxic conditions (p
O2
= 140 mmHg in the incoming media), the core
region of even large i slets is still sufficiently oxygenized due to the flowing media;
hence, their insulin secretion is not limited. However, this is no longer true for hypoxic
Figure 10 Calculated insulin concentrations shown as height data. S urfaces are color -coded for
oxygen concentration (blue high, red low) for the same configuration and time-point shown in Figure 7
for free islets in normoxic (p
O2
= 140 mmHg) (A) and hypoxic conditions (p
O2
= 25 mmHg) (B) as well as
for encapsulated islets in normoxic conditions (C). The insulin secreting ability of the large islet is more
severely affected by hypoxia as clearly indicated by the changes in relative height between A and B (note
different scales).
Buchwald Theoretical Biology and Medical Modelling 2011, 8:20
/>Page 18 of 25
conditions as illustrated by Figure 9B or by Figure 10B showing the corresponding
results for p
O2
of 45 and 25 mmHg, respectively in the incoming media. Contrary to
the previous case, the two islets are predicted to secret about similar insulin amounts
despite their different sizes due to the more severe oxygen limitations in the core
region of the larger islet, which restricts insulin secretion to an outside shell only in
large islets. These results are in good agreement with observations suggesting that
smal ler islets tend to perform better in islet transplantation (with or without encapsu-
lation) [85-88].
Encapsulated islets
In patients with type 1 diabetes mellitus, the transplantation of pancreatic islet cells
can normalize metabolic control in a way that has been virtually impossible to
achieve with exogenous i nsulin, and is being explored, in a selected cohort of patients
with brittle diabetes, as an experimental therapy [89,90]. To avoi d the need for life-
long immunosuppression, islet encapsulation using semi-permeable membranes and
various t echniques has long been explored as a possible approach to develop a bioar-
tificial pancreas-an organ capable of releasing insulin in a biomimetic manner in
response to plasma glucose changes [11-13].Manyfailedattempts[91]madeitclear
that minimizing the extra vo lume of encapsu lating material (as well as cellular over-
growth) and the corre sponding diffusional limitations a re crucial for graft success.
Hence, there is a considerable interest in modeling the insulin responses of such
devices [20-26].
Encapsulated islets remain avascular; hence, the present software can be easily
extended to model their behavior under perifusion or tissue transplant conditions. For
example, as Figure 11 shows, simulations w ith the present model for microencapsu-
lated islets (assuming hydrogel-like encapsulating material of a relatively modest width,
l =150μm) predicts that perifusion results in somewhat delayed and dampened insu-
lin response, but insulin response kinetics is maintained to a good degree. This is in
good agreement with some experimental results obtained, for example, with alginate
microencapsulated islets (using oxygen-enriched perifusion media to minimize the
effects of oxygen limitation) [92,93]. However, at lower perifusing oxygen concentra-
tions, such as those mimicking tissue oxygen concentrations that transplanted islets
are likely to encounter even in well-vascularized tissue (p
O2
= 35-45 mmHg; c
oxy
=
0.05-0.065 mM), the loss in insulin secreting ability is much more significant as the
encapsulated islets here suffer much more heavily from hypoxia (Figure 7, Figure 9,
and Figure 10). Whereas, under these conditions, free islets can still secrete insulin at
around 70-75% of their normal rate (and, for transplanted islets, will improve with
time as their vasculature is restored), encapsulated islets can only operate at around
50%ofthefullrateandtheirresponse is especially hampered at larger glucose l evels
(Figure 6, Figure 11). As nicely illustrated by Figure 7 and Figure 9, only a relatively
small percentage of the encapsulated islets cells is able to secrete insulin at full capa-
city; oxygen diffusion limitations severely restrict the hormone secreting ability of the
core regions even at this relatively thin microcapsule size-further emphasizing the need
for conformal/nano-coating or o ther alternative a pproaches [13,94,95]. These results
reconfirm the finding of some previous modeling work with cultured or encapsulated
islets [75,76], which focused on the limiting effect of hypoxia but without incorporating
Buchwald Theoretical Biology and Medical Modelling 2011, 8:20
/>Page 19 of 25
details of the glucose-insulin response, that also su ggested that the use of smaller islets
(or islet cell aggregates) could reduce the impact of oxygen diffusion limitation.
Modeling considerations
Obviously, this is still a much simplified, exploratory model; the actual mechanism of
glucose-induced insulin secretion in b-cells is comp lex and involves various molecular-
level events [1,2,36,37,39,70,96,97]. Th e present model gives an adequa te quantitative
description of the main distinctive features of insulin release, but, at this stage, does
not account for interspecies differences and does not incorporate a number of effects
known to affect glucose-induced insulin release including, e.g., amplifiers such as glu-
cag on-like peptide-1 (GLP-1) as well as time-dependent effects (i.e., both time- depe n-
dent inhibition and potentiation; e.g., the “glucose priming” effect) [98].
One of the most complex technical cont rol systems that is widely used in indus tria l
control systems and has been suggested as a possibility for the glucose-insulin control
system is the proportional-integral-derivative controller (PID controller) [1,8-10]. PID
controllers are also particularly promising for closed-loop insulin delivery systems with
continuous glucose sensors [8-10,99]. This control loop feedback mechanism uses a
combination of proportional, integral, and differential (PID) terms so that the control
signal has elements that are functions of the error signal itself (ε = ξ - ξ
o
, the difference
Figure 11 Calculated GSIR in perifused free vs. encapsulated islets. Insulin outflow calculated in
response to stepwise glucose increments from 1 mM (G1) to 30 mM (G30) under normoxic (continuous
line, pO
2
= 140 mmHg) and slightly hypoxic (dashed line; pO
2
= 45 mmHg) conditions for free (red) vs.
encapsulated islets (orange). The response of normoxic free islets is the same as given in Figure 4.
Buchwald Theoretical Biology and Medical Modelling 2011, 8:20
/>Page 20 of 25
between the existing output ξ and its desired value ξ
o
), its integral (∫εdt), and its differ-
ent ial (dε/dt) . In other words, the controller output signal ψ can be written as a func-
tion of time as:
ψ
PID
(t )=α
p
ε(t)+α
i
t
0
ε(τ )dτ + α
d
dε(t)
dt
(11)
PID control works great in linear systems; however, biological systems are never fully
linear: proportional responses are only possible over some limited range as biological
responses (e.g., hormone secretion rates, enzymatic degradation rates, nerve firing
rates, etc.) are always limited between zero and some maximum value. Biologic systems
are always nonlinear, never stationary, but robust, whic h often comes from coupling of
different, overlapping systems [1]. Accordingly, responses in biologic systems are much
better described by sigmoid functions; hence, the present suggestion for sigmoid pro-
portional-integral-derivativ e controllers (SPID control lers) for biologic respon ses. Use
of the Hill function f
H
(eq. 2) allows sigmoid responses wit h limited maximum rates
(R
max
) and flexible shapes (n):
ψ
SPID
(t )=α
p
f
H
[ε(t)] + α
i
f
H
⎡
⎣
t
t−θ
ε(τ )dτ
⎤
⎦
+ α
d
f
H
dε(t)
dt
(12)
Here,weusedthesigmoiddirect(proportional)termtomodeltheoxygenandglu-
cose consumptions as well as the second phase insulin release, and the sigmoid differ-
ential term to model the first-phase insulin release (with c
gluc
itself as the “error” signal
ε; Figure 1). As always, the role of the differential term is to speed up the system; i.e .,
to give a large correction signal as soon as possible when the monitored value changes
suddenly-exactly the role played by the first-phase insulin secretion. In the present
model, we could not yet implement an integral term d espite a clear need for such a
term over a specified time interval to account, for example, for some inertia and/or
delay in insulin secretion (integral control is part of several models, i.e.,
[8-10,73,99,100]). However, addition of the extra compartment for delayed insulin
release actual ly incorporates some elements usual ly accounted for by such an integral
term.
Conclusion
In conclusi on, a comprehensive insulin secret ion model for avascular pancreatic islets
has been implemented using Hill-type sigmoid response functions to describe both glu-
cose and oxygen dependence. Detailed spatial distributions of all concentrations of
interest are incorporated and coupled via local consumption and release functions. Fol-
lowing parameterization, good fit could be obtai ned with experimental perifusion data
of human i slets. Further optimization of the model is required; however, the present
approach makes it relatively straightforward to couple arbitrarily complex hormone
secretion and nutrient consumption kinetics with diffusive and even convective trans-
port and run simulations with realistic geometries without symmetry or other restric-
tions-problems that seriously limited previous glucose-insulin modeling attempts.
Because of the general framew ork of the implementation, the model not only help s in
the elucidation of the quantitative aspects of the insulin secretion dynamics, but al so
Buchwald Theoretical Biology and Medical Modelling 2011, 8:20
/>Page 21 of 25
all ows the in silico exploration of various conformations inv olving cultured, perifused,
transplanted, or encapsulated islets including the simulation of GSIR perifusion exp eri-
ments or the study of the performance of bioartificial pancreas type devices.
Additional material
Additional file 1: Supporting Information, Figures S1 and S2. Two supporting figures with Figure S1 showing
the local oxygen-dependent modulating function and Figure S2 showing model calculations with a supporting
filter included in the perifusion tube.
Additional file 2: Supporting Information, Video S1. Movie file showing the time-course of the insulin response
of two islets to a glucose step (3 mM ® 11 mM ® 3 mM) under normoxic conditions (pO
2
140 mmHg) in a 3D
representation with insulin concentration as height data and a surface color-coded for oxygen concentration
(similar to Figure 10).
Additional file 3: Supporting Information, Video S2. Movie file showing the time-course of the insulin response
of two islets to a glucose step (3 mM ® 11 mM ® 3 mM) under hypoxic conditions (pO
2
25 mmHg) in a 3D
representation with insulin concentration as height data and a surface color-coded for oxygen concentration
(similar to Figure 10).
Acknowledgements
The financial support of the Diabetes Research Institute Foundation that made this
work possible is gratefully acknowledged.
Authors’ contributions
PB is the only author.
Competing interests
The author declares that he has no competing interests.
Received: 25 April 2011 Accepted: 21 June 2011 Published: 21 June 2011
References
1. Hallgreen CE, Korsgaard TV, Hansen RN, Colding-Jørgensen M: The glucose-insulin control system. In Biosimulation in
Drug Development. Edited by: Bertau M, Mosekilde E, Westerhoff HV. Weinheim: Wiley-VCH; 2008:141-196.
2. Suckale J, Solimena M: Pancreas islets in metabolic signaling-focus on the beta-cell. Front Biosci 2008, 13:7156-7171.
3. Buchwald P, Wang X, Khan A, Bernal A, Fraker C, Inverardi L, Ricordi C: Quantitative assessment of islet cell products:
estimating the accuracy of the existing protocol and accounting for islet size distribution. Cell Transplant 2009,
18:1223-1235.
4. Kahn SE, Hull RL, Utzschneider KM: Mechanisms linking obesity to insulin resistance and type 2 diabetes. Nature
2006, 444:840-846.
5. Wyatt SB, Winters KP, Dubbert PM: Overweight and obesity: prevalence, consequences, and causes of a growing
public health problem. Am J Med Sci 2006, 331:166-174.
6. Wang Y, Beydoun MA: The obesity epidemic in the United States-gender, age, socioeconomic, racial/ethnic, and
geographic characteristics: a systematic review and meta-regression analysis. Epidemiol Rev 2007, 29:6-28.
7. Galletti PM, Colton CK, Jaffrin M, Reach G: Artificial pancreas. In The Biomedical Engineering Handbook Tissue Engineering
and Artificial Organs 3 edition. Edited by: Bronzino JD. Boca Raton, FL: CRC Press; 2006:71.71-71.18.
8. Steil GM, Rebrin K, Janowski R, Darwin C, Saad MF: Modeling beta-cell insulin secretion-implications for closed-loop
glucose homeostasis. Diabetes Technol Ther 2003, 5:953-964.
9. Steil GM, Panteleon AE, Rebrin K: Closed-loop insulin delivery-the path to physiological glucose control. Adv Drug
Deliv Rev 2004, 56:125-144.
10. Hovorka R: Continuous glucose monitoring and closed-loop systems. Diabet Med 2006, 23:1-12.
11. Soon-Shiong P: Treatment of type I diabetes using encapsulated islets. Adv Drug Deliv Rev 1999, 35:259-270.
12. Silva AI, de Matos AN, Brons IG, Mateus M: An overview on the development of a bio-artificial pancreas as a
treatment of insulin-dependent diabetes mellitus. Med Res Rev 2006, 26:181-222.
13. Teramura Y, Iwata H: Bioartificial pancreas microencapsulation and conformal coating of islet of Langerhans. Adv
Drug Deliv Rev 2010, 62:827-840.
14. Bergman RN, Ider YZ, Bowden CR, Cobelli C: Quantitative estimation of insulin sensitivity. Am J Physiol Endocrinol
Metab 1979, 236:E667-E677.
15. Toffolo GM, Cobelli C: Insulin modeling. In Modeling Methodology for Physiology and Medicine. Edited by: Carson E,
Cobelli C. San Diego: Academic Press; 2001:305-335.
16. Makroglou A, Li J, Kuang Y: Mathematical models and software tools for the glucose-insulin regulatory system and
diabetes: an overview.
Appl Num Math 2006, 56:559-573.
17. Boutayeb A, Chetouani A: A critical review of mathematical models and data used in diabetology. Biomed Eng
Online 2006, 5:43, art.
18. Matthews DR, Hosker JP, Rudenski AS, Naylor BA, Treacher DF, Turner RC: Homeostasis model assessment: insulin
resistance and beta-cell function from fasting plasma glucose and insulin concentrations in man. Diabetologia
1985, 28:412-419.
Buchwald Theoretical Biology and Medical Modelling 2011, 8:20
/>Page 22 of 25
19. Wallace TM, Levy JC, Matthews DR: Use and abuse of HOMA modeling. Diabetes Care 2004, 27:1487-1495.
20. Reach G, Jaffrin MY: Kinetic modelling as a tool for the design of a vascular bioartificial pancreas: feedback
between modelling and experimental validation. Comput Methods Programs Biomed 1990, 32:277-285.
21. Pillarella MR, Zydney AL: Theoretical analysis of the effect of convective flow on solute transport and insulin release
in a hollow fiber bioartificial pancreas. J Biomech Eng 1990, 112:220-228.
22. Todisco S, Calabro V, Iorio G: A lumped parameter mathematical model of a hollow fiber membrane device for the
controlled insulin release. J Membr Sci 1995, 106:221-232.
23. Tziampazis E, Sambanis A: Tissue engineering of a bioartificial pancreas: modeling the cell environment and device
function. Biotechnol Prog 1995, 11:115-126.
24. Buladi BM, Chang CC, Belovich JM, Gatica JE: Transport phenomena and kinetics in an extravascular bioartificial
pancreas. AIChE J 1996, 42:2668-2682.
25. Dulong JL, Legallais C: Contributions of a finite element model for the geometric optimization of an implantable
bioartificial pancreas. Artif Organs 2002, 26:583-589.
26. Dulong JL, Legallais C: What are the relevant parameters for the geometrical optimization of an implantable
bioartificial pancreas? J Biomech Eng 2005, 127:1054-1061.
27. Dionne KE, Colton CK, Yarmush ML: Effect of hypoxia on insulin secretion by isolated rat and canine islets of
Langerhans. Diabetes 1993, 42:12-21.
28. Sweet IR, Khalil G, Wallen AR, Steedman M, Schenkman KA, Reems JA, Kahn SE, Callis JB: Continuous measurement of
oxygen consumption by pancreatic islets. Diabetes Technol Therap 2002, 4:661-672.
29. Cabrera O, Jacques-Silva MC, Berman DM, Fachado A, Echeverri F, Poo RE, Khan A, Kenyon NS, Ricordi C, Berggren P-O,
Caicedo A: Automated, high-throughput assays for evaluation of human pancreatic islet function. Cell Transplant
2008, 16:1039-1048.
30. Bocca N, Pileggi A, Molano RD, Marzorati S, Wu W, Bodor N, Ricordi C, Buchwald P: Soft corticosteroids for local
immunosuppression: exploring the possibility for the use of loteprednol etabonate in islet transplantation.
Pharmazie 2008, 63:226-232.
31. Dishinger JF, Reid KR, Kennedy RT: Quantitative monitoring of insulin secretion from single islets of Langerhans in
parallel on a microfluidic chip. Anal Chem 2009, 81:3119-3127.
32. Truskey GA, Yuan F, Katz DF: Transport Phenomena in Biological Systems Upper Saddle River, NJ: Pearson Prentice Hall;
2004.
33. Buchwald P: FEM-based oxygen consumption and cell viability models for avascular pancreatic islets. Theor Biol
Med Model 2009, 6:5.
34. Ohta M, Nelson D, Nelson J, Meglasson MD, Erecinska M: Oxygen and temperature dependence of stimulated insulin
secretion in isolated rat islets of Langerhans. J Biol Chem 1990, 265:17525-17532.
35. Wang W, Upshaw L, Strong DM, Robertson RP, Reems J: Increased oxygen consumption rates in response to high
glucose detected by a novel oxygen biosensor system in non-human primate and human islets. J Endocrinol 2005,
185:445-455.
36. Hedeskov CJ: Mechanism of glucose-induced insulin secretion. Physiol Rev 1980, 60:442-509.
37. Rorsman P, Eliasson L, Renstrom E, Gromada J, Barg S, Gopel S: The cell physiology of biphasic insulin secretion. News
Physiol Sci 2000, 15:72-77.
38. Henquin JC: Triggering and amplifying pathways of regulation of insulin secretion by glucose. Diabetes 2000,
49:1751-1760.
39. Henquin JC: Regulation of insulin secretion: a matter of phase control and amplitude modulation. Diabetologia
2009, 52:739-751.
40. Henquin JC, Dufrane D, Nenquin M: Nutrient control of insulin secretion in isolated normal human islets. Diabetes
2006, 55:3470-3477.
41. Comsol AB: COMSOL Multiphysics Modeling Guide, version 3.4 COMSOL AB; 2007.
42. Riley KF, Hobson MP, Bence SJ: Mathematical Methods for Physics and Engineering. A Comprehensive Guide Cambridge:
Cambridge University Press; 1997.
43. Groebe K, Erz S, Mueller-Klieser W: Glucose diffusion coefficients determined from concentration profiles in EMT6
tumor spheroids incubated in radioactively labeled L-glucose. Adv Exp Med Biol 1994, 361:619-625.
44. Bashkatov AN, Genina EA, Sinichkin YP, Kochubey VI, Lakodina NA, Tuchin VV: Glucose and mannitol diffusion in
human dura mater. Biophys J 2003, 85:3310-3318.
45. Kauri LM, Jung SK, Kennedy RT: Direct measurement of glucose gradients and mass transport within islets of
Langerhans. Biochem Biophys Res Commun 2003, 304:371-377.
46. Novak MT, Yuan F, Reichert WM: Modeling the relative impact of capsular tissue effects on implanted glucose
sensor time lag and signal attenuation. Anal Bioanal Chem 2010, 398:1695-1705.
47. Søeborg T, Rasmussen CH, Mosekilde E, Colding-Jørgensen M: Absorption kinetics of insulin after subcutaneous
administration. Eur J Pharm Sci 2009, 36:78-90.
48. Li RH, Altreuter DH, Gentile FT: Transport characterization of hydrogel matrices for cell encapsulation. Biotechnol
Bioeng 1996, 50:365-373.
49. Hill AV: The possible effects of the aggregation of the molecules of haemoglobin on its dissociation curves. J
Physiol 1910, 40:iv-vii.
50. Hill AV: The combinations of haemoglobin with oxygen and with carbon monoxide. Biochem J 1913, 7:471-480.
51. Goutelle S, Maurin M, Rougier F, Barbaut X, Bourguignon L, Ducher M, Maire P: The Hill equation: a review of its
capabilities in pharmacological modelling. Fundam Clin Pharmacol 2008, 22:633-648.
52. Michaelis L, Menten ML: Die Kinetik der Invertinwirkung. Biochem Z 1913, 49:333-369.
53. Buchwald P: Exploratory FEM-based multiphysics oxygen transport and cell viability models for isolated pancreatic
islets. In Proceedings of the COMSOL Conference 2008 Boston. Edited by: Dravid V. Boston: Comsol, Inc.; 2008:.
54. Wilson DF, Rumsey WL, Green TJ, Vanderkooi JM: The oxygen dependence of mitochondrial oxidative
phosphorylation measured by a new optical method for measuring oxygen concentration. J Biol Chem 1988,
263:2712-2718.
Buchwald Theoretical Biology and Medical Modelling 2011, 8:20
/>Page 23 of 25
55. Avgoustiniatos ES, Colton CK: Effect of external oxygen mass transfer resistances on viability of immunoisolated
tissue. Ann NY Acad Sci 1997, 831:145-167.
56. Longo EA, Tornheim K, Deeney JT, Varnum BA, Tillotson D, Prentki M, Corkey BE: Oscillations in cytosolic free Ca
2+
,
oxygen consumption, and insulin secretion in glucose-stimulated rat pancreatic islets. J Biol Chem 1991,
266:9314-9319.
57. Sweet IR, Gilbert M, Scott S, Todorov I, Jensen R, Nair I, Al-Abdullah I, Rawson J, Kandeel F, Ferreri K: Glucose-
stimulated increment in oxygen consumption rate as a standardized test of human islet quality. Am J Transplant
2008, 8:183-192.
58. Cornolti R, Figliuzzi M, Remuzzi A: Effect of micro-and macroencapsulation on oxygen consumption by pancreatic
islets. Cell Transplant 2009, 18:195-201.
59. Hedeskov CJ, Hertz L, Nissen C: The effect of mannoheptulose on glucose-and pyruvate-stimulated oxygen uptake
in normal mouse pancreatic islets. Biochim Biophys Acta 1972, 261:388-397.
60. Goto M, Abe H, Ito-Sasaki T, Goto M, Inagaki A, Ogawa N, Fujimori K, Kurokawa Y, Matsue T, Satomi S: A novel
predictive method for assessing the quality of isolated pancreatic islets using scanning electrochemical
microscopy. Transplant Proc 2009, 41:311-313.
61. Comsol AB: COMSOL Multiphysics User’s Guide, version 3.4 COMSOL AB; 2007.
62. Martin Y, Vermette P: Bioreactors for tissue mass culture: design, characterization, and recent advances. Biomaterials
2005, 26:7481-7503.
63. Grodsky GM: A threshold distribution hypothesis for packet storage of insulin and its mathematical modeling.
J Clin Invest 1972, 51:2047-2059.
64. Purrello F, Rabuazzo AM, Anello M, Patane G: Effects of prolonged glucose stimulation on pancreatic beta cells: from
increased sensitivity to desensitization. Acta Diabetol Lat 1996, 33:253-256.
65. Pedersen MG, Corradin A, Toffolo GM, Cobelli C: A subcellular model of glucose-stimulated pancreatic insulin
secretion. Philos Transact A Math Phys Eng Sci 2008, 366:3525-3543.
66. Pedersen MG, Toffolo GM, Cobelli C: Cellular modeling: insight into oral minimal models of insulin secretion. Am J
Physiol Endocrinol Metab 2010, 298:E597-E601.
67. Topp B, Promislow K, deVries G, Miura RM, Finegood DT: A model of beta-cell mass, insulin, and glucose kinetics:
pathways to diabetes. J Theor Biol 2000, 206:605-619.
68. Malaisse WJ, Sener A, Herchuelz A, Hutton JC: Insulin release: the fuel hypothesis. Metabolism 1979, 28:373-386.
69. Matschinsky FM, Glaser B, Magnuson MA: Pancreatic beta-cell glucokinase: closing the gap between theoretical
concepts and experimental realities. Diabetes 1998, 47:307-315.
70. Fridlyand LE, Philipson LH: Glucose sensing in the pancreatic beta cell: a computational systems analysis. Theor Biol
Med Model 2010, 7:15.
71. Ritzel RA, Veldhuis JD, Butler PC: Glucose stimulates pulsatile insulin secretion from human pancreatic islets by
increasing secretory burst mass: dose-response relationships. J Clin Endocrinol Metab 2003, 88:742-747.
72. Nomura M, Shichiri M, Kawamori R, Yamasaki Y, Iwama N, Abe H: A mathematical insulin-secretion model and its
validation in isolated rat pancreatic islets perifusion. Comput Biomed Res 1984, 17:570-579.
73. Breda E, Cavaghan MK, Toffolo G, Polonsky KS, Cobelli C: Oral glucose tolerance test minimal model indexes of beta-
cell function and insulin sensitivity. Diabetes 2001, 50:150-158.
74. Mari A, Schmitz O, Gastaldelli A, Oestergaard T, Nyholm B, Ferrannini E: Meal and oral glucose tests for assessment of
beta-cell function: modeling analysis in normal subjects. Am J Physiol Endocrinol Metab 2002, 283:E1159-E1166.
75. Avgoustiniatos ES: Oxygen diffusion limitations in pancreatic islet culture and immunoisolation. PhD Thesis MIT;
2001.
76. Johnson AS, Fisher RJ, Weir GC, Colton CK: Oxygen consumption and diffusion in assemblages of respiring spheres:
Performance enhancement of a bioartificial pancreas. Chem Eng Sci 2009, 64:4470-4487.
77. Buchwald P: A general bilinear model to describe growth or decline time-profiles. Math Biosci 2007, 205:108-136.
78. Dufrane D, Nenquin M, Henquin JC: Nutrient control of insulin secretion in perifused adult pig islets. Diabetes Metab
2007, 33:430-438.
79. Buchwald P: COMSOL Multiphysics-based exploratory insulin secretion model for isolated pancreatic islets.
Presented at COMSOL Conference 2010 Boston. COMSOL Conference 2010 Boston; October 7-9; Boston, MA COMSOL,
Inc.; 2010.
80. Henquin JC, Nenquin M, Stiernet P, Ahren B: In vivo and in vitro glucose-induced biphasic insulin secretion in the
mouse: pattern and role of cytoplasmic Ca2+ and amplification signals in beta-cells. Diabetes 2006, 55:441-451.
81. Ricordi C, Gray DWR, Hering BJ, Kaufman DB, Warnock GL, Kneteman NM, Lake SP, London NJM, Socci C, Alejandro R,
Zeng Y, Scharp DW, Viviani G, Falqui L, Tzakis A, Bretzel RG, Federlin K, Pozza G, James RFL, Rajotte RV, Di Carlo V,
Morris PJ, Sutherland DER, Starzl TE, Mintz DH, Lacy PE: Islet isolation assessment in man and large animals. Acta
Diabetol Lat 1990, 27:185-195.
82. Kissler HJ, Niland JC, Olack B, Ricordi C, Hering BJ, Naji A, Kandeel F, Oberholzer J, Fernandez L, Contreras J, Stiller T,
Sowinski J, Kaufman DB: Validation of methodologies for quantifying isolated human islets: an islet cell resources
study. Clin Transplant 2010, 24:236-242.
83. Baum D, Griepp R, Porte D Jr: Glucose-induced insulin release during acute and chronic hypoxia. Am J Physiol 1979,
237:E45-E50.
84. Carlsson PO, Palm F, Andersson A, Liss P: Chronically decreased oxygen tension in rat pancreatic islets transplanted
under the kidney capsule. Transplantation 2000, 69:761-766.
85. MacGregor RR, Williams SJ, Tong PY, Kover K, Moore WV, Stehno-Bittel L: Small rat islets are superior to large islets in
in vitro function and in transplantation outcomes. Am J Physiol Endocrinol Metab 2006, 290:E771-E779.
86. Lehmann R, Zuellig RA, Kugelmeier P, Baenninger PB, Moritz W, Perren A, Clavien PA, Weber M, Spinas GA: Superiority
of small islets in human islet transplantation. Diabetes 2007, 56:594-603.
87. O’Sullivan ES, Johnson AS, Omer A, Hollister-Lock J, Bonner-Weir S, Colton CK, Weir GC: Rat islet cell aggregates are
superior to islets for transplantation in microcapsules. Diabetologia 2010, 53:937-945.
88. Skiles ML, Fancy R, Topiwala P, Sahai S, Blanchette JO: Correlating hypoxia with insulin secretion using a fluorescent
hypoxia detection system. J Biomed Mater Res B Appl Biomater 2011, 97B:148-155.
Buchwald Theoretical Biology and Medical Modelling 2011, 8:20
/>Page 24 of 25
89. Ricordi C, Strom TB: Clinical islet transplantation: advances and immunological challenges. Nat Rev Immunol 2004,
4:259-268.
90. Fiorina P, Shapiro AM, Ricordi C, Secchi A: The clinical impact of islet transplantation. Am J Transplant 2008,
8:1990-1997.
91. King S: The evolution of islet encapsulation ventures [ />research].
92. Garfinkel MR, Harland RC, Opara EC: Optimization of the microencapsulated islet for transplantation. J Surg Res 1998,
76:7-10.
93. de Vos P, Smedema I, van Goor H, Moes H, van Zanten J, Netters S, de Leij LF, de Haan A, de Haan BJ: Association
between macrophage activation and function of micro-encapsulated rat islets. Diabetologia 2003, 46:666-673.
94. Fort A, Fort N, Ricordi C, Stabler CL: Biohybrid devices and encapsulation technologies for engineering a bioartificial
pancreas. Cell Transplant 2008, 17:997-1003.
95. Buchwald P, Bocca N, Marzorati S, Hochhaus G, Bodor N, Stabler C, Kenyon NS, Inverardi L, Molano RD, Ricordi C,
Pileggi A: Feasibility of localized immunosuppression: 1. Exploratory studies with glucocorticoids in a biohybrid
device designed for cell transplantation. Pharmazie 2010, 65:421-428.
96. Rorsman P, Renström E: Insulin granule dynamics in pancreatic beta cells. Diabetologia 2003, 46:1029-1045.
97. MacDonald PE, Joseph JW, Rorsman P: Glucose-sensing mechanisms in pancreatic beta-cells. Philos Trans R Soc Lond
B Biol Sci 2005, 360:2211-2225.
98. Nesher R, Cerasi E: Modeling phasic insulin release: immediate and time-dependent effects of glucose. Diabetes
2002, 51(Suppl 1):S53-S59.
99. Renard E, Place J, Cantwell M, Chevassus H, Palerm CC: Closed-loop insulin delivery using a subcutaneous glucose
sensor and intraperitoneal insulin delivery: feasibility study testing a new model for the artificial pancreas. Diabetes
Care 2010, 33:121-127.
100. Cretti A, Lehtovirta M, Bonora E, Brunato B, Zenti MG, Tosi F, Caputo M, Caruso B, Groop LC, Muggeo M,
Bonadonna RC: Assessment of beta-cell function during the oral glucose tolerance test by a minimal model of
insulin secretion. Eur J Clin Invest 2001, 31:405-416.
doi:10.1186/1742-4682-8-20
Cite this article as: Buchwald: A local glucose-and oxygen concentration-based insulin secretion model for
pancreatic islets. Theoretical Biology and Medical Modelling 2011 8:20.
Submit your next manuscript to BioMed Central
and take full advantage of:
• Convenient online submission
• Thorough peer review
• No space constraints or color figure charges
• Immediate publication on acceptance
• Inclusion in PubMed, CAS, Scopus and Google Scholar
• Research which is freely available for redistribution
Submit your manuscript at
www.biomedcentral.com/submit
Buchwald Theoretical Biology and Medical Modelling 2011, 8:20
/>Page 25 of 25