Báo cáo y học: " Optimizing automated characterization of liver fibrosis histological images by investigating color spaces at different resolutions" pptx
Bạn đang xem bản rút gọn của tài liệu. Xem và tải ngay bản đầy đủ của tài liệu tại đây (1.3 MB, 12 trang )
RESEARCH Open Access
Optimizing automated characterization of liver
fibrosis histological images by investigating color
spaces at different resolutions
Doaa Mahmoud-Ghoneim
1,2
Correspondence:
1
Physics Department, Faculty of
Science, United Arab Emirates
University, Al-Ain, UAE
Full list of author information is
available at the end of the article
Abstract
Texture analysis (TA) of histological images has recently received attention as an
automated method of characterizing liver fibrosis. The colored staining methods
used to identify different tissue components reveal various patterns that contribute
in different ways to the digital texture of the image. A histological digital image can
be represented with various color spaces. The approximation processes of pixel
values that are carried out while converting between different color spaces can
affect image texture and subsequently could influence the performance of TA.
Conventional TA is carried out on grey scale images, which are a luminance
approximation to the original RGB (Red, Green, and Blue) space. Currently, grey scale
is considered sufficient for characterization of fibrosis but this may not be the case
for sophisticated assessment of fibrosis or when resolution conditions vary. This
paper investigates the accuracy of TA results on three color spaces, conventional
grey scale, RGB, and Hue-Saturation-Intensity (HSI), at different resolutions. The results
demonstrate that RGB is the most accurate in texture classification of liver images,
producing better results, most notably at low resolution. Furthe rmore, the green
channel, which is dominated by collagen fiber deposition, appears to provide most
of the features for characterizing fibrosis images. The HSI space demonstrated a high
percentage error for the majority of texture methods at all resolutions, suggesting
that this space is insufficient for fibrosis characterization. The grey scale space
produced good results at high resolution; however, errors increased as resolution
decreased.
Background
Digital encoding of microscopic images has enhanced the value of histological analysis,
allowing quantitative rather than only qualitative assessment, using image analysi s and
measur ement methods [1,2]. Image analysis techniques can describe a histological sec-
tion and assign digit al patterns to one or more pre-defined categories, allowing histo-
pathologists to refer to a consistent database of features collected from similar cases
rather than relying on subjective human assessments of individual samples. However,
the limitations of image analysis methods must be considered. In addition to the classi-
cal problem concerning artifacts in histological sections, difficulties related to image
quality including noise, resolution, contrast and illumination should be controlled. The
effect of these factors on digital histological images has not been fully investigated but
there is growing interest in this area [3,4]. Auto mated approaches can be categorized
Mahmoud-Ghoneim Theoretical Biology and Medical Modelling 2011, 8:25
/>© 2011 Mahmoud-Ghoneim; licensee BioMed Central Ltd. This is an Open Access article distributed under the terms of the Creative
Commons Attribut ion License ( which permits unre stricted use, distribution, and
reproduction in any medium, provided the original work is properly cited.
as texture, object and structure -based analysis [2]. According to Kayser et al.[2],tex-
ture-based analysis is defined as grey value pe r pixel measure, and it is independent
from any segmentation procedure. It results in recursive vectors derived from time ser-
ies analysis and image features obtained by spatial dependent and independent trans-
formations [2]. Object-based features are defined as grey value per biological object
measured, and structure-based features rely on i dentifying structural patterns that
characterize a structure.
This research concerns the elaboration of texture-based features from microscopic
images using a method known in the literature as Texture Analysis (TA). TA is a digi-
tal image analysis method that was successf ully applied to medical and histological
images. TA contributes to tissue characterization by detecting pathological modifica-
tions and can be used to characterize the effect of a given treatment. For example, TA
can be used for detecting the progression or reg ression of a dise ase [5], and for thera-
peutic follow-up of subjects that respond to treatment and those that do not [1].
Therefore, TA provides a wide range of pharmacological applications. Features
extracted fr om clinical and experimental digital images are subjected to a classification
process that orders input data into output classes. Usually, these classes are interpreted
in terms of relevance to other histologi cal or biochemical parameters. TA has a parti-
cular diagnostic importance when local heterogeneities are investigated or when the
disease is subtle and hard to detect visually [6]. Owing to successful characterization of
tissues at various levels of progression and protection [1,7], histopathologists became
interested in utilizing TA in pro blematic diagnostic tasks, such as grade assessment
(grading), which is usually limited by a large number of variables, sample size restric-
tions and sampling variability [8]. TA is a faster quantitative tool than conventional
human-dependent methods that are time consuming and unlikely to be error-free [8].
Thetimefactorisacrucialelement in the choice of assessment method, particularly
in clinical applications, where large numbers of patients are scheduled for routine
scanning. Grading and other automated assessment ta sks require the accuracy of TA
to be improved to increase its diagnostic value.
Previous work by the author revealed that the microscopic section staining protocol
can play a major role in TA of liver fibrosis, demonstrating that histological texture
can differ according to the staining protocol used and due to chemical interactions
between the dye and the cel l/tissue components that cause staining to appear [ 7]. The
staining protocol confers specific colors to different cell components; the colors vary in
terms of intensity and saturation depending on the underlying chemical interactions. In
conv entional TA, the original multi-channel colored sections are transformed into the
corresponding s ingle channel of the grey s cale [1]; therefore, the texture specific t o a
color channel is lost, and instead, the texture of the approximated single channel
appears. However, the grey scale image has been considered sufficient for fibrosis char-
acterization in p revious studies [7], but for more sophisticated assessm ent tasks (such
as grading), the approximation of colored images to the grey scale could result in the
loss of valuable texture information embedded in the individual color channels. This
information could be crucial for increasing the accuracy of this method.
Color is an intrinsic attribute that provides more visual information than the grey
scale. There have been several attempts to incorporate color information into texture
[9,10] but the choice of which color space is best for performing TA has received little
Mahmoud-Ghoneim Theoretical Biology and Medical Modelling 2011, 8:25
/>Page 2 of 12
attentio n [3]. Research concerning the human visual system suggested that the overall
perception of color is formed through the interaction of a luminance component, a
chrominance component and the achromatic pattern [11]. The luminance and chromi-
nance components extract color information, while the achromatic pattern component
concerns texture. There are two approaches concerned with incorporating color and
texture: one considers that these are dif ferent characteristi cs and that each characteris-
tic cues independently [9,12,13]; the other approach considers color and texture as a
combined characteristic. These methods predominantly use the multi-channel versions
of grey scale texture descriptors [9,11] and some studies have demonstrated that incor-
porating color into texture impro ves classification results [3,13,14]. RGB space (repre-
senting red, green and blue, respectively) is the most common format used for digital
image display. Color texture features can be extracted from this space separately or
from cross-correlation between two colors. It has been demonstrated that incorporat-
ing texture features from the RGB space could enhance the accuracy of classification
[3,13]. HSI (representing hue, saturation and intensity, respectively), another color
space, can be produced by applying special filters and can be inspiring for the human
eye [3,14]. Attempt s have been made to study image features of histological images in
this space [3]. However, the effect of this space on TA of microscopic images of biolo-
gical tissues remains unknown.
In this paper, the objective was to apply TA to histological images of normal and
fibrotic liver from experimental animals and to investigate the effect of selecting the
color space on the accuracy of texture classification w hen image resolution changed.
The three color spaces used in this work were the grey scale, RGB and HSI.
Methods
Experimental procedures
The experimental procedures described herein were carried out during previous work
published by our group [7]. In this experiment, 12 male Wister rats were randomly
placed into two groups: Control (C, n = 5) and Fibrosis (F, n = 7). They were fed a
standard pellet diet and tap water ad libitum, placed in polycarbonate cages with wood
chip bedding under a 12 h light/dark cycle, and kept at a temperature of 22-24°C. The
C group received an intra-gastric injection of corn oil (1 ml/kg) twice a week. Liver
fibrosis was induced in the F group by intra-gastric injection of CCl
4
(1 ml/kg bo dy
weight, 1:1 in corn oil). This treatment was carried out for eight weeks [7]. Immedi-
ately at the end of experiment s, animals were sacrificed and the liver excised. Samples
were collected, frozen in liquid nitrogen and stored at -80°C [7]. This experi ment was
conducted following the guideli nes of the Animal Research Ethics Committee of Uni-
ted Arab Emirates University [7].
The presenc e of fibrosis was confirmed using histochemistry and histop athology [7].
Liver damage in the F group was assessed blindly on paraffin waxed sections stained
for cellular and extracellular components using Masson’s trichrome as described in
Amin et al. [7]. In the current work, microscopic images of l iver were taken and digi-
tized using a Leica DMRB/E light microscope (Heerbrugg, Switzerland) and an Olym-
pus camera, DP72. One microscopic image, clearly stained with no visible artifacts, was
taken from each animal. Images from sections containing large blood vessels were
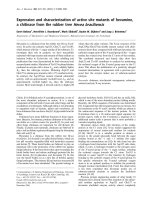
avoided. Images were stored in Bitmap format (BMP) of 680 columns × 512 rows, 24
Mahmoud-Ghoneim Theoretical Biology and Medical Modelling 2011, 8:25
/>Page 3 of 12
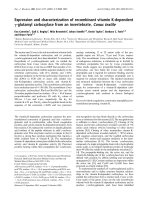
bit, true color and RGB pictures (Figure 1a, b). The liver sections of the C group had a
normal histological appearance (Figure 1b). The fibrotic changes in sections from
groupFwerevisiblebyeyeandwereseenas strands of collagen deposition in the
extracellular matrix (Figure 1b). More details concerning collagen quantification and
other fibrosis related parameters for this experiment can be found in a prev iously pub-
lished work [7].
Three categories of image resolution werestudiedfortheCandFgroups:(i)the
images kept at original res olution indicated as “Full-resolution” images; (ii) resolution
reduced to half of the origin al va lue so that the dimensions of the new image became
340 columns × 256 rows and indicated as “Half-resolution” images; (iii) resolution
reduced to quarter of its original values so that the dimensions of the image became
170 columns × 128 rows and indicated as “Quarter-resolut ion” images. Each image
was sub-divided into four equally sized non-overlapping regions of interest (ROIs),
avoiding boundaries and small vessels, and outlining the hepatic structure w ith cells
a
b
Figure 1 Liver microscopic images. Examples of liver microscopic images taken from (A) normal and (B)
fibrotic tissues.
Mahmoud-Ghoneim Theoretical Biology and Medical Modelling 2011, 8:25
/>Page 4 of 12
and the extracellular matrix. The total number of ROIs (sub-divisions) was 28 for the F
group and 20 for the C group for each resolution category.
The illumination conditions or brightness settings under the light microscope can
change from one slide to another for various reasons. This cause s the grey scale histo-
gram to shift to a different range; consequently, the comparison betwe en textures from
different images becomes inconsistent. In order to bring all images to the same range
of grey scale a normaliza tion (standardization) process should be carried out, with the
aim of setting a standard mean value to all images and recalculating the grey scale in
each image relative to this value; therefore, all textures bec ome comparable. Accord-
ingly, all ROIs were normalized to μ ±3s (where μ is the mean value and s is the
standard deviation of grey scale values in the image ROI) [4], the range obtained was
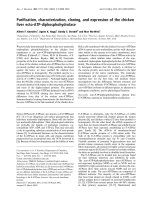
the n quantized to 7 bits (between grey values 1 and 128). An example is given in Fig-
ure 2, which presents two identical images of various brightness and the corresponding
histograms. The histograms have similar profiles; however, the mean values are differ-
ent as the histograms occupy different ranges. Normalization, as described above,
solves this problem and removes dependency on pixel intensity mean value [4].
Color spaces
As RGB images are composed of three channels (red, blue and green), each channel
can be viewed individually as a grey scale layer with an intensity range between 0 and
255 in a standard 24 bit bitmap format (BMP). All RGB ROIs were converted into a
a
b
Figure 2 Normalization example. In image (a) the histogram occupies a certain range, giving a mean
grey value of 123.8. The image (b) is the darker version of (a), giving a mean value of 90.9. The image (b)
can be rescaled to (a) using the normalization process.
Mahmoud-Ghoneim Theoretical Biology and Medical Modelling 2011, 8:25
/>Page 5 of 12
single layer grey scale image by calculating the equivalent luminance value at each
pixel using the formula:
Pixel grey scale value = |0.299|×|red| + |0.587|×|green| + |0.114|×|blue
(1)
This projects the RGB space into grey scale, representing luminance only. The above
technique is the most commonly used, b ut there are oth er techniques discussed in the
literature [11].
Original RGB ROIs were converted to HSI space. The HSI space separates chromati-
city and intensity information, thereby providing chromaticity measures independent of
intensity [11]. This detaches the intensity component from the color information and
reduces the effects of variable lighting. HSI space is closer to the human visual percep-
tion and understanding of color. H represents the visual spectrum of perceived colours,
I represents the brightness of a colour and S refers to the amount of white light mixed
with a hue. HSI ca n be represented by a cone shape, where H is located on the peri-
meter, S radiates from the centre outwards and I is located on the axis of the cone.
For I and S, the minimum and maximum values are 0 and 1, respectively. Mathemati-
cal details concerning RGB to HSI conversion are detailed elsewhere [15].
Texture analysis
Three TA methods were applied to ROIs for the three color spaces (grey scale, RGB,
and HSI) and for the three resolution categ ories (Full-Resolution, Half-resolution, and
Quarter -Resolution). These methods were co-occurrence matrix (COM), run- length
matrix (RLM) and wavelet transform (WT).
Co-occurrence Matrix
Co-o ccurrence matrix (COM ) is the most widely used TA method in biomedical ima-
ging [1,6]. It is a statistical method that depends on calculating the probability of find-
ing a joint occurrence of a pixel of grey scale value i with another of value j within a
predefined conditions of distance (d, d = 1, 2, 3, etc pixels) and orientation (θ, θ = 0°,
45°, 90°, 135°) [16]. Numerous parameters can be calculated from this matrix including
ang ular second moment, contrast, corr elation, entropy, sum of squares, inverse differ-
ence moment, sum average, sum variance, sum entropy, difference variance and differ-
ence entropy [16]. These quantitative descriptors are capable of elaborating texture
characteristic features for a group of images and discriminating between two groups
based on these features, directly or via mathematical recombination of features. Infor-
mation concerning the performance and limitations of COM can be found in the lit-
erature [6,16]. In this work, t he distance and direction were defined so that the
position of i in an image matrix (Im) is Im(x, y) and that of j is Im(x, y+1) where x is
the row value and y is the column value. These positions of i and j are known to pro-
duce COM within a distance d = 1 and angle θ = 0°.
Run-length matrix
Run-length matrix (RLM) is a statistical TA met hod defined as the matrix P
θ
(i, l)
which calculates the number of runs that exist in an image for a pixel of grey scale
value i and length l in a direction θ. The angle θ can be 0° (horizontal), 90° (vertical),
45° or 135°. The statistical parameters derived from this matrix are short run emphasis,
Mahmoud-Ghoneim Theoretical Biology and Medical Modelling 2011, 8:25
/>Page 6 of 12
long run emphasis, run length non-uniformity, grey lev el non-uniformi ty and ru n frac-
tion [6,16]. RLM provides information concerning the coarseness o f a texture. If the
image has predominantly long runs then t he texture is coarse, while short runs indi-
cate fine texture.
Wavelet transform
Wavelet transform (WT) is a linear transformation that operates on a data vector
whose length is an in teger power of two, transforming it into a nume rically different
vector of the same length. WT is a tool that separates data into various frequency
components using high-pass and low-pass filters, and then investigates each compo-
nent with resolution matched to its scale. Therefore, a given function can be analyzed
at various frequency levels [6]. In image ana lysis, the original image is sub-divided into
smaller sub-images at different scales on which low and high pass filters are applied.
The energy E
n
is a parameter calculated on the sub-images at scale n, and can be char-
acteristic for a group of images. The main advantage of WT is the multiscale represen-
tation of the function.
Feature selection using Fisher coefficient
Texture parameters calculated as des cribed above from COM, RLM and WT on the
grey scale ROIs were indicated by “greylevel"- scheme. Those which were calculated on
the RGB space were called “RGB"-scheme. In the RGB-scheme, parameters calculated
from one TA method, whether it was on the R, G or B channel, were pooled together
as one set of texture descriptors. For example, all COM parameters that were calcu-
lated on R, G or B channels were re-grou ped together as RGB-scheme on full-resolu-
tion images. Similarly, the “HSI"-scheme represents the pool that contains all the
parameters that came from H, S, and I layers for each TA method at a given
resolution.
Following texture parameters calculation, and prior to each classification test, the
three most discriminating parameters (indicated as features) were selected using the
Fisher (F) coefficient and used as a basis for subsequent class separation. A higher F-
coefficient indicates that the classes are more likely to be separabl e using thi s para-
meter [17]. The aim of this step is to reduce the large number of calculated texture
parameters to those which can be taken as features and expecte d to cha racteri ze the
tissue in the classification process. As a general precaution, the number of parameters
chosen for classification should not exceed the number of sample s in each group to
avoid over-performance of the classifier.
Raw data classification
Classification was performed in a space composed of three coordinates where each axis
corresponds to a feature. ROIs with similar textu re features tend to cluster closer as a
cloud of points within the same neighborhood. Classification using data as described
above is an unsupervised approach, as each point clusters independently of the others
and without pre-knowledge of the sample group or mathematical recombination. In
this work, channel separation, texture analysis, feature selection, data classification and
other image manipulation pro cesses were performed using MaZda-B11 software (ver-
sion 4.5,
©
1999-2006) [16,17] and Matlab 7 (
©
1984-2004, The MathWork, Inc.).
Mahmoud-Ghoneim Theoretical Biology and Medical Modelling 2011, 8:25
/>Page 7 of 12
Results and discussion
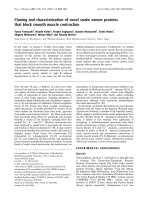
The features selected by F-coeffi cient and used for cla ssification are presented for the
three resolution categories: Full-Resolution (Table 1), Half-Resolution (Table 2) and
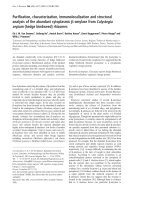
Quarter-resolution (Table 3). The classification results of C against F histological
images based on t exture features are presented as percentage error bars (histograms)
for the resolution categories (Figure 3a, b, and 3c, respectively), and for each scheme
using the three TA methods (COM, RLM and WT). The percentage error was calcu-
lated as the percentage ratio of misclassified samples to the total number of samples in
one group.
In Figure 3a, which represents results f or full-resolution images, no classification
errors were evident using the greylevel- or RGB-schemes. However, the HSI-scheme
had higher percentage errors with RLM and WT. The greylevel- and RGB-scheme s
were adequate to provide reliable texture features that maximized classification accu-
racy at this resolution. The remarkable increase in the percentage error for the RLM
method with the HSI-scheme (8%) highlights the low performance of TA for this
scheme and this method. At this resolution, the size of a pixel in the horizontal direc-
tion is approximately 0.255 μm of the actual histological sample size.
At half-resolution (Figure 3b), loss in classification accuracy was observed for greyle-
vel- and HSI- schemes. The greylevel-scheme had a minor percentage error ( approxi-
mately 2%) fo r COM and RLM. The HSI-scheme demonstrated a remarkable
percentage error for RLM at this resolution (10%) but lower percentage errors for
COM and WT. The RGB-scheme demonstrated zero percentage error for the three
TA methods.
The quarter-resolution images (Figure 3c) represent higher percentage errors for the
three schemes. The three schemes at this resolution had identical percentage errors for
COM (2%). The greylevel- and HSI-schemes demonstrated a further increase i n per-
centage error for RLM. However, the RGB-scheme had the lowest error among the
schemes. The RGB-scheme demonstrated zero errors for RLM and WT. Comparing
the three resolutions demonstrated that deg radation of classification accuracy takes
place as resolution decreases. Some color spaces were more susceptible to errors than
Table 1 Texture features at full resolution
TA
Method
Greylevel RGB HSI
COM Sum of Squares G_ Sum of Squares H_ Sum Variance
Sum Variance R_ Sum of Squares H_Correlation
Sum Entropy G_ Sum Variance H_Inverse Difference Moment
RLM Horizontal greylevel non-
uniformity
G_ Horizontal greylevel non-
uniformity
I_ Horizontal Run length non-
uniformity
Vertical greylevel non-
uniformity
G_45° greylevel non-uniformity I _Horizontal Fraction
135°greylevel non-uniformity G_135° greylevel non-uniformity I _135° Run length non-
uniformity
WT E
4
G_E
4
I_E
4
E
5
G_E
5
S_E
4
E
2
B_E
4
I_E
4
The texture features (parameters with the highest F-Coefficient) that discriminate between the C and F groups on
greylevel-, RGB-, and HSI- schemes at full-resolution images, using TA methods:COM, RLM, and WT.
R_: Red, G_: Green, and B_: Blue channels. H_: Hue, S_: Saturation, and I _: Intensity. E
s
Energy calculated from the
wavelets using various scales (s).
Mahmoud-Ghoneim Theoretical Biology and Medical Modelling 2011, 8:25
/>Page 8 of 12
others. The RGB-scheme was the most resistant to incid ences of misclassification and
produced more consistent results despite lowering resolution.
Obtaining acceptable results with RGB at low resolution refutes the idea that TA
requires high resolution for good performance. The ability of achieving good classifica-
tion results on low resolution images facilitates and reduces the time required for the
process of TA, saves hardware space and therefore can be less expensive. In this
respect, RGB space and the corresponding TA on the RGB-scheme provides the best
accuracy-to-resolution compromise.
Although the texture parameters from the three RGB channels were pooled together,
it was demonstrated that the majority of the discriminating parameters belong to the
G (green) channel (Tables 1, 2, and 3). Discriminating parameters belonging to the R
(red) or B (blue) channels rarely appeared as features (Table 1). This observation was
consistent for the three TA methods and can be explained in terms of relevance to the
staining protocol. The chemical interactions that occur between the staining substance
Table 2 Texture features at half resolution
TA
Method
Greylevel RGB HSI
COM Sum of Squares G_ Sum of Squares I _ Inverse Difference Moment
Sum Entropy R_ Sum of Squares S_ Sum of Squares
Sum Variance G_ Sum Entropy I _ Correlation
RLM Vertical greylevel non-
uniformity
G_45° greylevel non-uniformity I _Vertical Long Run Emphasis
Horizontal greylevel non-
uniformity
G_ Horizontal greylevel non-
uniformity
I _ Vertical Fraction
45° greylevel non-uniformity G_135°greylevel non-uniformity I _ Vertical Run length non-
uniformity
WT E
3
G_E
3
I_E
3
E
1
G_E
3
I_E
3
E
3
G_E
4
I_E
2
The texture features (parameters with the highest F-Coefficient) that discriminate between the C and F groups on
greylevel-, RGB-, and HSI- schemes at half resolution images, using TA met hods:COM, RLM, and WT.
R_: Red, G_: Green, and B_: Blue channels. H_: Hue, S_: Saturation, and I _: Intensity. E
s
Energy calculated from the
wavelets using various scales (s).
Table 3 Texture features at quarter resolution
TA
Method
Greylevel RGB HSI
COM Sum Entropy G-Sum Entropy I _ Contrast
Sum Variance G-Sum of Squares I _ Correlation
Sum of Squares G-Sum Variance I _ Inverse Difference Moment
RLM Horizontal greylevel non-
uniformity
G_45° greylevel non-uniformity I _ Inverse Difference Moment
Vertical greylevel non-
uniformity
G_ Horizontal greylevel non-
uniformity
I _ Vertical Run length non-
uniformity
45° greylevel non-uniformity G_ Vertical greylevel non-
uniformity
I _ Vertical Long Run Emphasis
WT E
3
G_E
2
I_E
2
E
2
G_E
1
S_E
2
E
1
G_E
3
I_E
1
The texture features (parameters with the highest F-Coefficient) that discriminate between the C and F groups on
greylevel-, RGB-, and HSI- schemes at quarte r resolution images, using TA methods:COM, RLM, and WT.
R_: Red, G_: Green, and B_: Blue channels. H_: Hue, S_: Saturation, and I _: Intensity. E
s
Energy calculated from the
wavelets using various scales (s).
Mahmoud-Ghoneim Theoretical Biology and Medical Modelling 2011, 8:25
/>Page 9 of 12
a
b
c
Figure 3 Classification results. Percentage error of texture classification in the C and F liver groups using
the greylevel-, RGB- and HSI- schemes on: (a) full-resolution, (b) half resolution, and (c) quarter resolution
images, using TA methods (COM, RLM, and WT).
Mahmoud-Ghoneim Theoretical Biology and Medical Modelling 2011, 8:25
/>Page 10 of 12
and the cell or tissue component produce distinctively colored regions including
pathologically dominant alterations (the extracellular collagen depositions in fibrosis).
TA demonstrated an ability to characterize fibrosis on grey scale images and on speci-
fic color channels. The green channel was the most characteristic, revealing the major-
ity of textural features (Tables 1, 2, and 3). Since this channel corresponds to the color
of the extracellular collagen deposition, it can be concluded that collagen i s the main
characteristic for liver fibrosis that produces the most dominant texture, and this con-
verges with histopathological findings in the literature [1]. It can be pro posed that
RBG space (and particularly the G channel) is more accurate than HSI results because
the former is a true representation of light reflection from the tissue, while the latter is
created by applying different filters, and yet it is a space approximated mathematically.
Therefore, TA appears to be more efficient at characterizing pathological text ural fea-
tures from original spaces as demonstrated for RGB.
This research has demonstrated that the accuracy of TA results varies according to
the color space used for the analysis and the resolution used. The RGB-scheme, corre-
sponding to RGB space, produced better results than the greylevel- or HSI-schemes,
particularly at low resolution. These findings are consistent with previous work con-
cerning meningioma, where TA on RGB outperformed other color spaces owing to
better discrimination on individual color channels [3]. Although the human eye can be
more inspired by HSI space, this does not nece ssarily mean that this space would per-
form better for TA [3]. This study has demonstrated that HSI space was the poorest
performer for TA. The superior results for the RGB space were predominantly because
each color channel provided textural information that corresponded to a particular col-
oring effect of the staining dye specific for the most dominant pathological component.
Therefore, RGB can characterize this component with higher accuracy within its color
channel. When an RGB colored image is con verted to grey sc ale by approximation
methods, this results in individual channel information being undermined and errors
occur. The results of this study emphasize two factors that should be considered when
automated texture analysis and classification of liver microscopic images is targeted:
firstly, texture and color are joint attribute s and should be considered for classification
in order to obtain increased accuracy of results, particularly w hen low resolution
images are used; secondly, TA of individual color channels in an RGB space can high-
light the pathological factor most useful for TA and therefore can be considered as
important for further research concerning automated fibrosis assessment. TA is not
the only automated method for pathology detection and characterization. Other meth-
ods, such as the theory of sampling [18] and newly developed tissue-based diagnosis
methods [19], will increase the ability to obtain integrated information concerning bio-
logical tissues. Collectively, these automated methods can be used to produce a com-
prehensive base of knowledge for a disease, and this would facilitate the diagnosis at
all stages of that disease.
Conclusions
Color space affects the accuracy of classifica tion of liver histological images at various
levels of resolution. The grey scale is the conventionally used space for TA, but in this
study RGB has demonstrated better results at low resolution, the ability to elaborate
the pathological component most characteristic o f fibrosis on histological images and
Mahmoud-Ghoneim Theoretical Biology and Medical Modelling 2011, 8:25
/>Page 11 of 12
emphasis on its corresponding channel. The results of this work could enhance the TA
approach and highlights the factors that should be considered i n future liver assess-
ment challenging tasks using automated methods.
Acknowledgements
The author would like to thank Prof. Amr Amin from the Biology Department at United Arab Emirates University for
providing the liver microscopic images used in this work. This work was supported by United Arab Emirates University
grant number 01-02-2-12/08 to Dr. Doaa Mahmoud-Ghoneim.
Author details
1
Physics Department, Faculty of Science, United Arab Emirates University, Al-Ain, UAE.
2
Biophysics Department, Faculty
of Science, Cairo University, Giza, Egypt.
Authors’ contributions
DMG is the single author of this manuscript. The author carried out work procedures that included: acquiring data,
applying methods, analyzing results, interpreting image analysis findings in relevance to biology, and writing the
manuscript.
Declaration of Competing interests
The author declares that they have no competing interests.
Received: 3 March 2011 Accepted: 14 July 2011 Published: 14 July 2011
References
1. Amin A, Mahmoud-Ghoneim D: Zizyphus spina-christi protects against carbon tetrachloride-induced liver fibrosis in
rats. Food and Chemical Toxicology 2009, 47:2111-2119.
2. Kayser K, Hoshang SA, Metze K, Goldmann T, Vollmer E, Radziszowski D, Kosjerina Z, Mireskandari M, Kayser G: Texture-
and object-related automated information analysis in histological still images of various organs. Anal Quant Cytol
Histol 2008, 30(6):323-335.
3. Al-Kadi OS: Texture measures combination for improved meningioma classification of histopathological images.
Pattern Recognition 2010, 43(6):2043-2053.
4. Collewet G, Strzelecki M, Mariette F: Influence of MRI acquisition protocols and image intensity normalization
methods on texture classification. Magnetic Resonance Imaging 2004, 22:81-91.
5. Mahmoud-Ghoneim D, Cherel Y, Lemaire L, de Certaines JD, Maniere A: Texture Analysis of Magnetic Resonance
Images of Rats’ Muscles During Atrophy and Regeneration. Magnetic Resonance Imaging 2006, 24:167-171.
6. Castellano G, Bonilha L, Li LM, Cendes F: Texture analysis of medical images. Clinical Radiology 2004, 59:1061-1069.
7. Amin A, Mahmoud-Ghoneim D: Texture analysis of liver fibrosis microscopic images: A study on the effect of
biomarkers. Acta Biophysica et Biochemica Sinica 2011, 43(3):193-203.
8. Hübscher SG: Histological assessment of the liver. Medicine 2007, 35(1):17-21.
9. Qazi I, Alata O, Burie JC: Choice of pertinent color space for color texture characterization using parametric spectral
analysis. Pattern Recognition 2011, 44:16-31.
10. Setchell C, Campbell N: Using Color Gabor texture features for scene understanding. Proceedings of the 7th
International Conference on Image Processing and Applications 1999, 67(5):372-376.
11. Mäenpää T, Pietikäinen M: Classification with color and texture: jointly or separately? Pattern Recognition 2004,
37(8):1629-1640.
12. Permuter H, Francos J, Jermyn I: A study of Gaussian mixture models of color and texture features for image
classification and segmentation. Pattern Recognition 2006, 39(4):695-706.
13. Drimbarean A, Whelan PF: Experiments in colour texture analysis. Pattern Recogtion Letters 2001, 22(10):1161-1167.
14. Palm C: Color texture classification by integrative Co-occurrence matrices. Pattern Recognition 2004, 37:965-976.
15. Yu CH, Chen SY: Universal colour quantization for different colour spaces. IEEE Proceedings–Vision Image and Signal
Processing
2006, 153(4):445-455.
16. Hajek M, Dezortova M, Materka A, Lerski R, editors: Texture Analysis for Magnetic Resonance Imaging Prague, Czech
Republic: Med4publishing s.r.o.; 2006.
17. Szczypiński PM, Strzelecki M, Materka A, Klepaczko A: MaZda–A software package for image texture analysis.
Computer Methods and Programs in Biomedicine 2009, 94(1):66-76.
18. Kayser K, Schultz H, Goldmann T, Görtler J, Kayser G, Vollmer E: Theory of sampling and its application in tissue
based diagnosis. Diagnostic Pathology 2009, 4:6.
19. Kayser K, Görtler J, Vollmer E, Hufnagl P, Kayser G: Image standards in Tissue-Based Diagnosis (Diagnostic Surgical
Pathology). Diagnostic Pathology 2008, 3:17.
doi:10.1186/1742-4682-8-25
Cite this article as: Mahmoud-Ghoneim: Optimizing automated characterization of liver fibrosis histological
images by investigating color spaces at different resolutions. Theoretical Biology and Medical Modelling 2011 8:25.
Mahmoud-Ghoneim Theoretical Biology and Medical Modelling 2011, 8:25
/>Page 12 of 12