Báo cáo y học: " Comparison of three methods of extravascular lung water volume measurement in patients after cardiac surgery" ppt
Bạn đang xem bản rút gọn của tài liệu. Xem và tải ngay bản đầy đủ của tài liệu tại đây (156.22 KB, 6 trang )
Open Access
Available online />Page 1 of 6
(page number not for citation purposes)
Vol 13 No 4
Research
Comparison of three methods of extravascular lung water volume
measurement in patients after cardiac surgery
Benjamin Maddison
1
, Christopher Wolff
1
, George Findlay
2
, Peter Radermacher
3
, Charles Hinds
1
and Rupert M Pearse
1
1
Barts and The London School of Medicine and Dentistry, Queen Mary's University of London, Royal London Hospital, London E1 1BB, UK
2
Intensive Care Unit, University Hospital Wales, Heath Park, Cardiff CF14 4XW, UK
3
Sektion Anästhesiologische Pathophysiologie und Verfahrensentwicklung, Universitätsklinikum, Ulm, Robert-Koch-Str. 8, 89081, Germany
Corresponding author: Rupert M Pearse,
Received: 25 Jun 2009 Accepted: 6 Jul 2009 Published: 6 Jul 2009
Critical Care 2009, 13:R107 (doi:10.1186/cc7948)
This article is online at: />© 2009 Maddison et al.; licensee BioMed Central Ltd.
This is an Open Access article distributed under the terms of the Creative Commons Attribution License ( />2.0), which permits unrestricted use, distribution, and reproduction in any medium, provided the original work is properly cited.
Abstract
Introduction Measurement of extravascular lung water (EVLW)
by using the lithium-thermal (Li-thermal) and single-thermal
indicator dilution methods was compared with the indocyanine
green-thermal (ICG-thermal) method in humans.
Methods Single-center observational study involving patients
undergoing cardiac surgery with cardiopulmonary bypass.
Paired measurements were taken 1, 2, 4, and 6 hours after
surgery. Bland-Altman analysis was used to calculate bias and
limits of agreement. Data are presented as mean (SD) or median
(IQR).
Results Seventeen patients were recruited (age, 69 years (54
to 87 years); Parsonnet score 10 (0 to 29)). Sixteen ICG-
thermal measurements were excluded after blinded assessment
because of poor-quality indicator dilution curves. EVLW volume
as measured by the ICG-thermal technique was 4.6 (1.9) ml/kg,
compared with 5.3 (1.4) ml/kg for the single-thermal method.
Measurements taken with the Li-thermal method were clearly
erroneous (-7.6 (7.4) ml/kg). In comparison with simultaneous
measurements with the ICG-thermal method, single-thermal
measurements had an acceptable degree of bias, but limits of
agreement were poor (bias, -0.3 ml/kg (2.3)). Li-thermal
measurements compared poorly with the ICG-thermal reference
method (bias, 13.2 ml/kg (14.4)).
Conclusions The principal finding of this study was that the
prototype Li-thermal method did not provide reliable
measurements of EVLW volume when compared with the ICG-
thermal reference technique. Although minimal bias was
associated with the single-thermal method, limits of agreement
were approximately 45% of the normal value of EVLW volume.
The Li-thermal method performed very poorly because of the
overestimation of mean indicator transit time by using an external
lithium ion electrode. These findings suggest that the
assessment of lung water content by lithium-indicator dilution is
not sufficiently reliable for clinical use in individual patients.
Introduction
Increased extravascular lung water (EVLW) volume during crit-
ical illness is associated with prolonged mechanical ventilation
and increased mortality rates [1-4]. Quantification of EVLW
volume may allow the use of therapeutic interventions to regu-
late lung water content, perhaps resulting in improved clinical
outcomes [2,3]. Neither assessment of oxygenation nor chest
radiography provides a reliable indication of EVLW volume [5-
7]. No ideal method exists for measuring EVLW volume at the
bedside.
In a previous laboratory study, we explored the use of indica-
tor-dilution techniques to measure intrathoracic blood volume
(ITBV) and EVLW volume [8]. The objective of this research
was to develop a more convenient method of EVLW volume
measurement by using lithium-thermal indicator dilution. Lith-
ium chloride satisfies many of the criteria for an ideal indicator,
CO: cardiac output; EVLW: extravascular lung water; GEDV: global end-diastolic volume; IQR: interquartile range; ICG: indocyanine green; ITBV:
intrathoracic blood volume; Li: lithium; MTT: mean transit time.
Critical Care Vol 13 No 4 Maddison et al.
Page 2 of 6
(page number not for citation purposes)
including a good safety profile, small displacement volume,
and minimal indicator loss [9-12]. However, in a recent labora-
tory investigation in porcine models of acute lung injury, both
the existing indicator-dilution methods of EVLW volume meas-
urement and our prototype Li-thermal method compared
poorly with postmortem gravimetric measurements [8]. Given
that each of these technologies was developed for use in
humans, it is possible that measurements of EVLW volume
would prove more reliable in humans. It is, therefore, necessary
to compare indocyanine green-thermal indicator dilution, sin-
gle-thermal indicator dilution, and the prototype lithium-ther-
mal methods in humans. The aim of this study was to compare
measurements of ITBV and EVLW volume made by using the
indocyanine green-thermal (ICG-thermal), lithium-thermal (Li-
thermal), and single-thermal indicator dilution techniques in
patients after elective cardiac surgery with cardiopulmonary
bypass.
Materials and methods
This single-center, observational study was prospectively
approved by the Local Research Ethics Committee. Patients
undergoing elective cardiac surgery with cardiopulmonary
bypass were eligible for recruitment. Perioperative changes in
ITBV and EVLW volume in this population are significant and
well described [13,14]. Written informed consent was sought
before surgery. Exclusion criteria were refusal of consent,
acute arrhythmias, significant cardiac valvular regurgitation,
intra-aortic balloon counterpulsation, severe peripheral vascu-
lar disease, concurrent lithium therapy, pregnancy, and weight
less than 40 kg. Anesthetic, cardiopulmonary bypass, blood
transfusion, mechanical ventilation, and sedation practices
were managed by clinical staff according to standardized local
protocols. Paired measurements of ITBV and EVLW volume
made by using each technique were taken 1, 2, 4, and 6 hours
after surgery, as described in detail later. Initial plans for meas-
urements at 24 hours were changed for pragmatic reasons, as
detailed in the results. Indicator-dilution curves attained with
each technique were analyzed in random order by CW, who
was blinded to all other data. Curves were rejected if it was not
possible to measure the relevant parameters manually.
ICG-thermal measurement of ITBV and EVLW volume
The transpulmonary indicator-dilution technique allows the
calculation of ITBV and EVLW volume according to Stewart's
principle [15]. This describes the relation between cardiac
output (CO), the volume throughout which an indicator distrib-
utes during transit (V), and the mean time taken for the indica-
tor to pass from the point of injection to the point of detection
(mean transit time, MTT) as follows:
As ICG remains confined to the vascular compartment, the
distribution volume is equivalent to ITBV. The thermal indicator
distributes throughout the thoracic water compartment, allow-
ing measurement of intrathoracic water volume. EVLW volume
may then be calculated by subtraction. ICG-thermal measure-
ments were made by using the COLD-Z system (Pulsion Med-
ical Systems, Munich, Germany) after central injection of iced
5% dextrose solution containing 0.2 mg/kg of ICG according
to the manufacturer's instructions [16]. Arterial changes in
temperature and ICG concentration were measured by using
a thermistor-tipped spectrophotometric catheter inserted via
an 18G femoral arterial catheter positioned with the tip at the
level of the diaphragm (PV 2024 4FG; Pulsion Medical Sys-
tems).
Li-thermal measurement of ITBV and EVLW volume
The principles underlying the Li-thermal method are the same
as those of the ICG-thermal method. Li-thermal measurements
were made by using the LiDCOplus system (LiDCO Ltd.,
Cambridge, UK) after central injection of 0.3 mmol (2 ml) of
lithium chloride [17]. The arterial lithium ion concentration was
measured by using an external lithium ion sensor attached to
the radial arterial catheter via a 0.75-ml extension tube. Flow of
arterial blood across the lithium sensor was regulated by using
VCOMTT=×
Table 1
Baseline patient characteristics
Number 17
Age 69 (9) years
Gender 15 male
Weight 82 (19) kg
Parsonnet score 10 (8)
Duration of cardiopulmonary bypass 74 (17) minutes
Coronary artery bypass graft 13
Aortic valve replacement 2
Coronary artery bypass graft and aortic valve replacement as combined procedure 2
Data presented as mean (SD).
Available online />Page 3 of 6
(page number not for citation purposes)
a battery-powered peristaltic pump. Time of injection was
standardized through the use of a visual countdown on the
monitor. The measured value of MTT includes lithium transit
from the margin of the thorax to the external electrode. To allow
calculation of the true physiologic value of MTT, we assumed
a constant additional delay of 13.3 seconds. This value incor-
porates the known constant of 11.3 seconds for the indicator
to transit the arterial catheter to the electrode (manufacturer's
data), with published data from healthy volunteers suggesting
that indicator transit from the margin of the thorax to the wrist
would result in a delay of no more than 2.0 seconds [18]. Lith-
ium cardiac output and lithium MTT were used to calculate
ITBV. The Li-thermal calculation of EVLW volume was then
made by using the measurement of intrathoracic thermal vol-
ume made by using the COLD-Z system at the same time
point. EVLW volume was calculated from the lithium indicator-
dilution measurement of cardiac output and MTT along with
the thermal indicator value of MTT measured by using the
COLD-Z system at the same time point.
Single-thermal measurement of ITBV and EVLW volume
Single thermal indicator dilution allows the calculation of ITBV
and EVLW volume solely from the thermal indicator dilution
curve. Measurement of ITBV relies on the assumption of a
fixed relation between ITBV and global end-diastolic volume
(GEDV), as follows:
GEDV is calculated from measurements of total intrathoracic
thermal volume and pulmonary thermal volumes, the latter
being derived from analysis of the decay of the thermal indica-
tor-dilution curve, applying Newman's hypothesis [15,19,20].
GEDV is obtained from the ICG indicator dilution curve to
allow calculation of ITBV. EVLW volume is once again calcu-
lated by subtraction.
Statistical analysis
A sample-size calculation was performed to ensure that the
study had adequate statistical power to identify changes in
ITBV during the postoperative period. Assuming a type I error
rate of 5% and a type II error rate of 10%, we estimated that
ITBV GEDV=×125.
Table 2
Cardiorespiratory changes during study period. Data presented as mean (SD) or median [IQR]
Time Hour 1 Hour 2 Hour 4 Hour 6
MAP (mm Hg) 71 (± 4) 71 (± 7) 79 (± 9) 75 (± 8)
CVP (mm Hg) 12 (± 4) 12 (± 3) 13 (± 4) 11 (± 3)
PaO
2
(kPa) 14.8
[13.1–18.5]
15.3
[13.6–19.9]
15.2
[11.5–17.8]
13.7
[11.5–14.8]
PaO
2
:FiO
2
(kPa) 34 (± 10) 37 (± 7) 36 (± 14) 34 (± 9)
Cumulative fluid balance (ml) 1,903
[1,740–2,631]
2,578
[1,969–2,908]
3,015
[2,294–3,379]
3,457
[2,621–4,506]
MAP = mean arterial pressure; CVP = central venous pressure.
Table 3
Measurements of intrathoracic blood volume (ITBV) and extravascular lung water (EVLW) volume at individual time points by using
three different methods of indicator dilution
Time Hour 1Hour 2Hour 4Hour 6
ICG-thermal ITBV
(ml/m
2
)
794 (± 165) 856 (± 156) 880 (± 140) 915 (± 146)
Li-thermal ITBV
(ml/m
2
)
1,271 (± 336) 1,318 (± 350) 1,309 (± 407) 1,203 (± 311)
Single-thermal ITBV
(ml/m
2
)
777 (± 180) 827 (± 129) 880 (± 175) 880 (± 170)
ICG-thermal EVLW
(ml/kg)
5.6 (± 2.1) 4.6 (± 1.9) 5.4 (± 2.0) 4.8 (± 1.4)
Li-thermal EVLW
(ml/kg)
-7.8 (± 5.6) -9.9 (± 5.6) -7.9 (± 10.5) -6.6 (± 7.0)
Single-thermal EVLW
(ml/kg)
5.5 (± 1.7) 4.9 (± 1.4) 5.6 (± 1.4) 5.3 (± 1.0)
Data presented as mean (SD). Li-thermal = lithium-thermal indicator dilution; ICG-thermal = indocyanine green-thermal indicator dilution.
Critical Care Vol 13 No 4 Maddison et al.
Page 4 of 6
(page number not for citation purposes)
20 patients would be required to detect a 1.5-ml/kg change in
ITBV (SD, 4 ml/kg). Data are presented as mean (SD) where
normally distributed and median (IQR) where not normally dis-
tributed. The comparison between paired measurements was
tested by using the technique of Bland and Altman. Signifi-
cance was set at P < 0.05.
Results
Seventeen patients were recruited between July and Septem-
ber 2007. It was not possible to recruit 20 patients because
of an insufficient number of spectrophotometric catheters. The
baseline characteristics of these patients are presented in
Table 1. Cardiorespiratory changes during the study period
are presented in Table 2. After the recruitment of four patients,
the final measurement time point was changed from 24 to 6
hours because of the clinical need to remove the femoral arte-
rial catheter for postoperative mobilization. Before Bland-Alt-
man analysis, 16 ICG measurements were excluded because
of the poor quality of the indicator-dilution curve, leaving a total
of 52 paired comparisons. All lithium dilution curves were of
adequate quality.
EVLW volume as measured by the ICG-thermal technique was
4.6 (1.9) ml/kg, compared with 5.3 (1.4) ml/kg for the single-
thermal method. Measurements taken with the Li-thermal
method were clearly erroneous (-7.6 [7.4] ml/kg) and com-
pared poorly with simultaneous measurements made by using
the ICG-thermal method (bias, 13.2 (14.4) ml/kg) (Figure 1).
For the single-thermal method, a more-acceptable bias was
found, but limits of agreement remained poor (bias, -0.3 (2.3)
ml/kg) (Figure 2). Agreement between the ICG-thermal and
single-thermal methods in terms of percentage change in
EVLW between time points also was poor (bias, 2.2% (72%)).
ITBV and EVLW volume measurements at individual time
Table 4
Measurements of mean indicator transit time (MTT), cardiac index, and temperature at individual time points
Time Hour 1 Hour 2 Hour 4 Hour 6
Li-thermal MTT
(seconds)
35.1 (± 8.1) 33.2 (± 4.6) 29.4 (± 7.2) 28.7 (± 5.5)
ICG-thermal MTT
(seconds)
19.0 (± 3.4) 18.5 (± 3.6) 17.8 (± 3.3) 18.1 (± 3.4)
Li-thermal cardiac index
(L/min/m
2
)
2.3 (± 0.5) 2.4 (± 0.6) 2.6 (± 0.7) 2.6 (± 0.7)
ICG-thermal cardiac index (L/min/m
2
) 2.5 (± 0.7) 2.8 (± 0.6) 3.0 (± 0.6) 3.1 (± 0.6)
Core temperature (°C) 36.3 (± 0.5) 36.5 (± 0.6) 36.9 (± 0.5) 37.2 (± 0.5)
Peripheral temperature (°C) 30.6 (± 2.0) 31.6 (± 2.0) 32.8 (± 1.7) 33.1 (± 1.6)
Data presented as mean (SD). Li-thermal = lithium-thermal indicator dilution; ICG-thermal = indocyanine green-thermal indicator dilution.
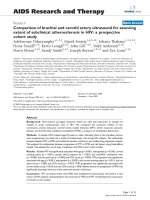
Figure 1
Bland-Altman analysis of paired measurements of extravascular lung water (EVLW) volume made by using the lithium-thermal indicator dilu-tion method as compared with the indocyanine green-thermal indicator dilution methodBland-Altman analysis of paired measurements of extravascular lung
water (EVLW) volume made by using the lithium-thermal indicator dilu-
tion method as compared with the indocyanine green-thermal indicator
dilution method. Bias, 13.2 ml/kg; 95% limits of agreement, ± 14.4 ml/
kg. Dotted lines indicate bias and limits of agreement.
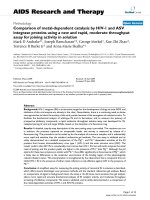
Figure 2
Bland-Altman analysis of paired measurements of extravascular lung water (EVLW) volume made by using the single-thermal indicator dilu-tion method as compared with the indocyanine green-thermal indicator dilution methodBland-Altman analysis of paired measurements of extravascular lung
water (EVLW) volume made by using the single-thermal indicator dilu-
tion method as compared with the indocyanine green-thermal indicator
dilution method. Bias, -0.3 ml/kg; 95% limits of agreement, ± 2.3 ml/kg.
Dotted lines indicate bias and limits of agreement.
Available online />Page 5 of 6
(page number not for citation purposes)
points are presented in Table 3. Errors in the Li-thermal data
resulted from a considerable overestimate of ITBV, due in turn
to an overestimate of MTT (Table 4). Cardiac index, the other
component variable of ITBV, was similar between the two
techniques. As patients were rewarmed after cardiopulmonary
bypass, the differences both in MTT and ITBV appeared to
improve.
Discussion
The principal finding of this study was that the prototype Li-
thermal method did not provide reliable measurements of
EVLW volume when compared with the ICG-thermal refer-
ence technique. Whereas minimal bias was associated with
the single-thermal method, limits of agreement were approxi-
mately 45% of the normal value of EVLW volume. The Li-ther-
mal method performed very poorly because of the
overestimation of mean indicator transit time by using an exter-
nal lithium ion electrode. These data suggest that the Li-ther-
mal method does not provide measurements of EVLW volume
that are sufficiently reliable to guide clinical interventions in
individual patients.
Previously we compared Li-thermal and ICG-thermal tech-
niques with the gravimetric measurement of EVLW volume in
a porcine model of acute lung injury. In this investigation, much
closer agreement was found between the Li-thermal and ICG-
thermal double-indicator methods [8]. However, in this previ-
ous investigation, the external lithium ion electrode was
attached to a centrally placed femoral or carotid arterial cath-
eter. These data suggest that, for accurate EVLW volume
measurement by lithium indicator dilution, blood must be sam-
pled via an arterial catheter sited within the aorta at the level of
the diaphragm. ITBV is calculated as the product of cardiac
output and MTT. Whereas measurements of cardiac output
were similar for the two techniques, considerable differences
were found in MTT. The assumption that the transit of lithium
ions through the arterial circulation of the upper limb would be
less than 2 seconds was incorrect. It is interesting to note that
the difference between the Li-thermal and ICG-thermal meas-
urements of MTT decreased as patients were rewarmed after
cardiopulmonary bypass. Thus this source of error was not
constant and cannot easily be adjusted for. Previous investiga-
tions have indicated that the loss of lithium ions from the vas-
cular compartment during the measurement period does not
affect the accuracy of cardiac-output measurement [10,11].
However, volumetric measurements may be more susceptible
to this source of error, which also would result in an overesti-
mation of MTT.
A study comparing EVLW volume measurement by using the
ICG-thermal and single-thermal methods demonstrated incon-
sistencies between the two techniques [21]. In some cases,
adjustment of the single-thermal algorithm is required to
account for the individual circumstances of the experiment
[22-24]. Similarly, in the current investigation, wide limits of
agreement occurred between the single-thermal and ICG-
thermal methods.
Conclusions
In this study, the prototype Li-thermal indicator-dilution tech-
nique did not provide accurate measurements of EVLW vol-
ume. Along with those of our recent laboratory investigation
[8], these findings suggest that accurate measurement of
EVLW volume by lithium indicator dilution requires blood to be
sampled from a central artery, via a catheter positioned with
the tip at the level of the diaphragm.
Competing interests
RP has received a research grant and equipment loans from
LiDCO Ltd and honoraria for speaking from Pulsion Medical
Systems.
Authors' contributions
RP formulated the hypothesis and developed the protocol with
CH. The investigation was performed by BM, at St. Bar-
tholomew's Hospital, London, UK. CW, GF, and PR assisted
in the data analysis. The manuscript was drafted by BM and
RP. All authors approved the final version.
Acknowledgements
This research was supported by an Intensive Care Society (UK) Young
Investigator Award and unrestricted research grants from Barts and The
London NHS Trust and LiDCO, Ltd., and we thank Mr Eric Mills of
LiDCO, Ltd. for his advice during this study.
References
1. Sakka SG, Klein M, Reinhart K, Meier-Hellmann A: Prognostic
value of extravascular lung water in critically ill patients. Chest
2002, 122:2080-2086.
2. Eisenberg PR, Hansbrough JR, Anderson D, Schuster DP: A pro-
spective study of lung water measurements during patient
management in an intensive care unit. Am Rev Respir Dis
1987, 136:662-668.
3. Mitchell JP, Schuller D, Calandrino FS, Schuster DP: Improved
outcome based on fluid management in critically ill patients
requiring pulmonary artery catheterization. Am Rev Respir Dis
1992, 145:990-998.
4. Kirov MY, Kuzkov VV, Kuklin VN, Waerhaug K, Bjertnaes LJ:
Extravascular lung water assessed by transpulmonary single
Key messages
• Increased extravascular lung water is an important clini-
cal problem. Therapies to decrease lung water content
may improve outcomes.
• The double-indicator dilution method of lung water
measurement is considered the gold standard but is no
longer commercially available.
• In this investigation, a prototype lithium-thermal method
of lung water measurement performed poorly.
• The single-thermal indicator method was much more
reliable than the prototype, but agreement with the dou-
ble-indicator method was still disappointing.
Critical Care Vol 13 No 4 Maddison et al.
Page 6 of 6
(page number not for citation purposes)
thermodilution and postmortem gravimetry in sheep. Crit
Care 2004, 8:R451-R458.
5. Halperin BD, Feeley TW, Mihm FG, Chiles C, Guthaner DF, Blank
NE: Evaluation of the portable chest roentgenogram for quan-
titating extravascular lung water in critically ill adults. Chest
1985, 88:649-652.
6. Baudendistel L, Shields JB, Kaminski DL: Comparison of double
indicator thermodilution measurements of extravascular lung
water (EVLW) with radiographic estimation of lung water in
trauma patients. J Trauma 1982, 22:983-988.
7. Rubenfeld GD, Caldwell E, Granton J, Hudson LD, Matthay MA:
Interobserver variability in applying a radiographic definition
for ARDS. Chest 1999, 116:1347-1353.
8. Maddison B, Giudici R, Calzia E, Wolff C, Hinds C, Radermacher
P, Pearse RM: Extravascular lung water volume measurement
by a novel lithium-thermal indicator dilution method: compar-
ison of three techniques to post-mortem gravimetry. Intensive
Care Med 2008, 34:2106-2111.
9. Jonas M, Linton R, O'Brien T, Band D, Linton N, Kelly F, Burden T,
Chevalier S, Thompson R, Birch N, Powell J: The pharmacokinet-
ics of intravenous lithium chloride in patients and normal vol-
unteers. J Trace Microprobe Techniques 2001, 19:313-320.
10. Band DM, Linton RA, O'Brien TK, Jonas MM, Linton NW: The
shape of indicator dilution curves used for cardiac output
measurement in man. J Physiol 1997, 498:225-229.
11. Kurita T, Morita K, Kawasaki H, Fujii K, Kazama T, Sato S: Lithium
dilution cardiac output measurement in oleic acid-induced
pulmonary edema. J Cardiothorac Vasc Anesth 2002,
16:334-337.
12. Renner LE, Morton MJ, Sakuma GY: Indicator amount, tempera-
ture, and intrinsic cardiac output affect thermodilution cardiac
output accuracy and reproducibility. Crit Care Med 1993,
21:586-597.
13. Boldt J, von Bormann B, Kling D, Scheld HH, Hempelmann G: The
influence of extracorporeal circulation on extravascular lung
water in coronary surgery patients. Thorac Cardiovasc Surg
1986, 34:110-115.
14. Hachenberg T, Tenling A, Rothen HU, Nystrom SO, Tyden H,
Hedenstierna G: Thoracic intravascular and extravascular fluid
volumes in cardiac surgical patients. Anesthesiology 1993,
79:
976-984.
15. Stewart GN: The pulmonary circulation time, the quantity of
blood in the lungs and the output of the heart. Am J Physiol
1921, 58:20-44.
16. Pfeiffer U, Birk M, Aschenbrenner A, Blumel G: The system for
quantitating thermal-dye extravascular lung water. In Comput-
ers in Critical Care and Pulmonary Medicine Edited by: Prakash
O. New York: Plenum; 1982:123-125.
17. Pearse RM, Ikram K, Barry J: Equipment review: an appraisal of
the LiDCO plus method of measuring cardiac output. Crit Care
2004, 8:190-195.
18. Naylor LH, Weisbrod CJ, O'Driscoll G, Green DJ: Measuring
peripheral resistance and conduit arterial structure in humans
using Doppler ultrasound. J Appl Physiol 2005, 98:2311-2315.
19. Newman EV, Merrell M, Genecin A, Monge C, Milnor WR, Mc KW:
The dye dilution method for describing the central circulation:
an analysis of factors shaping the time-concentration curves.
Circulation 1951, 4:735-746.
20. Jhanji S, Dawson J, Pearse RM: Cardiac output monitoring:
basic science and clinical application. Anaesthesia 2008,
63:172-181.
21. Schuster DP, Calandrino FS: Single versus double indicator
dilution measurements of extravascular lung water. Crit Care
Med 1991, 19:84-88.
22. Nirmalan M, Niranjan M, Willard T, Edwards JD, Little RA, Dark PM:
Estimation of errors in determining intrathoracic blood volume
using thermal dilution in pigs with acute lung injury and haem-
orrhage. Br J Anaesth 2004, 93:546-551.
23. Nirmalan M, Willard TM, Edwards DJ, Little RA, Dark PM: Estima-
tion of errors in determining intrathoracic blood volume using
the single transpulmonary thermal dilution technique in hypo-
volemic shock. Anesthesiology 2005, 103:805-812.
24. Rossi P, Wanecek M, Rudehill A, Konrad D, Weitzberg E, Oldner
A: Comparison of a single indicator and gravimetric technique
for estimation of extravascular lung water in endotoxemic
pigs. Crit Care Med 2006, 34:1437-1443.