Báo cáo y học: "Relating a calcium indicator signal to the unperturbed calcium concentration time-course" potx
Bạn đang xem bản rút gọn của tài liệu. Xem và tải ngay bản đầy đủ của tài liệu tại đây (755.23 KB, 13 trang )
BioMed Central
Page 1 of 13
(page number not for citation purposes)
Theoretical Biology and Medical
Modelling
Open Access
Research
Relating a calcium indicator signal to the unperturbed calcium
concentration time-course
Alexander Borst*
1
and Henry DI Abarbanel
2
Address:
1
Max-Planck-Institute of Neurobiology, Martinsried, Germany and
2
Department of Physics and Marine Physical Laboratory (Scripps
Institution of Oceanography), University of California, San Diego, USA
Email: Alexander Borst* - ; Henry DI Abarbanel -
* Corresponding author
Abstract
Background: Optical indicators of cytosolic calcium levels have become important experimental
tools in systems and cellular neuroscience. Indicators are known to interfere with intracellular
calcium levels by acting as additional buffers, and this may strongly alter the time-course of various
dynamical variables to be measured.
Results: By investigating the underlying reaction kinetics, we show that in some ranges of kinetic
parameters one can explicitly link the time dependent indicator signal to the time-course of the
calcium influx, and thus, to the unperturbed calcium level had there been no indicator in the cell.
Background
The use of a fluorescent calcium indicator is a familiar
technique for detecting dynamical changes in intracellular
calcium levels [1-8]. However, introduction of the indica-
tor into the cytosol inevitably perturbs the time-course of
free cytosolic calcium by acting as a buffer, thus altering
the quantity to be measured. To address this, traditional
approaches to quantifying free cytosolic calcium have
often restricted the use of the indicators to minimal con-
centrations with minimal affinity. While this minimizes
the perturbation of the free calcium signal, it leads to the
problem of small signal-to-noise ratios.
As an alternative approach, we examine here the dynami-
cal equations for this process in various parameter ranges
in order to identify the conditions under which approxi-
mate solutions can be obtained, allowing calcium influx
to be calculated directly from the fluorescence time course
measurements. Knowing the calcium influx, the free
cytosolic calcium can then be calculated as if there had
been no indicator in the cytosol.
In the following, we will denote the temporal derivative of
a variable dx(t)/dt by the symbol x'(t). Furthermore, we
will use the following symbols with the units shown in
Table 1.
Results
Upon activation of a neuron, calcium influx
α
(t) leads to
an increase of the cytosolic calcium concentration. Once
inside the cell, calcium goes one of two ways: either it is
cleared from the cell, in proportion to its concentration, at
a rate
γ
, or it binds to an indicator with forward and back-
ward binding rates k
f
and k
b
, respectively. Processes such
as diffusion, internal buffering, and release from internal
calcium stores or extrusion by calcium-sodium exchangers
are not considered here. We call the free calcium concen-
tration x(t) with an intracellular calcium indicator, and
Published: 6 February 2007
Theoretical Biology and Medical Modelling 2007, 4:7 doi:10.1186/1742-4682-4-7
Received: 24 October 2006
Accepted: 6 February 2007
This article is available from: />© 2007 Borst and Abarbanel; licensee BioMed Central Ltd.
This is an Open Access article distributed under the terms of the Creative Commons Attribution License ( />),
which permits unrestricted use, distribution, and reproduction in any medium, provided the original work is properly cited.
Theoretical Biology and Medical Modelling 2007, 4:7 />Page 2 of 13
(page number not for citation purposes)
the concentration of indicator with bound calcium y(t).
We call the total indicator concentration (free and calcium
bound) y
max
. Thus, the free indicator concentration
becomes y
max
-y(t). The concentration y
max
is the initial
level of the free indicator dye immediately after injection
in the case of synthetic dyes, or the total amount of indi-
cator protein (calcium bound and free) in the case of
genetically encoded indicators.
The following system of two coupled nonlinear ordinary
differential equations describes the dynamics of the sys-
tem:
(1) x'(t) =
α
(t) -
γ
·x(t) - y'(t)
(2) y'(t) = k
f
·x(t)·[y
max
- y(t)] - k
b
·y(t)
The first equation state that the rate of change of free cal-
cium, x'(t), is driven by the calcium flux
α
(t) and depleted
by the pump -
γ
x(t) as well as the rate of change of indica-
tor bound to calcium, -y'(t). The second equation states
that calcium is bound to the indicator at a rate k
f
and is
proportional to the concentration of free calcium, x(t), as
well as to the concentration of the free indicator, y
max
-
y(t). Calcium disassociates from the indicator at a rate k
b
and this dissociation process is proportional to the con-
centration of calcium bound indicator y(t).
For a constant calcium influx
α
(t) =
α
C
, the steady-state
solutions are
(3) x
∞
=
α
C
/
γ
, and
(4) , or in terms of x:
.
In general, eqs. (1) and (2) can only be solved numeri-
cally. However, if the indicator concentration is negligible
compared to the calcium concentrations, eq. (1) turns
into a simple differential equation describing a 1
st
order
low-pass filter with time-constant 1/
γ
:
(5) x'(t) =
α
(t) -
γ
·x(t)
In other words: if there is no indicator present, and the
pump rate is known, the unperturbed calcium concentra-
tion can be calculated as the low-pass filtered response to
the calcium influx
α
(t).
Our approach will be to use eqs. (1) and (2) to determine
the calcium influx
α
(t) in the presence of the indicator.
This tells us how much calcium flows into the neuron as
a result of activation, and allows us to remove the action
of the indicator mathematically. With
α
(t) known, we
may use eq. (5) to determine the time-course of the unper-
turbed calcium concentration. As we will show in the fol-
lowing, this approach is feasible only within certain
parameter regimes, but is not restricted to the linear
regime. Nevertheless, we will start our considerations with
an analysis of the linear regime.
The linear regime
To investigate the linear regime, we rewrite eq. (2) as
(6) y'(t)/k
f
= y
max
·x(t) - y(t)·[x(t) - K
D
];
When x(t) is much smaller than the K
D
value of the indi-
cator, eq. (6) becomes:
(7) y'(t) = y
max
·k
f
·x(t) - k
b
·y(t)
Combining the derivative of this with eq. (1) gives us
(8) y''(t) + y'(t)·(k
b
+
γ
+ k
f
y
max
) + y(t)·
γ
·k
b
-
α
(t)·k
f
·y
max
= 0
This is a linear ordinary differential equation with con-
stant coefficients. The solution of the homogeneous equa-
tion is of the form y(t) = c·e
λ
·t
, where
λ
satisfies the
characteristic equation:
(9)
λ
2
+
λ
A +
γ
·k
b
= 0; A = k
b
+
γ
+ k
f
y
max
.
This has solutions
λ
1,2
with the negative inverses
τ
1,2
= -1/
λ
1,2
, which are time-constants given by
yy
K
C
CD
∞
=⋅
+⋅
max
α
αγ
yy
x
xK
D
∞
∞
∞
=⋅
+
max
10
1
2
4
12
2
()
=++±++
()
−
⎡
⎣
⎢
⎤
⎦
⎥
τ
γ
γγγ
,maxmax
k
kky kky k
b
bf bf b
Table 1: Symbols used in kinetic model
Symbol Name of Quantity Units
V(t) Membrane voltage mV
x(t) Free calcium concentration Mol
y(t) Indicator bound calcium Mol
y
max
Total free and bound indicator Mol
α
(t) Calcium influx Mol/sec
γ
Pump rate 1/sec
k
f
Forward binding constant 1/(Mol sec)
k
b
Backward binding constant 1/sec
K
D
Dissociation constant = k
b
/k
f
Mol
R
f
dimensionless forward rate k
f
y
max
/
γ
-
R
b
dimensionless backward rate k
b
/γ -
Theoretical Biology and Medical Modelling 2007, 4:7 />Page 3 of 13
(page number not for citation purposes)
Since (k
b
+
γ
+ k
f
y
max
)
2
- 4
γ
·k
b
≥ 0 and
, both
time-constants are always real and positive. For small val-
ues of k
f
y
max
, as well as for large values of k
b
, these
become:
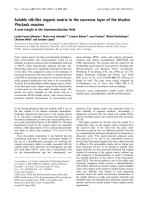
The dependence of the time-constant with the larger abso-
lute value,
τ
1
, on the dimensionless parameters R
b
and R
f
,
is shown in Figure 1a. The axes are logarithmic. As one can
see, the larger we set R
b
, at fixed R
f
, the smaller is
τ
1
, that
is, the faster calcium is released from the bound indicator.
τ
1
is larger, at fixed R
b
, for larger R
f
; in other words, the
faster calcium is bound to the indicator (k
f
) and the larger
the initial indicator concentration (y
max
).
For the case of a pulse of injected calcium current of suffi-
cient length, we can obtain particular solutions for y(t).
For that, we insert into eq.
(8) and note the following initial conditions: y(0) = 0 and
y'(0) = 0 for the rise of y(t) after the pulse is initiated, and
y(0) = y
max
α
c
/(
γ
·K
D
) and y'(0) = 0 for the decay phase after
the pulse is completed.
The initial increase of bound indicator from y(t) = 0, using
A = k
b
+
γ
+ k
f
·y
max
again, is
kky kky k
bf bf b
++ ≥ ++
()
−⋅
γγγ
max max
2
4
11 1
0
12 12
()
==
→→∞
lim lim / .
max
//
ky k
fb
ττγ
12
1
2
114
1
2
()
=+++++
()
−
⎡
⎣
⎢
⎤
⎦
⎥
τ
γ
R
RR RR R
b
bf bf b
yt c e c e k
tt
()=⋅ +⋅ +
⋅⋅
12
12
λλ
13
2
11
4
1
2
1
()
=
⋅
⋅⋅
⋅−+
−
⎛
⎝
⎜
⎜
⎞
⎠
⎟
⎟
⋅−
()
−−yt
y
K
A
Ak
t
A
C
D
b
( ) exp /
max
α
γ
γ
τ
AAk
t
b
2
2
4−
⎛
⎝
⎜
⎜
⎞
⎠
⎟
⎟
⋅−
()
⎡
⎣
⎢
⎢
⎢
⎤
⎦
⎥
⎥
⎥
γ
τ
exp /
a: Dependence of the time-constant
τ
1
of the linearized system on the two dimensionless kinetic parameters R
b
and R
f
, shown as a contour plot in the R
b
-R
f
planeFigure 1
a: Dependence of the time-constant
τ
1
of the linearized system on the two dimensionless kinetic parameters R
b
and R
f
, shown
as a contour plot in the R
b
-R
f
plane. Numbers on the iso-
τ
lines indicate the value of the time-constant in seconds. b: Time-
course of the calcium-bound indicator signal y(t) in the linear regime, i.e. when eqs. (15) and (16) apply. The inset shows the
parameters for the two exponential functions describing the time course: for the decay,
and for the increase. If not subject to variation, the parameters in both a and b were
as follows: k
b
= 100.0 [1/sec], k
f
= 0.1 [1/(nMol*sec)],
γ
= 20.0 [1/sec], y
max
= 1000.0 [nMol] and
α
0
= 100.0 [nMol/sec]. Conse-
quently, the K
D
= 1000 nMol, and the dimensionless kinetic parameters R
b
and R
f
both were 5.0.
yt y c e c e
tt
() ( )
//
=⋅⋅ +⋅
()
−−
0
12
12
ττ
yt y c e c e
tt
() ( )
//
=⋅−⋅ +⋅
()
−−
01
12
12
ττ
Theoretical Biology and Medical Modelling 2007, 4:7 />Page 4 of 13
(page number not for citation purposes)
After calcium influx has stopped, when
α
(t) = 0, the
bound indicator decays to zero as
The time course of the indicator signal under these condi-
tions is shown in Fig. 1b.
The goal of this paper is to use the dynamical equations to
determine the
α
(t) associated with an observed indicator
signal y(t), and then relate that to the free calcium concen-
tration that would be associated with this
α
(t) when the
indicator is absent. In the linear regime under considera-
tion, we need to solve eq. (8) for
α
(t) to obtain
From this
α
(t) the unperturbed time-course of the calcium
concentration x*(t) can be calculated from (1). It is the
response of a 1
st
order low-pass filter with time-constant
1/
γ
to the driving input
α
(t):
From eq. (15) it also follows that . This
is expected as infinite indicator promptly binds all the
available free calcium. So when the cell is overloaded, the
indicator signal directly integrates the calcium influx: the
influx can conversely be recovered by simply differentiat-
ing the indicator signal. This completes our discussion of
the linear regime and we turn to the nonlinear equations
again.
Approximate solution in the nonlinear regime
If we examine the nonlinear eqs. (1) and (2) we see that
an approximate solution with small rate of change in the
calcium bound to the indicator y'(t) is given by
This is an exact solution when
α
(t) is constant, and x(t)
and y(t) are at the fixed point discussed earlier. So, this
might well be a good guess for an approximate solution of
the overall equations. We discuss this in the appendix,
and argue that as long as x(t) is bounded, perturbations to
this solution decay back to it at a rate to be established
there. Also, the variations in x(t) are required to be slow
compared to the variations in the perturbations. This
means the frequency of the low pass filter giving x(t) from
the calcium flux should be smaller than the decay fre-
quencies of the perturbation. The time constant for the
low-pass filter is 1/
γ
.
If we use this solution, i.e. eq. (17), we have
Substituting these terms in eq (1), we determine
α
(t) from
the observed values of y(t) and y'(t):
once again allowing us to determine the effective calcium
flux from observations of the indicator signal, related to
y(t) as discussed below. The time course of the equivalent
unperturbed calcium signal is determined as in eq. (16).
Note again that .
The critical question, of course, is under what circum-
stances this approximation is good. This requires the per-
turbation analysis in the appendix where we give the
decay time constants (in dimensionless units) for small
perturbations from the assumed solution (eq. (17)):
Here, X
0
is a positive constant. Both time constants are
negative, indicating decay of a perturbation back to the
assumed solution. These inverse time constants, in
dimensional form, must be greater than the low pass filter
time constant 1/
γ
for the free calcium concentration. This
is true in the regime of large dimensionless forward and
backward rates.
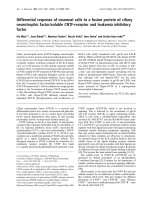
A numerical evaluation of the system of differential equa-
tions (eqs. (1) and (2)) is shown in Fig. 2. As calcium
influx
α
(t) we used a white-noise signal with a standard
deviation of 5
μ
Mol/sec that was subsequently filtered by
a 1
st
-order low-pass with 1 sec time-constant and finally
rectified (Fig. 2a). This signal was then fed into eqs. (1)
and (2), using the following parameters: pump rate
γ
= 10
Hz, initial free indicator concentration y
max
= 1
μ
Mol,
indicator backward rate k
b
= 10 Hz and indicator forward
14
2
1
4
1
2
1
2
()
=
⋅
⋅⋅
⋅+
−
⎛
⎝
⎜
⎜
⎞
⎠
⎟
⎟
⋅−
()
+−yt
y
K
A
Ak
t
A
A
C
D
b
( ) exp /
max
α
γ
γ
τ
−−
⎛
⎝
⎜
⎜
⎞
⎠
⎟
⎟
⋅−
()
⎡
⎣
⎢
⎢
⎢
⎤
⎦
⎥
⎥
⎥
4
2
k
t
b
γ
τ
exp /
15
1
()
=
′′
+
′
++
()
+⋅⋅
⎡
⎣
⎤
⎦
αγγ
() () () ()
max
max
t
ky
yt yt k ky yt k
f
bf b
16
0
()
=
′
−
′
∗−⋅
′
∫
xt dt t te
t
t
() ( )
α
γ
lim ( ) ( )
max
y
tyt
→∞
=
′
α
17
()
=
⋅
+
yt
yxt
xt K
D
()
()
()
.
max
18
2
()
=
−
′
=
′
−
()
xt
ytK
yyt
xt
ytKy
yyt
D
D
()
()
()
()
()
()
.
max
max
max
and
19 1
2
()
=
⋅⋅
−
+
′
⋅+
−
()
⎡
⎣
⎢
⎢
α
γ
()
()
()
()
()
max
max
max
t
Kyt
yyt
yt
Ky
yyt
D
D
⎤⎤
⎦
⎥
⎥
,
lim ( ) ( )
max
y
tyt
→∞
=
′
α
λ
12
0
0
2
0
1
2
1
,
,
,
=− ±
=++ +
+
⎛
⎝
⎜
⎜
⎞
⎠
⎟
⎟
=−+
()
CD
CRRX
RR
RRX
DC RRX
bf
bf
bf
bf
<< C.
Theoretical Biology and Medical Modelling 2007, 4:7 />Page 5 of 13
(page number not for citation purposes)
rate k
f
= 10 Hz/
μ
Mol. With these parameters, the resulting
time-course of the indicator-bound calcium is shown in
Fig. 2b. As a comparison, we also show in Fig. 2b the indi-
cator-bound calcium approximated by eq. (17). Both
curves closely agree. In Fig. 2c, the indicator-bound cal-
cium is shown as a function of the free cytosolic calcium,
once (in black) as obtained from numerical integration of
eqs. (1) and (2), once (in red) using the approximation
using eq. (17). In this plot, certain deviations of the real
signal from the approximate one can be observed. We
subsequently quantified these deviations by calculating
the root-mean-square of the difference between the real
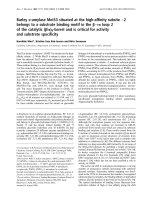
Results of numerical integration of eqs. (1) and (2)Figure 2
Results of numerical integration of eqs. (1) and (2). a: Calcium influx
α
(t). b: Real and approximated indicator-bound calcium
concentrations, given the following parameters: pump rate
γ
(t) = 10 Hz, initial free indicator concentration y
max
= 1
μ
Mol, indi-
cator backward rate k
b
= 10 Hz and indicator forward rate k
f
= 10 Hz/
μ
Mol. This corresponds to Rb and Rf = 1.0. c: Real and
approximated indicator-bound calcium as a function of the free cytosolic calcium. d: Root-mean-square (rms) of the difference
between real and approximated signal as a function of the two dimensionless kinetic parameters Rb and Rf. Number on the iso-
rms contour lines indicate the rms value as a percent of the real indicator-bound signal.
Theoretical Biology and Medical Modelling 2007, 4:7 />Page 6 of 13
(page number not for citation purposes)
and approximated signals. We did that for a total of
10,000 pairs of the two kinetic parameters R
b
and R
f
as
defined above. Note that the parameters used in the above
examples correspond to the values R
b
= 1.0 and R
f
= 1.0.
The result is shown in Fig. 2d. The contour plot indicates
that the rms values are smaller, i.e. the approximation is
better, for larger R
b
and R
f
values. This is in close agree-
ment with the result of our perturbation analysis.
Including internal buffering
Our mathematical analysis, for the sake of simplicity, has
so far excluded the existence of internal buffers. In the fol-
lowing, we introduce an additional variable z(t), denoting
the calcium bound internal buffer. We also give a super-
script to the rate constants with 'y' referring to the calcium
bound indicator, and 'z' referring to the calcium bound
internal buffer. Consequently, we call the total (free and
calcium bound) buffer concentration z
max
. Writing down
the basic dynamic equations gives:
(21) x'(t) =
α
(t) -
γ
·x(t) - y'(t) - z'(t)
Comparing these equations with our initial set (eqs. (1)
and (2)), one realizes that an additional loss term has
entered in eq. (21) to account for the calcium binding to
the internal buffer. Eq. (22), which describes the binding
to the indicator, is identical to eq. (2), and eq. (23) is a
replication of eq. (2) with the buffer z substituting for the
indicator y.
The steady-state solutions are:
Thus, the steady-state solutions for free calcium and cal-
cium-bound indicator remain the same, no matter
whether there is a buffer or not.
In the linear regime, the above equations reduce to the fol-
lowing system, now written in matrix notation for the
sake of clarity:
The homogeneous part of this equation has the solutions
k·e
λ
t
, where
λ
is an Eigenvalue of the matrix, and k the
respective Eigenvector. The time-constants can, again, be
obtained analytically from the characteristic (cubic) equa-
tion of the above matrix. The resulting expressions, how-
ever, are extremely lengthy and do not give any insight
into the solution.
As a further step, we can also study the approximate solu-
tion in the nonlinear regime including an internal buffer.
We use again the relationship from eq. (17):
and
From eq. (27), obtain the derivative z'(t):
We rearrange eq. (26) to obtain
, and from that, calculate
x'(t):
Using eqs. (29) and (30), we now substitute x(t) and x'(t)
in eq. (28) and obtain:
Now, we use eqs. (29), (30) and (31) and substitute in eq.
(21). Rearranging for
α
(t) gives:
Thus, the calcium influx can be determined in a manner
similar to the situation without such a buffer (note how
eq. (32) reduces to eq. (19) when z
max
becomes zero). In
order to do so, one also has to know the total amount of
calcium-bound and free internal buffer plus its binding
constant.
22
()
=⋅ ⋅ −
[]
−⋅yt k xt y yt k yt
f
y
b
y
() () () ()
max
23
()
′
=⋅ ⋅ −
[]
−⋅zt k xt z zt k zt
f
z
b
z
() () () ()
max
24
()
==⋅
+⋅
=⋅
+⋅
∞∞ ∞
xyy
K
zz
K
C
C
C
D
y
C
CD
z
αγ
α
αγ
α
αγ
/;;;
max max
25
()
′
′
′
⎛
⎝
⎜
⎜
⎜
⎞
⎠
⎟
⎟
⎟
=
−− − + +
+
xt
yt
zt
ky kz k k
k
f
y
f
z
b
y
b
z
()
()
()
max max
γ
ff
y
b
y
f
z
b
z
yk
kz k
xt
yt
zt
max
max
()
()
()
−
+−
⎡
⎣
⎢
⎢
⎢
⎢
⎢
⎤
⎦
⎥
⎥
⎥
⎥
⎥
⋅
⎛
⎝
⎜
⎜
⎜
⎞
0
0
⎠⎠
⎟
⎟
⎟
+
⎛
⎝
⎜
⎜
⎜
⎞
⎠
⎟
⎟
⎟
α
()t
0
0
26
()
=⋅
+
yt y
xt
Kxt
D
y
()
()
()
max
27
()
=⋅
+
zt z
xt
Kxt
D
z
()
()
()
max
28
2
()
′
=⋅
′
⋅
+
()
zt z
xt K
Kxt
D
z
D
z
()
()
()
max
29
()
=⋅
−
xt K
yt
yyt
D
y
()
()
()
max
30
2
()
′
=⋅
′
−
()
xt K y
yt
yyt
D
y
()
()
()
.
max
max
31
1
2
()
′
=⋅⋅
′
−
()
⋅⋅
+⋅
zt z K y
yt
yyt
K
KK
yt
D
y
D
z
D
z
D
y
()
()
()
()
max max
max
yyyt
max
()−
⎛
⎝
⎜
⎞
⎠
⎟
2
32 1
2
()
=
⋅⋅
−
+
′
⋅+
⋅
−
()
+
α
γ
()
()
()
()
()
max
max
max
t
Kyt
yyt
yt
Ky
yyt
D
y
D
y
KKy Kz
yt K K K y
D
y
D
z
D
z
D
y
D
z
⋅⋅⋅
⋅−
(
)
+⋅
(
)
⎡
⎣
⎢
⎢
⎢
⎢
⎤
⎦
⎥
⎥
⎥
⎥
max max
max
()
2
Theoretical Biology and Medical Modelling 2007, 4:7 />Page 7 of 13
(page number not for citation purposes)
Removing the indicator y(t) from eq. (21) and inserting
eq. (28), the unperturbed calcium concentration x*(t) is
the solution of the following nonlinear differential equa-
tion:
This equation can be solved by numerical integration.
Note again that eq. (33) reduces to eq. (16) when z
max
becomes zero.
Discussion
In the work presented above we have derived, from first
principles, the dependence of the time-course of the indi-
cator signal on the calcium influx and the relevant proper-
ties of the indicator and the cell under investigation. In
order to do so, we assumed that the system approximately
follows its steady-state at every point in time (eq. (17)).
Under these conditions, we were able to calculate the cal-
cium influx from the indicator time-course, no matter
whether the free calcium concentration is in the linear or
nonlinear range with respect to the binding constant of
the indicator. Ignoring a cell-internal buffer system, this
solution is represented by our eq. (19), from which the
time-course of the unperturbed calcium concentration
can be derived by a simple convolution with a 1
st
order
low-pass filter, the time-constant of which is given by the
inverse of the pump rate, i.e. 1/
γ
. Importantly, by using
perturbation analysis, we were also able to indicate the
parameter regime within which this solution is valid.
We also included an additional cell internal buffer in our
model. Using the same approximation as above, i.e. eq.
(17), we could calculate the calcium influx from the indi-
cator time-course (eq. (32)) and the time-course of the
unperturbed calcium concentration under these condi-
tions (eq. (33)). In contrast to the situation without inter-
nal buffer, the unperturbed calcium concentration does
not follow the calcium influx as fed through a linear, 1
st
order low-pass filter but, instead, is altered by the dynamic
interaction to and from the cell-internal buffer. In this
case, however, we could not indicate the parameter range
within which our solution is valid.
It is straightforward to see how the above approach can be
extended to include several buffer systems. Nevertheless,
our current analysis ignores some of the complexity that
real nerve cells exhibit, such as feed-back of the intracellu-
lar calcium level on to the membrane currents via cal-
cium-dependent Ca- and K-conductances. While these can
be included in numerical simulations of calcium dynam-
ics, analytical treatment of the resulting equations are
beyond the scope of the present paper and have to await
future investigation.
Feasibility of the approach
To apply the approach outlined above to an experimental
situation, one has to realize, first of all, that the indicator
bound calcium (y(t) in our terminology) is not a parame-
ter immediately being measured. Instead, what is immedi-
ately measured is a fluorescence signal. This is, of course,
related to the indicator bound calcium, and the quantifi-
cation of this relationship is given in Appendix II. Never-
theless, the application of our approach to an
experimental situation, in particular in the nonlinear
regime, has some shortcomings. First of all, application of
eqs. (15) or (19) requires knowledge of parameters such
as extrusion rate, initial indicator concentration etc. If
these are not known, the calcium influx can-not be calcu-
lated. But even if all these parameters are known, the
application of eqs. (15) or (19) is problematic since the
indicator signal will be subject to noise. In this event, tak-
ing the first or second order derivatives of a measured sig-
nal will boost the noise, and-, dividing by small values of
(y
max
- y(t))
2
(when the bound indicator is saturating, i.e.
approaching the initial free indicator concentration) will
further lead to unstable solutions. Therefore, alternative
approaches should be considered.
Alternative approach I: linear regime
One such alternative approach is applicable when the
relationship between the membrane voltage and the cal-
cium influx and the indicator signal is linear through all
stages. While the first relationship, i.e. the one between
membrane voltage and calcium influx, is in general not
linear, one can either work with small membrane devia-
tions around a potential where calcium channels are
already activated, or use the number of action potentials
of the actual membrane potential as the signal V(t). The
method outlined below requires measuring the voltage
signal V(t) and indicator signal y(t) simultaneously. Then
we can determine the relationship between the voltage
and the bound indicator time course, and from the latter
determine V(t). If we know V(t), we can use an equation
for calcium dynamics to predict the calcium influx
α
(t).
In the linear regime we can do this by assuming that y(t)
is given by a first order kernel g(t) in terms of V(t)
(34) y(t) = ∫dt' g(t - t')V (t').
From several such example recordings, the optimal reverse
filter g
rev
(t) can be calculated in the Fourier domain using
the Wiener-Kolmogorov formalism if the calcium concen-
trations are small compared to the K
D
value of the indica-
tor, i.e. when the system is in the linear regime. Under
these conditions, the bound indicator concentration can
33 1
2
()
′
=−⋅
()
⋅+
⋅
+
()
⎡
⎣
⎢
⎢
⎢
⎤
⎦
⎥
⎥
⎥
∗∗
∗
xt t xt
zK
Kxt
D
z
D
z
() () ()
()
max
αγ
−−1
Theoretical Biology and Medical Modelling 2007, 4:7 />Page 8 of 13
(page number not for citation purposes)
be calculated from the calcium influx as a convolution
with the following so-called 'forward' filter g
forw
(t) (see eq.
(13)):
Given that there is a linear relationship between mem-
brane voltage and calcium influx, the problem of recover-
ing the membrane voltage from indicator measurements
is to find the optimal reverse filter, which can then be
applied to all those situations where only the optical sig-
nal from the calcium-bound indicator y(t) has been meas-
ured. As can be shown, the optimal reverse filter g
rev
(t) is
not the inverse of the forward filter that turns V(t) into
y(t) (as done by Yaksi and Friedrich, [9]), but rather the
average cross-correlation between V(t) and y(t), divided
by the power spectrum of y(t) [10,11]. Denoting the
inverse Fourier Transform by F
-1
, y*(f) the complex conju-
gate of y(f) and the average across n trials by Ό , the opti-
mal reverse filter g
rev
(t) becomes:
Convolving each new optical signal y(t) with g
rev
(t) then
results in the optimal estimate of the voltage signal, lead-
ing to a calcium influx and consequently to the optical sig-
nal of bound indicator. Clearly, the advantage of this
method is that no parameters need to be known; the dis-
advantage is that enough dual measurements of mem-
brane voltage and indicator need to be at hand to
calculate the optimal reverse filter g
rev
(t). As another
caveat, this method only works as long as calcium concen-
trations are in the linear regime with respect to the K
D
of
the indicator and to membrane voltage. An example of a
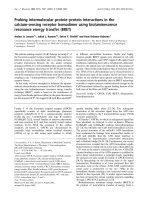
reverse reconstruction in the linear regime is shown in Fig.
3. Here, the signal was created by Gaussian noise with an
auto-correlation time-constant of 100 ms that was subse-
quently rectified. From this influx, the calcium bound
indicator concentration y(t) was numerically determined
using eqs. (1) and (2) and the following parameters:
pump rate
γ
= 20 Hz, k
f
= 0.01 1/(nMol sec), k
b
= 10 Hz,
resulting in a K
D
value of 1000 nMol, and an initial indi-
cator concentration y
max
= 100 nMol. This led to the aver-
age time course of calcium-bound indicator y(t) shown as
a black line in Fig. 3c. Through 100 trials, a Gaussian noise
signal was added with an auto-correlation time-constant
of 10 ms, which had an average amplitude of 5% of y(t).
Twelve such trials are shown as grey lines superimposed
on Fig. 3c. From these trials, optimal forward g
forw
(t) and
reverse filter g
rev
(t) were calculated according to
and
. These fil-
ters are shown in b and d, respectively. Applying the for-
ward filter to
α
(t), the signal shown in red in Fig. 3c was
obtained. Applying the reverse filter to y(t), the signal
shown in red in Fig. 3a was obtained. Note that while the
forward filter leads to an output that is almost indistin-
guishable from y(t), the reverse filter can only reconstruct
the low-frequency components of
α
(t), since high fre-
quency components are covered by noise in the individ-
ual response trials.
Alternative approach II: nonlinear regime
If either of the two relationships, i.e. the one between
membrane voltage V(t) and the calcium influx
α
(t) or the
one between
α
(t) and bound indicator y(t) (due to a high
calcium level with respect to the K
D
value of the indicator)
is nonlinear, the above method will lead to erroneous
results. In such a nonlinear regime we must use a different
approach. Here, too, we must measure the indicator signal
y(t) and the membrane voltage V(t) simultaneously. In
the reconstructed state space [12] of the voltage measure-
ment we can fully describe the state of the system (neuron
plus indicator) using the voltage and its time lags, or we
can use the indicator signal and its time lags. If we do the
latter, we create data vectors
(37) U(t) = [y(t), y(t -
τ
), y(t - 2
τ
), , y(t - (D - 1)
τ
)],
where the number of lags D and the time lag
τ
are respec-
tively determined by the method of false nearest neigh-
bors and by average mutual information. For every U(t)
there is an associated indicator signal V(t), and since we
have already totally characterized the state of the neuron
by U(t) there must be a nonlinear relationship V(t) =
f(U(t)). We can discover this nonlinear relation from the
simultaneous measurements of y(t) and V(t), then, just as
in the linear case, map new measurements of y(t) to allow
us to predict V(t).
The method requires determining f(U(t)). To accomplish
this, we represent f(U) in terms of some basis functions
chosen by the user:
φ
m
(U), and write
In the state space of the U's, each state vector has many
neighbors U
(l)
(t); l = 0,1 ,N
B
; U
(0)
(t) = U(t). Each of these
35
2
1
4
1
2
1
()
=
⋅⋅
⋅+
−
⎛
⎝
⎜
⎜
⎞
⎠
⎟
⎟
⋅−
()
+−gt
y
K
A
Ak
t
A
A
forw
D
b
( ) exp /
max
γ
γ
τ
22
2
4−
⎛
⎝
⎜
⎜
⎞
⎠
⎟
⎟
⋅−
()
⎡
⎣
⎢
⎢
⎢
⎤
⎦
⎥
⎥
⎥
k
t
b
γ
τ
exp /
36
11
()
==
⋅
⋅
⎧
⎨
⎪
⎩
⎪
⎫
⎬
⎪
⎭
⎪
−−
∗
gtFgf F
Vf y f
yf yf
rev
ii
ii
() {( )}
() ()
() ()
gtFyff ff
forw ii ii
() () ()/ () ()=⋅ ⋅
{}
−∗ ∗1
ααα
g t F fyf yfyf
rev i i i i
() () ()/ () ()=⋅ ⋅
{}
−∗ ∗1
α
38
1
()
=
=
∑
fU c U
mm
m
M
() ().
ϕ
Theoretical Biology and Medical Modelling 2007, 4:7 />Page 9 of 13
(page number not for citation purposes)
Reverse reconstruction of the calcium influx from the indicator signalFigure 3
Reverse reconstruction of the calcium influx from the indicator signal. a: Calcium influx
α
(t) (in black) together with the recon-
structed influx (in red). b: Optimal forward filter g
forw
(t). c: Average time course of calcium-bound indicator y(t) (in black),
reconstructed signal (in red), and 12 individual indicator signals (in grey). d: Optimal reverse filter g
rev
(t).
Theoretical Biology and Medical Modelling 2007, 4:7 />Page 10 of 13
(page number not for citation purposes)
neighbors maps into a voltage V
(l)
(t) = f(U
(l)
(t)). At any
given time, corresponding to a location in U space, we can
determine the coefficients c
m
by minimizing the least
squares form
This establishes the map V(t) = f(U(t)) locally in U space.
Now we make a new measurement of y
new
(t). Use this to
create a new D-dimensional data vector U
new
(t) = [y
new
(t),
y
new
(t -
τ
), y
new
(t - 2
τ
), , y
new
(t - (D - 1)
τ
)]. Search among
all the data vectors in the initial training set and find the
one is closest to U
new
(t); suppose it is U(t'). Then using the
local map attached to U(t') we predict
From the time course of new measurements y
new
(t), we are
thus able to use the learned map to predict the time course
of the new membrane voltage V
new
(t), which was our goal.
Relationship to previous studies
Previous studies on calcium binding mainly considered
steady-state situations or the linear case, i.e. that calcium
concentrations are small compared to the dissociation
constant K
D
of the indicator [13;14]. In particular, a
number of studies investigated the diffusion of Calcium
ions in the presence of buffers [15-19]. However, none of
these interesting papers focused on the time dependent
nonlinear kinetics without diffusion or addressed the
temporal stability of our eqs. (1) and (2) for the approxi-
mate linear or the approximate nonlinear solutions that
we derived above.
Our study can be related to these previous investigations
when we combine our approximation about the dynamics
of the system without internal buffer (eq. (17)) with the
condition of small free calcium concentration. Thus, eq.
(17) becomes:
, and
Inserting eq. (41) into eq. (1) leads to:
Eq. (43) describes a 1
st
order low-pass filter with a time-
constant equal to
With the indicator concentration being small, the time-
constant becomes 1/
γ
. Large indicator concentrations,
therefore, increase the time-constant from 1/
γ
to the value
indicated by eq. (44).
Repeating the above for the situation with an internal
buffer, eq. (42) remains unaltered. In a similar way, we
derive from eq. (27)
, and from that
Substituting eqs. (42) and (46) into eq. (21) gives
Rearranging leads to
This, again, describes a 1
st
order low-pass filter with a
time-constant equal to:
Comparing this result to eq. (44), one can see that inter-
nal buffering enlarges the time constant by an additive
term, equivalent to the one introduced by the indicator.
Eq. (49) is identical to eq. (2) in [20].
Neher and Augustine [21] defined the calcium binding
capacity as the ratio of the change in bound indicator con-
centration over the change in free Calcium:
For the linear case, i.e. when the calcium concentrations
are small compared to the dissociation constant K
D
, this
quantity is identical to y
max
/K
D
, as can be derived from eq.
39
1
2
0
()
−
⎛
⎝
⎜
⎜
⎞
⎠
⎟
⎟
==
∑∑
Vt ct Ut
l
mm
l
m
M
l
N
B
() ()
() () ( ()) .
ϕ
40
1
()
=
′
=
∑
Vt ct Ut
new m m new
m
M
( ) ( ) ( ( )).
ϕ
41
()
=⋅
+
≈⋅yt y
xt
Kxt
xt
y
K
DD
()
()
()
()
max
max
42
()
′
≈
′
⋅yt xt
y
K
D
() ()
max
43
1
1
()
′
⋅⋅ +
⎛
⎝
⎜
⎞
⎠
⎟
=−xt
y
K
t
xt
D
()
()
()
max
γ
α
γ
44
1
1
()
=+
⎛
⎝
⎜
⎞
⎠
⎟
τ
γ
y
K
D
max
45
()
≈⋅zt xt
z
K
D
z
() ()
max
46
()
′
≈
′
⋅zt xt
z
K
D
z
() () ,
max
47
()
′
=−⋅−
′
⋅−
′
⋅xt t xt xt
y
K
xt
z
K
D
y
D
z
() () () () ()
max max
αγ
48
1
1
()
′
⋅+ +
⎛
⎝
⎜
⎜
⎞
⎠
⎟
⎟
=−xt
y
K
z
K
t
xt
D
y
D
z
()
()
()
max max
γ
α
γ
49
1
1
()
=+ +
⎛
⎝
⎜
⎜
⎞
⎠
⎟
⎟
τ
γ
y
K
z
K
D
y
D
z
max max
.
50
()
=
κ
Δ
Δ
yt
xt
()
()
Theoretical Biology and Medical Modelling 2007, 4:7 />Page 11 of 13
(page number not for citation purposes)
(42). For the nonlinear case, i.e. when the calcium con-
centrations are large compared to the dissociation con-
stant K
D
, we first derive from eq. (17)
Using eqs. (17) and (50), the calcium binding capacity
becomes:
This, again, is identical to eq. (3) in [20].
In their study on Calcium diffusion, Naraghi and Neher
[17] investigated a linearized mathematical model of dif-
fusion and kinetics. For one buffer their results are con-
tained in their eqs (AII.9) and (AII.10). This corresponds
to our analysis when one sets the calcium source, our
α
(t),
and our kinetic loss terms for free calcium, our -
γ
x(t),
both to zero, accounting for the zero eigenvalues they
report. Majewska et al. [19] focused on determining time
constants for intracellular calcium kinetics experimen-
tally. Their results show time scales in the range of 100 s
of ms. This is the order of magnitude we have used in
selecting our pump rate
γ
whose value we chose as 1/
γ
=
100 ms in our numerical simulations. Wagner and Keizer
[16] again focused on diffusion of calcium. Their notation
identifies a free calcium concentration [Ca
2+
], which is
just our x(t), and a concentration of calcium bound to a
mobile buffer [CaB
m
], which is precisely our y(t), and
finally the concentration of the mobile buffer itself [B
m
],
which is our y
max
-y(t). They do not have source terms for
the calcium influx, our
α
(t), or kinetic loss terms for free
calcium, our -
γ
x(t). Ignoring diffusion and these sources
and sinks of [Ca
2+
], their eqs. (2), (3), and (4), are pre-
cisely our eqs. (1) and (2) above. It is important they do
not analyze the nonlinear ordinary (kinetic) differential
equations that result when diffusion is not important.
Using the estimates of Zhou and Neher for the diffusion
constants to be about 300
μ
m
2
/s this translates to a time
for diffusion over a cellular scale to be about 3 ms which
is much shorter than the kinetic time constants we con-
sider or are discussed by Majewska et al. [19]. This gives
our rationale for ignoring diffusion and focusing on prop-
erties of the nonlinear kinetics.
Appendix I: perturbation analysis of the nonlinear solution
We begin by making eqs. (1) and (2) dimensionless.
There are three quantities with the dimensions of (time)
-
1
: k
b,
γ
, and k
f
y
max
. We express our indicator kinetic equa-
tions in terms of the two dimensionless variables which
can be made from these
(A1) R
b
= k
b
/
γ
; R
f
= k
f
y
max
/
γ
.
We also scale x(t) and y(t) with the initial indicator con-
centration y
max
and the time by the pump rate
γ
:
(A2) x(t) → y
max
X(t); y(t) → y
max
Y(t); t → t/
γ
;
Thus, in these new dimensionless variables, free calcium
and calcium-bound indicator concentrations are given as
fractions of the initial free indicator concentration, and
the forward and backward rates are given relative to the
pump rate.
The kinetic eqs. (1) and (2) now become:
(A3) X'(t) =
α
(t)/(
γ
·y
max
) - X(t) - Y'(t)
(A4) Y'(t) = R
f
X(t)·(1 - Y(t)) - R
b
Y(t).
We chose as an approximate solution of these equations
functions
for which
This solution is suggested by the vanishing of the right
hand side of eq. (A4) as well as by the fixed point solu-
tion, true when X(t) is time independent. Another motiva-
tion for this approximate solution is that when both R
b
and R
f
are large, the right hand side of eq. (A4) would
make the rate of change of the calcium bound indicator
vary quite rapidly unless the balance indicated by eq. (A5)
were maintained.
To determine when this solution is accurate, we make per-
turbations
(A7) X(t) = X
0
(t) + Δ
X
(t)
(A8) Y(t) = Y
0
(t) + Δ
Y
(t),
and linearize the equations in Δ
X
(t) and Δ
Y
(t). From eqs.
(A3) and (A4) we obtain, to first order in the perturba-
tions,
51
2
()
′
=⋅
′
⋅
+
()
yt y
xt K
Kxt
D
D
()
()
()
max
52
2
()
=
⋅
+
()
κ
yK
Kxt
D
D
max
()
A5
0
0
0
()
=
+
Yt
RX t
RRXt
f
bf
()
()
()
,
A6
0
0
2
0
()
′
=
+
⎡
⎣
⎤
⎦
⋅
′
Yt
RR
RRXt
Xt
fb
bf
()
()
().
A9 1
()
=− +
⎡
⎣
⎢
⎤
⎦
⎥
+
dt
dt
t
RR
t
X
X
bf
Y
Δ
ΔΔ
()
() ()
η
η
Theoretical Biology and Medical Modelling 2007, 4:7 />Page 12 of 13
(page number not for citation purposes)
where
(A11)
η
= R
b
+ R
f
X
0
(t),
and X
0
(t) satisfies
These are very similar to those for the linearized problem
discussed in the text. The key differences are that
η
= R
b
+
R
f
X
0
(t) is time dependent and there is an inhomogeneous
term in the equations for Δ
Y
(t). Since the solution for the
unperturbed X
0
(t) is a low pass filtered version of the cal-
cium influx, we take it as a positive constant, slowly vary-
ing, in the perturbation equations.
The equation for Δ(t) = (Δ
X
(t), Δ
Y
(t)) written in matrix
form is
with . The eigenvalues of the matrix M
are
(A14)
λ
1,2
= -C ± D
With
and
,
so C, D >0 and D<C, so both eigenvalues are negative.
This means the solution is trying to drive Δ(t) = (Δ
X
(t),
Δ
Y
(t)) to zero, with "bumps" from the forcing term. If the
forcing term is bounded above, that is the derivative (A6)
remains below some maximum value while the calcium
current is flowing, the solutions Δ(t) = (Δ
X
(t), Δ
Y
(t)) go to
zero. In these weak conditions, the assumed solutions
(X
0
(t),Y
0
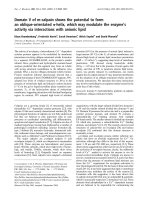
(t)) are stable. The larger time-constant is shown
in Fig. 4 as a function of R
b
and R
f
. It agrees with the rms
values shown in Fig. 2d.
Appendix II: relating the fluorescence signal to calcium-
bound indicator concentration
From eqs. (19) and (32), it is important to note that
α
(t)
does not scale with y(t). Therefore, the indicator concen-
tration enters these equations as an absolute concentra-
tion. Otherwise, the calculated time-course of the calcium
influx will be incorrect (and not just by a factor!). Usually,
however, the indicator concentration is not available
directly, but rather as fluorescence values, in most cases as
ΔF/F, i.e. fluorescence changes relative to a reference fluo-
rescence F(0) obtained just before the start of an experi-
ment. The fluorescence value F(t) is the sum of the
fluorescence of the indicator with bound calcium. i.e. y(t),
and free indicator concentrations, i.e. z
0
-y(t), each one
contributing to the total fluorescence by a factor f
b
(bound) and f
f
(free), respectively:
(A15) F(t) = f
b
·y(t) + f
f
·(y
max
- y(t))
The factors f
b
and f
f
both can be determined experimen-
tally from the fluorescence of a calcium-free and a cal-
cium-saturated indicator solution. Using the maximum
fluorescence change (ΔF/F)
max
of the indicator as (f
b
- f
f
)/
f
f
, the following relation then holds between y(t) and ΔF/
F:
A10
0
()
=−−
dt
dt
t
RR
t
dY t
dt
Y
X
fb
Y
Δ
ΔΔ
()
() ()
()
,
η
η
A12
00
()
′
=
⋅
−Xt
t
y
Xt()
()
().
max
α
γ
A13
()
=+
dt
dt
Mt Ft
Δ
Δ
()
() (),
Ft
dY t
dt
() ( ,
()
)=−0
0
C
RR
bf
=++
⎡
⎣
⎢
⎤
⎦
⎥
1
2
1
η
η
D
RR RR
RR
bf bf
bf
=++
⎡
⎣
⎢
⎤
⎦
⎥
−= −+
⎡
⎣
⎢
⎤
⎦
⎥
+
1
2
14
1
2
14
22
ηηη
η
η
,
A16
0
0
0
0
()
=
−
=
−
[]
⋅
()
⋅
()
Δ
Δ
Δ
F
F
t
Ft F
F
yt y F F
yFF
()
() ( )
()
() ( ) /
() /
max
mmax
max
+ y
Relaxation time-constant (eq. (A14) with X
0
= 1.0) as a func-tion of the two dimensionless kinetic parameters Rb and RfFigure 4
Relaxation time-constant (eq. (A14) with X
0
= 1.0) as a func-
tion of the two dimensionless kinetic parameters Rb and Rf.
Numbers on the iso-
τ
contour lines indicate the value in sec-
onds. Compare with Fig. 2d.
Publish with BioMed Central and every
scientist can read your work free of charge
"BioMed Central will be the most significant development for
disseminating the results of biomedical research in our lifetime."
Sir Paul Nurse, Cancer Research UK
Your research papers will be:
available free of charge to the entire biomedical community
peer reviewed and published immediately upon acceptance
cited in PubMed and archived on PubMed Central
yours — you keep the copyright
Submit your manuscript here:
/>BioMedcentral
Theoretical Biology and Medical Modelling 2007, 4:7 />Page 13 of 13
(page number not for citation purposes)
Solving eq (A16) for y(t) yields:
When using indicators based on fluorescence resonance
energy transfer ('FRET'), results are usually expressed in
the relative change of the fluorescence ratio obtained at
two different wavelengths, one from the donor fluoro-
phore F
1
, and the other from the acceptor fluorophore F
2
,
respectively:
Inserting eq. (A15) for each wavelength, the relation to
the indicator concentration becomes:
Acknowledgements
We are grateful to E. Neher, J. Mueller and F. Theunissen for fruitful discus-
sions and to D. Spavieri and three anonymous referees for carefully reading
previous versions of the ms.
References
1. Grynkiewicz G, Poenie M, Tsien RY: A new generation of Ca indi-
cators with greatly improved flourescence properties. J Biol
Chem 1985, 260:3440-3450.
2. Tank DW, Sugimori M, Connor JA, Llinás RR: Spatially resolved
calcium dynamics of mammalian purkinje cells in cerebellar
slice. Science 1988, 242:773-777.
3. Borst A, Egelhaaf M: In vivo imaging of calcium accumulation in
fly interneurons as elicited by visual motion stimulation.
PNAS 1992, 89:4139-4143.
4. Sobel EC, Tank DW: In vivo Ca
2+
dynamics in a cricket auditory
neuron: an example of chemical computation. Science 1994,
263:823-826.
5. Miyawaki A, Llopis J, Heim R, McCaffery JM, Adams JA, Ikura M, Tsien
RY: Fluorescent indicators for Ca
2+
based on green fluores-
cent proteins and calmodulin. Nature 1997, 388:882-887.
6. Single S, Borst A: Dendritic integration and its role in comput-
ing image velocity. Science 1998, 281:1848-1850.
7. Pologruto TA, Yasuda R, Svoboda K: Monitoring neural activity
and [Ca2+] with genetically encoded Calcium indicators. J
Neuroscience 2004, 24:9572-9579.
8. Reiff DF, Ihring A, Guerrero G, Isacoff EY, Joesch M, Nakai J, Borst A:
In vivo comparison of 11 GFP-based indicators of neural
activity in genetically engineered flies. J Neuroscience 2005,
25:4766-4778.
9. Yaksi E, Friedrich RW: Reconstruction of firing rate changes
across neuronal populations by temporally deconvolved
Ca
2+
imaging. Nature Methods 2006, 3:377-383.
10. Bialek W, Rieke F, de Ruyter van Steveninck RR, Warland D: Read-
ing a neural code. Science 1991, 252:1854-1857.
11. Borst A, Theunissen FE: Information theory and neural coding.
Nature Neuroscience 1999, 2:947-957.
12. Abarbanel HDI: Analysis of Observed Chaotic Data New York: Springer-
Verlag; 1996.
13. Neher E: The use of Fure-2 for estimating Ca buffers and Ca
fluxes. Neuropharmacology 1995, 34:1423-1442.
14. Neher E: Usefulness and limitations of linear approximations
to the understanding of Ca
2+
signals. Cell Calcium 1998,
24:345-357.
15. Zhou Z, Neher E: Mobile and immobile calcium buffers in
bovine adrenal chromafin cells. J Physiol 1993, 469:245-273.
16. Wagner Keizer J: Effects of rapid buffers on Ca
2+
diffusion and
Ca
2+
oscillations. Biophys J 1994, 67:447-456.
17. Naraghi M, Neher E: Linearized buffered Ca
2+
diffusion in
microdomains and its implications for calculation of Ca
2+
at
the mouth of a Calcium channel. J Neurosci 1997, 17:6961-6973.
18. Pape P, De-Shien J, Chandler WK: Effects of partial sarcoplasmic
reticulum Calcium depletion on Calcium release in frog cut
muscle fibers equilibrated with 20 mM EGTA. J Gen Physiol
1998, 112:263-295.
19. Majewska A, Brown E, Ross J, Yuste R: Mechanisms of Calcium
decay kinetics in hippocampal spines: Role of spine Calcium
pumps and Calcium diffusion through the spine neck in bio-
chemical compartmentalization. J Neurosci 2000, 20:1722-1734.
20. Jackson MB, Redman SJ: Calcium dynamics, buffering, and
buffer saturation in the boutons of dentate granule-cell
axons in the Hilus. J Neurosci 2003, 23:1612-1621.
21. Neher E, Augustine GJ: Calcium gradients and buffers in bovine
chromaffin cells. J Physiology 1992, 450:273-301.
A17 0 0
()
=⋅+
()
⎛
⎝
⎜
⎜
⎞
⎠
⎟
⎟
+yt
F
F
ty
y
FF
y() () ( )
/
().
max
max
Δ
Δ
A18
00
00
0
12 1 2
12
12
2
()
=
−
=
ΔR
R
Ft Ft F F
FF
FtF
Ft
()/ () ( )/ ( )
()/ ()
() ( )
(
))()F
1
0
1−
A19
0
12 21
22
()
=
⋅−
()
⋅−
()
⋅−
()
+
ΔR
R
yyty ffff
yt f f y
bf bf
bf
max
m
() ( )
()
aax max
()fytffyf
fbff2111
⎡
⎣
⎤
⎦
⋅⋅−
()
+
⎡
⎣
⎤
⎦