Báo cáo y học: " Distinguishing enzymes using metabolome data for the hybrid dynamic/static method" pptx
Bạn đang xem bản rút gọn của tài liệu. Xem và tải ngay bản đầy đủ của tài liệu tại đây (397.76 KB, 12 trang )
Theoretical Biology and Medical
Modelling
BioMed Central
Open Access
Research
Distinguishing enzymes using metabolome data for the hybrid
dynamic/static method
Nobuyoshi Ishii1, Yoichi Nakayama*1,2 and Masaru Tomita1
Address: 1Institute for Advanced Biosciences, Keio University, Tsuruoka, 997-0035, Japan and 2Network Biology Research Centre, Articell Systems
Corporation, Keio Fujisawa Innovation Village, 4489 Endo, Fujisawa, 252-0816, Japan
Email: Nobuyoshi Ishii - ; Yoichi Nakayama* - ; Masaru Tomita -
* Corresponding author
Published: 20 May 2007
Theoretical Biology and Medical Modelling 2007, 4:19
doi:10.1186/1742-4682-4-19
Received: 1 December 2006
Accepted: 20 May 2007
This article is available from: />© 2007 Ishii et al; licensee BioMed Central Ltd.
This is an Open Access article distributed under the terms of the Creative Commons Attribution License ( />which permits unrestricted use, distribution, and reproduction in any medium, provided the original work is properly cited.
Abstract
Background: In the process of constructing a dynamic model of a metabolic pathway, a large
number of parameters such as kinetic constants and initial metabolite concentrations are required.
However, in many cases, experimental determination of these parameters is time-consuming.
Therefore, for large-scale modelling, it is essential to develop a method that requires few
experimental parameters. The hybrid dynamic/static (HDS) method is a combination of the
conventional kinetic representation and metabolic flux analysis (MFA). Since no kinetic information
is required in the static module, which consists of MFA, the HDS method may dramatically reduce
the number of required parameters. However, no adequate method for developing a hybrid model
from experimental data has been proposed.
Results: In this study, we develop a method for constructing hybrid models based on metabolome
data. The method discriminates enzymes into static modules and dynamic modules using metabolite
concentration time series data. Enzyme reaction rate time series were estimated from the
metabolite concentration time series data and used to distinguish enzymes optimally for the
dynamic and static modules. The method was applied to build hybrid models of two microbial
central-carbon metabolism systems using simulation results from their dynamic models.
Conclusion: A protocol to build a hybrid model using metabolome data and a minimal number of
kinetic parameters has been developed. The proposed method was successfully applied to the
strictly regulated central-carbon metabolism system, demonstrating the practical use of the HDS
method, which is designed for computer modelling of metabolic systems.
Background
Since a biochemical network is essentially a nonlinear,
nonequilibrium, non-steady-state system, dynamic simulation is especially effective for analyzing or predicting its
behaviour in a detailed and realistic manner. However, a
large amount of experimental information, including
reaction mechanisms of enzymes, kinetic constants, and
initial concentrations of enzymes and metabolites, is
required to construct a dynamic model of a metabolic
pathway. Although a number of high-throughput technologies for obtaining comprehensive biochemical data
have been developed [1-6], most experimental methods
for determining enzyme kinetics are of the low-throughput variety. Recently, several databases for enzyme kinetics have been published on the internet [7-9]. However, in
many cases, the parameters in these databases are insuffiPage 1 of 12
(page number not for citation purposes)
Theoretical Biology and Medical Modelling 2007, 4:19
cient for building an accurate metabolic model. Moreover,
although intracellular data can be collected from the published literature, experimental conditions and target
strains are, in general, not uniform. Therefore, a huge
amount of experimental work is currently needed to build
an accurate dynamic model of a biochemical system. For
this reason, a modelling method requiring less experimental effort needs to be developed.
Yugi et al. proposed a novel method for dynamic modelling of metabolism, the hybrid dynamic/static method
(HDS method) [10]. The HDS method divides a dynamic
system into a dynamic module and a static module.
Enzyme reactions included in the dynamic module are
represented by differential equations. Reaction rates of
enzymes included in the static module are calculated by
metabolic flux analysis (MFA) [11,12]. Since MFA needs
no kinetic information, the amount of experimental work
required is dramatically reduced. According to Okino and
Mavrovouniotis's classification [13], the HDS method can
be regarded as a "linear transformation into standard twotime-scale form," which is a time-scale analysis method.
The superior points of the HDS method are its simple
architecture and the admissibility of multiple metabolites.
Only relationships among enzyme reactions are
employed in the HDS method; thus a model builder does
not have to consider the problem of multiple time-scale
reactions of a given metabolite [14]. Since the Moore-Penrose pseudo-inverse [15,16] of the stoichiometric coefficient matrix for the unknown variables (i.e. reaction rates
of enzymes in the static module) is applied in performing
the MFA, the stoichiometric coefficient matrix for the
unknown variables does not have to be square and regular.
Although the HDS method has the aforementioned
advantages, no method has been proposed for splitting a
dynamic system into a dynamic module and a static module before completion of the initial model construction.
Advanced measurement technologies have been developed that now enable researchers to obtain the metabolome, that is, comprehensive metabolite concentration
data [17-19]. It is reasonable to expect that the in-depth
information of the metabolome contributes to the process
for distinguishing dynamic and static enzymes in a metabolic system. In this study, we have developed a method
of distinguishing dynamic and static enzymes based on
metabolome data before construction of a complete
model. The purpose of the proposed method is to provide
the information (distinguishing dynamic from static
enzymes) for initial HDS model construction required by
the model builders without losing the advantage of the
HDS method: reducing experimental efforts to obtain
kinetic information of the modelled metabolic system.
Identification of enzyme kinetic rate equations and the fit-
/>
ting of kinetic parameters using metabolite concentration
data are outside the scope of this study. Moreover, biological meanings of the dynamic/static modules are not considered explicitly in the HDS method.
The proposed method consists of two parts. First, the
enzyme reaction rate time series are estimated from
metabolite concentration time series data. The dynamic
and static enzymes are distinguished using the estimated
enzyme reaction rate time series. The purpose of this study
was to confirm that the proposed method can be used to
construct accurate hybrid models, with accuracy comparable to that of a fully dynamic model. Therefore, we used
pseudo-experimental data obtained from preliminarily
constructed fully dynamic models. Two models of microorganisms, Escherichia coli [20] and Saccharomyces cerevisiae [21], were used for evaluation.
Methods
Hybrid dynamic/static method
The hybrid dynamic/static method (HDS method) is
described in Yugi et al. [10]. Enzyme reaction rates in the
static module are calculated by the following equation:
vstatic(t) = -Sstatic# · Smodule boundary · vmodule boundary(t)
(1)
where vstatic is the static module enzyme reaction rate vector, vmodule boundary is the module boundary enzyme reaction rate vector, Sstatic# is the Moore-Penrose
pseudoinverse of the stoichiometric coefficient matrix for
enzymes in the static module, and Smodule boundary is the
stoichiometric coefficient matrix for module boundary
enzymes. The HDS method aims to describe a system in
which a quasi-steady state is attained in the static module
at each instant, while the overall system (both the
dynamic and the static modules) acts dynamically [10]. A
transient value of the modelled system is calculated by an
interaction between kinetic-based dynamic models and
MFA-based static models.
Estimation of internal enzyme reaction rates
To calculate reaction rates of enzymes from metabolite
concentrations, we define a "system boundary enzyme" as
an enzyme located on the border of the metabolic system
and extending outside the system. The system boundary
enzyme is not the same as the "module boundary
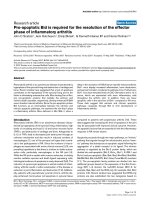
enzyme" defined by Yugi et al. [10]. A non system boundary enzyme is defined as an "internal enzyme." The relationship among the dynamic module, static module,
module boundary enzyme, system boundary enzyme, and
internal enzyme is shown in Figure 1. Since all system
boundary enzymes should be included in the dynamic
module, we assumed that the kinetics of system boundary
enzymes have already been determined and that the reac-
Page 2 of 12
(page number not for citation purposes)
Theoretical Biology and Medical Modelling 2007, 4:19
/>
tion rates of system boundary enzymes can be calculated
from metabolite concentrations.
The reaction rates of internal enzymes were calculated
from the slopes of metabolite concentrations and the reaction rates of the system boundary enzymes. With the definitions of the system boundary enzyme and the internal
enzyme, a mass balance equation of a metabolic system
under a dynamic transition state can be expressed as follows [22]:
v system boundary (t )
[ S diag(−1) ] ⋅ vinternal (t) = O
C′(t )
(2)
where S is the stoichiometric coefficient matrix, diag(-1)
is a diagonal matrix (column number = row number =
metabolite number), vsystem boundary(t) is the system
boundary enzyme reaction rate vector, vinternal(t) is the
internal enzyme reaction rate vector, and C'(t) is the
metabolite concentration slope vector.
If C(t) and vsystem boundary(t) are known, the reaction rates
of the internal enzymes can be estimated from Eq. (3),
which is transformed from Eq. (2).
v system boundary (t )
vinternal (t ) = −Sinternal # ⋅ Ssystem boundary diag(−1) ⋅
C′(t )
(3)
Figure 1
Schematic diagram of hybrid model.
Schematic diagram of hybrid model. The hybrid model
consists of a dynamic module (area shaded with diagonal
lines) and a static module (dotted area). All module boundary
enzymes should be included in the dynamic module. All system boundary enzymes are included in the dynamic module,
but not all system boundary enzymes locate on the border
between the static module and the dynamic module.
where Sinternal# is the Moore-Penrose pseudoinverse of the
stoichiometric coefficient matrix for internal enzymes,
and Ssystem boundary is the stoichiometric coefficient matrix
for system boundary enzymes [see Supplementary Text
(see additional file 1) for an example of this procedure].
This procedure uses only the mass balance of the overall
system and rate equations of the system boundary
enzymes; thus, no information about regulation in the
internal system is required beforehand. When Eq. (3) is
applied to a determined system, the equation provides a
true solution for vinternal, and when Eq. (3) is applied to an
over-determined system, the least-squares estimation of
vinternal is obtained [10]. In both cases, the solution is reasonable even if the modelled metabolic system has a complex network [10]. When Eq. (3) is applied to an underdetermined system, the equation provides the least norm
solution. However, such a least norm solution is not
always a physiologically optimal estimation of vinternal.
This is a limitation of the current procedure.
Evaluation of estimated internal enzyme reaction rates
The accuracy of the estimated internal enzyme reaction
rates was evaluated by means of the reproduced metabolite concentration time series, which were calculated from
the estimated enzyme reaction rates. Since it is difficult to
compare the true and estimated reaction rates, we compared the metabolic concentrations. If an enzyme catalyzes a reversible reaction, the sign of the sum of the
forward and reverse reaction rates may change. Near such
a sign change, the calculated relative error between the
true reaction rate and the estimated reaction rate may at
times be a very large value (see Eq. (4) below). When the
value of a data point is close to zero, a large error will be
obtained. However, in general, most metabolite concentrations have a sufficiently large positive value for the
problem caused by a value close to zero to be avoided.The
metabolite concentration time series slope was calculated
from the reaction stoichiometric matrix and each estimated enzyme reaction rate time series. The metabolite
concentration time series was calculated by numerical
integration of the metabolite concentration slope time
series obtained. The mean relative error (MRE) [23]
between the true values (data) and the calculated values in
the metabolite concentration time series was calculated by
the following equation:
nsamplingpoint nmetabolite
∑
MRE(%) =
i =1
∑
j =1
Cdata,i , j − Cestimated,i , j
Cdata,i , j
nsamplingpoint ⋅ nmetabolite
×100
(4)
where Cdata,i,j is the true concentration of the j-th metabolite at the i-th sampling point, Cestimated,i,j is the estimated
(reproduced) concentration of the j-th metabolite at the iPage 3 of 12
(page number not for citation purposes)
Theoretical Biology and Medical Modelling 2007, 4:19
/>
th sampling point, nmetabolite is the number of metabolites,
and nsampling point is the number of sampling points.
In this study, the MRE between the true metabolite concentration data and the reproduced metabolite concentrations is called the "basal error".
Distinction of dynamic and static enzymes
The genetic algorithm (GA) [24] is employed to search for
an optimal dynamic/static enzyme combination in a metabolic system. In this work, an individual code set for the
GA was defined to represent the dynamic/static enzymes
in a metabolic system. For example, DDSSDD represents
a metabolic system consisting of six enzymes: the 1st, 2nd,
5th, and 6th enzymes for the dynamic module and the 3rd
and 4th enzymes for the static module. In the GA calculation, the enzyme reaction rate time series in the static
module were calculated from enzyme reaction rate time
series in the dynamic module, which were derived from
metabolite concentration time series data, by the same
HDS method. Consequently, each metabolite concentration time series data point was calculated by the same
method as that described in "Evaluation of estimated
internal enzyme reaction rates". The fitness function
defined in Eq. (5) was calculated for each code set; thereafter, propagation, crossover, and mutation followed.
This procedure was repeated until the optimal solution,
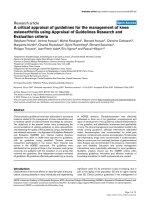
which minimizes Eq. (5), was found. A flowchart of the
process for distinguishing dynamic/static enzymes is
shown in Figure 2.
nsamplingpoint nmetabolite
∑
f =
i =1
2
Cdata,i , j − Cestimated,i , j
Cdata,i , j
nenzyme − nstatic enzyme
j =1
+ w⋅
nsamplingpoint ⋅ nmetabolite
nenzyme
∑
2
(5)
where Cdata,i,j is true concentration of the j-th metabolite at
the i-th sampling point, Cestimated,i,j is estimated concentration of the j-th metabolite at the i-th sampling point, nmetabolite is number of metabolites, nsampling point is number of
sampling points, nenzyme is number of internal enzymes,
nstatic enzyme is number of enzymes included in static module, and w is weighting coefficient.
The first term in the fitness function represents the average
error of the metabolite concentrations. For the fitness
function, for the same reason as in the evaluation of estimated enzyme reaction rates, the metabolite concentrations rather than the enzyme reaction rates themselves
were used. The second term in the fitness function evaluates the ratio of static enzymes included in the metabolic
system; this term was added to adjust the number of
enzymes in the static modules. The second term is multiplied by an adjusting parameter, a weighting coefficient,
Metabolite
concentration
time series
1. Measure metabolite
concentration time series.
2. Calculate metabolite
concentration slopes. Calculate
reaction rates of system
boundary enzymes with known
kinetics.
Metabolite
concentration
slope
time series
System boundary
enzyme
reaction rate
time series
3. Estimate internal enzyme
reaction rate time series.
Estimated
internal enzyme
reaction rate
time series
4. Divide enzymes with
assumed dynamic/static
module determination.
All system boundary enzymes
are regarded as dynamic
enzymes.
Dynamic module
enzyme reaction
rate time series
5. Estimate static enzyme
reaction rate time series by
HDS method with assumed
dynamic/static combination.
8. Modify the assumed
dynamic/static
combination
until the fitness function
is minimized.
Static module
enzyme reaction
rate time series
HDS
method
Estimated static
enzyme reaction
rate time series
6. Calculate metabolite
concentration time series by
numerical integration of
enzyme reaction rate time
series.
Estimated
metabolite
concentration
time series
7. Compare estimated
metabolite concentration
time series with measured
data. Calculate the fitness
function.
Figure 2
basis of metabolome data
Flowchart of distinguishing dynamic/static enzymes on the
Flowchart of distinguishing dynamic/static enzymes
on the basis of metabolome data. Simulation results
from the dynamic models of E. coli and S. cerevisiae were used
as pseudo experimental data to provide the metabolite concentrations required in the first step of the flowchart.
to control the balance between the model error and the
static enzyme ratio.
9 different values of the weighting coefficient (w = 1.000,
0.750, 0.500, 0.250, 0.100, 0.075, 0.050, 0.025, and
0.010) were employed. The results of distinguishing
dynamic and static enzymes were used to construct the
hybrid models.
Error calculation
MRE of the metabolite concentration time series in a
result of the process for distinguishing dynamic/static
enzymes or in a hybrid model was calculated by Eq. (4).
Finally, in the process for distinguishing dynamic/static
enzymes, the "basal error", which originated from the
incompleteness of the estimation of the enzyme reaction
rates and from the error of the numerical integration of
the enzyme reaction rates, rather than from the HDS calculation, was subtracted from the MRE.
Page 4 of 12
(page number not for citation purposes)
Theoretical Biology and Medical Modelling 2007, 4:19
Pseudo experiments
Two microbial central-carbon metabolism models were
chosen for testing: the E. coli model constructed by Chassagnole et al. [20] and the S. cerevisiae model constructed
by Hynne et al. [21]. For the E. coli model, starting from a
steady state for which the extracellular glucose concentration was 5.56 × 10⁻² mM, a glucose pulse was added. The
concentration of the injected glucose pulse was 1.67 mM.
In Chassagnole's original model, time series of nucleotides (ATP/ADP/AMP, NAD(H), NADP(H)) were
expressed by time-dependent functions [20]. However, in
our study, the nucleotide concentrations were fixed as initial values. For the S. cerevisiae model, starting from a
steady state for which the glucose concentration in the
feed solution was 2.50 mM, the glucose concentration was
shifted to 5.00 mM. The metabolite concentrations in
both models at the steady state – that is, the initial concentrations for the dynamic simulations – are shown in Table
S1 (see additional file 1). The running time after perturbation was set to 20 s for the E. coli model and 60 s for the
S. cerevisiae model; these settings were chosen to allow
time for the change from the original steady state to
another steady state after the perturbation. The calculated
metabolite concentration time series data sets were
obtained at intervals of 1 s. These data sets were used as
noise-free pseudo-metabolome data to calculate the
slopes of the metabolite concentrations (C'(t)) and the
reaction rates of the system boundary enzymes (vsystem
boundary(t)) in a performance test of the method. The slopes
of the metabolite concentrations were obtained by firstorder differentiation of the interpolated metabolite concentration time series.
Noise addition to the pseudo-experimental data
To evaluate the practical use of the proposed method, artificial noise was added to each pseudo-experimental
metabolite concentration data point. The coefficient of
variance (CV) was assumed to be 15%, and the standard
deviation (SD) of each pseudo-experimental data point
was calculated by multiplying the CV by the noise-free
value. A normally distributed random number around the
noise-free value was generated for each data point using
the SD obtained. Five noise-added data points were generated for each noise-free data point as pseudo-replicated
measurements. The average of the five noise-added data
points was used in the following smoothing procedure.
Smoothing of noisy pseudo-experimental data
Each noise-added metabolite concentration time series
pseudo data set was smoothed by fitting it to a polynomial or a rational function of time using the least-squares
method.
/>
Calculation tools
MATLAB Release 2006a (MathWorks) was used for all calculations. Ordinary differential equations were solved by
the ODE15s algorithm [25]. For interpolation, differentiation and smoothing of the metabolite concentration
time series data, Curve Fitting Toolbox 1.1.5 (MathWorks) was used. Cubic spline interpolation was
employed. For optimization, the Genetic Algorithm and
Direct Search Toolbox 2.0.1 (MathWorks) was employed.
In each GA calculation, the number of code set was set to
100. The other parameters were set to default values. Each
optimal solution was taken after the fitness function converged to a constant value.
Results
Estimation of enzyme reaction rates using noise-free data
In the HDS method, reaction rates of enzymes in a
dynamic module are used to estimate reaction rates of
enzymes in a static module. If the true reaction rates of all
enzymes in a metabolic system are known, they can be
used directly for discriminating dynamic and static
enzymes. However, the true reaction rates of enzymes in a
cell cannot be determined in most cases. Therefore, we
tried to estimate the reaction rates of enzymes from
metabolite concentrations, which can be experimentally
measured by high-throughput metabolome technologies.
We calculated the estimated reaction rates by using the
metabolite concentration time series obtained from the E.
coli and S. cerevisiae models to evaluate our method of
estimating reaction rates. In this section, the noise-free
pseudo-experimental data were used to obtain a clear
assessment of the estimation method itself. In the true
reaction rate time series of Tkb in E. coli, TA in E. coli, and
AK in S. cerevisiae, some sign-changing points were
observed (Figure S1, see additional file 1). As predicted,
around such points, huge relative errors between the true
enzyme reaction rates and the estimated enzyme reaction
rates were calculated (Figure S1). To avoid the undesired
influence of such huge errors caused by using the reaction
rates themselves, the reproduced metabolite concentrations were employed for the evaluation, as explained in
the Methods. Therefore, the accuracy of the estimated
reaction rates of the internal enzymes was assessed by the
MRE between the original metabolite concentration time
series and the reproduced metabolite concentration time
series (Table 1). In the results for E. coli, the MRE was relatively large, mainly because of the large error in PGP.
Errors in metabolites except for PGP were within approximately 10%; thus the estimation can be considered practically meaningful. For S. cerevisiae, errors of all
metabolites were sufficiently small. On the whole,
enzyme reaction rate time series data can be estimated
from metabolite concentration time series data.
Page 5 of 12
(page number not for citation purposes)
Theoretical Biology and Medical Modelling 2007, 4:19
/>
Table 1: Errors in reproduced metabolite concentrations
obtained by using estimated enzyme reaction rates
convert the full dynamic models for E. coli and S. cerevisiae
to hybrid models. In a process for distinguishing
dynamic/static enzymes – that is, numerical integration of
a given enzyme reaction rate time-series curve – the calculated static enzyme reaction rates at one sampling point
do not affect those calculated at the next sampling point.
In contrast, in the HDS method – that is, the initial value
problem of simultaneous differential equations – the calculated static enzyme reaction rates at one integration step
affect the calculation in the next step. Accordingly, the
error calculated in a process for distinguishing dynamic/
static is not always equal to the error in the hybrid model.
Thus, comparison of errors between these two types of calculations is required.
E. coli
S.cerevisiae
Metabolite
Error (%)
Metabolite
Error (%)
G6P
F6P
FDP
DHAP
GAP
PGP
3PG
2PG
PEP
Pyr
6PG
Ribu5P
Xyl5P
Sed7P
Rib5P
E4P
G1P
5.14 × 10⁻¹
2.79
1.21
2.16
1.95
2.71 × 10²
1.01
5.88
8.27 × 10⁻¹
2.45 × 10⁻¹
2.06
1.04 × 10
8.08
9.06
2.91
7.40
2.82
Glc
G6P
F6P
FDP
DHAP
GAP
PGP
PEP
Pyr
ACA
EtOH
Glyc
ATP
ADP
AMP
NAD
NADH
1.24 × 10⁻¹
6.35 × 10⁻²
6.46 × 10⁻²
2.38 × 10⁻¹
1.25 × 10⁻¹
1.40 × 10⁻¹
3.36
6.88 × 10⁻²
9.45 × 10⁻²
3.91 × 10⁻²
7.73 × 10⁻³
2.11 × 10⁻²
5.67 × 10⁻²
3.36 × 10⁻²
1.28 × 10⁻¹
3.74 × 10⁻²
1.18 × 10⁻¹
MRE
1.94 × 10
MRE
2.77 × 10⁻¹
Distinction of dynamic and static enzymes using noise-free
data
Using enzyme reaction rate time series data, we can apply
the HDS method to calculate the reaction rates of static
enzymes from the reaction rates of dynamic enzymes.
These calculated static enzyme reaction rates can then be
compared with the original reaction rate data. The errors
between the estimated static enzyme reaction rates and
the static enzyme reaction rate data can be used to find an
optimal pattern for distinguishing dynamic from static
enzymes. In this study, a fitness function (Eq. (5)) consisting of two terms was used for the optimization. In Eq. (5),
the second term is multiplied by an adjusting parameter,
a weighting coefficient (w). Even if the same data set is
used, the result for distinguishing dynamic/static enzymes
may vary for different w.
The E. coli and S. cerevisiae models and the estimated reaction rates obtained in the previous section (i.e., calculated
from noise-free metabolite concentration data) were used
to test this method for distinguishing enzymes, and the
optimized patterns of dynamic and static enzymes shown
in Table 2 were obtained as a result. As expected, the proportion of static enzymes decreased with decreasing w.
The dynamic/static enzymes displayed on the metabolic
map are shown in Supplementary Figure S2 (see additional file 1). The results obtained by using the noiseadded metabolite concentration data are shown in the following section.
In the next step, the estimated optimal results for distinguishing dynamic/static enzymes in Table 2 were used to
Figure 3 shows the relationship between the MRE of
metabolite concentrations obtained by processes for distinguishing dynamic/static enzymes and the MRE of
metabolite concentrations in the hybrid models for various weighting coefficients. The errors obtained by these
two methods showed a high positive correlation (r =
0.948). This result indicates that the accuracy of the
hybrid model constructed using the estimated distinguishing of dynamic/static enzymes exactly reflects the
magnitude of the error estimated by processes for distinguishing dynamic/static enzymes. Therefore, the proposed method for distinguishing dynamic/static modules
can be used to build a hybrid model.
The error in the hybrid models was higher than that
obtained by processes for distinguishing dynamic/static
enzymes. In particular, in the distinguishing of dynamic/
static enzymes of S. cerevisiae with w = 0.250, a considerable degree of error enlargement was shown in the hybrid
model. This result can be considered to have been caused
by error propagation at each integration step, as
expected.The relationship between w and the MRE of the
metabolite concentration time series and that between w
and the static enzyme ratio was examined (Figure 4). The
two metabolic systems tested showed very similar results,
perhaps because both models deal with central-carbon
metabolism. The dependency of the MRE and the static
enzyme ratio on w showed a staircase pattern, rather than
a pattern of simple linear increase (or decrease).
Evaluation of the total process using noise-added data
In the previous sections, we used noise-free values to
obtain a clear evaluation of the proposed method itself.
However, real experimental data of metabolite concentrations are generally noisy. For practical use of the proposed
method, the effect of noise on the process for distinguishing dynamic/static enzymes should be evaluated. Thus,
we added noise to the noise-free data and then smoothed
the noisy data for use in distinguishing the dynamic/static
enzymes. In this study, simple smoothing by fitting to a
polynomial or rational function of time was employed.
The smoothing functions that were used and their paramPage 6 of 12
(page number not for citation purposes)
Table 2: Estimated patterns in distinguishing dynamic from static enzymes.
Noise
Fitness (-)
PGI
PFK
ALDO
TIS
GAPDH
PGK
PGluMu
ENO
PK
PGM
G6PDH
PGDH
Ru5P
R5PI
TKa
TKb
TA
1.000
0.750
0.500
0.250
0.100
0.075
0.050
0.025
0.010
-
+
-
+
-
+
-
+
-
+
-
+
-
+
-
+
-
+
7.83 ×
10-1
3.37
7.13 ×
10-1
3.30
6.42 ×
10-1
3.23
5.71 ×
10-1
3.16
5.06 ×
10-1
3.09
4.94 ×
10-1
3.08
4.82 ×
10-1
3.07
4.69 ×
10-1
3.05
4.59 ×
10-1
3.04
S
D
D
S
D
D
D
D
D
S
D
D
S
S
S
S
S
S
D
D
S
D
D
D
D
D
S
D
D
S
S
S
S
S
S
D
D
S
D
D
D
D
D
S
D
D
S
S
S
S
S
S
D
D
S
D
D
D
D
D
S
D
D
S
S
S
S
S
S
D
D
S
D
D
D
D
D
S
D
D
S
S
S
S
S
S
D
D
S
D
D
D
D
D
S
D
D
S
S
S
S
S
S
D
D
S
D
D
D
D
D
S
D
D
S
D
S
D
S
S
D
D
S
D
D
D
D
D
S
D
D
S
S
S
D
S
S
D
D
S
D
D
D
D
D
S
D
D
S
D
S
D
D
S
D
D
S
D
D
D
D
D
S
D
D
S
D
S
D
D
S
D
D
S
D
D
D
D
D
S
D
D
S
D
S
D
D
S
D
D
S
D
D
D
D
D
S
D
D
S
D
S
D
D
S
D
D
S
D
D
D
D
D
S
D
D
S
D
S
D
D
S
D
D
S
D
D
D
D
D
S
D
D
S
D
S
D
D
S
D
D
S
D
D
D
D
D
S
D
D
S
D
S
D
D
D
D
D
S
D
D
D
D
D
D
D
D
S
D
S
D
S
D
D
D
S
D
D
D
D
D
D
D
D
S
D
D
D
D
D
D
D
S
D
D
D
D
D
D
D
D
D
D
S
D
S
S. cerevisiae
Theoretical Biology and Medical Modelling 2007, 4:19
w
Noise
1000
0.750
0.500
0.250
0.100
0.075
0.050
0.025
0.010
-
+
-
+
-
+
-
+
-
+
-
+
-
+
-
+
-
+
3.35 ×
10-1
1.75 ×
101
2.64 ×
10-1
1.75 ×
101
1.94 ×
10-1
1.74 ×
101
1.10 ×
10-1
1.73 ×
101
5.42 ×
10-2
1.73 ×
101
4.17 ×
10-2
1.73 ×
101
4.17 ×
10-2
1.73 ×
101
1.68 ×
10-2
1.72 ×
101
8.02 ×
10-3
1.72 ×
101
PGI
PFK
ALDO
TIS
GAPDH
PGK
PGluMu
ENO
PK
PGM
G6PDH
PGDH
Ru5P
R5PI
TKa
D
D
D
S
D
D
D
D
D
S
D
S
S
S
S
D
D
D
S
D
D
D
S
D
S
D
S
S
S
S
D
D
D
S
D
D
D
D
D
S
D
S
S
S
S
D
D
D
D
D
D
D
S
D
S
D
S
S
S
S
D
D
D
S
D
D
D
D
D
S
D
S
S
S
S
D
D
D
D
D
D
D
S
D
S
D
S
S
S
S
D
D
D
D
D
D
D
D
D
S
D
S
S
S
S
D
D
D
D
D
D
D
S
D
S
D
S
D
S
S
D
D
D
D
D
D
D
D
D
S
D
S
D
S
S
D
D
D
D
D
D
D
S
D
S
D
S
D
S
S
D
D
D
D
D
D
D
D
D
S
D
S
D
S
S
D
D
D
D
D
D
D
S
D
S
D
S
D
S
S
D
D
D
D
D
D
D
D
D
S
D
S
D
S
S
D
D
D
D
D
D
D
S
D
S
D
S
D
S
S
D
D
D
D
D
D
D
D
D
S
D
S
D
S
S
D
D
D
D
D
D
D
S
D
S
D
S
D
S
S
D
D
D
D
D
D
D
D
D
D
D
S
D
D
S
D
D
D
D
D
D
D
S
D
S
D
S
D
D
S
TKb
TA
S
S
S
S
S
S
S
S
S
S
S
S
S
S
S
S
D
S
S
S
D
S
S
S
D
S
S
D
D
S
S
D
D
D
S
D
Fitness (-)
w is the weighting coefficient in the fitness function (Eq. (5)), and the symbols D and S denote enzymes in the dynamic and static modules, respectively. The system boundary enzymes were omitted from the
table because all system boundary enzymes were represented as dynamic enzymes.
Page 7 of 12
w
(page number not for citation purposes)
/>
E. coli
Theoretical Biology and Medical Modelling 2007, 4:19
/>
MRE of metabolite concentrations
in hybrid model (%)
25
E. coli
S. cerevisiae
r = 0.948
20
0.250
1.000
0.750
0.500
15
0.100
0.075
0.050
0.025
10
5
0.010
1.000
0.750
0.500
0.250
0.100
0.075
0.050
0.025
0.010
0
0
5
10
15
MRE of metabolite concentrations
in dynamic/static distinction (%)
Figure 3
hybrid models
processes for distinguishing dynamic/static enzymes and
Relationship of MRE of metabolite concentrations between
Relationship of MRE of metabolite concentrations
between processes for distinguishing dynamic/static
enzymes and hybrid models. The MRE s of the processes
for distinguishing dynamic/static enzymes are the values after
subtraction of the basal error (MRE shown in Table 1). Numbers next to the symbols represent weighting coefficients.
MRE (E. coli )
MRE (S. cerevisiae )
Static enzyme ratio (E. coli )
0
Static enzyme ratio (S. cerevisiae )
20
10
15
20
10
30
5
40
0
0.001
50
0.01
0.1
1
10
Weighting coefficient for second term of
fitness function (-)
Figure ratio
enzyme 4
Relationships between w and MRE and w and the static
Relationships between w and MRE and w and the static
enzyme ratio.
Static enzyme ratio (%)
MRE of metabolite concentration
time series in hybrid model (%)
25
eters are shown in Supplementary Tables S2 and S3 (see
additional file 1). Comparisons of noise-free values,
noise-added values, and smoothed curves of metabolites
are shown in Supplementary Figure S3 (see additional file
1). The results of distinguishing dynamic/static enzymes
from the noisy metabolite concentration data are shown
in Table 2. In most cases, when noise-added data were
used, entirely or almost the same distinctions between
dynamic/static enzymes were obtained as when noise-free
data were used. However, in the results for S. cerevisiae
obtained using smoothed noisy data, when w < 0.250, the
number of static enzymes tended to be larger than in the
results obtained using noise-free data. In the results for E.
coli, the same tendency was observed when w = 0.010.
Because the smoothing process of the metabolite concentration time series might result in loss of the high-frequency component of the time series data, the smoothed
data might apparently change more slowly than is actually
the case. Thus, when smoothed noisy data are used, the
number of required dynamic enzymes in a HDS model
tends to be smaller than the number needed when noisefree data are used. Because more precise metabolite concentrations need to be calculated when w is small, this tendency might be enhanced.
Discussion
Estimation of enzyme reaction rates
As shown in Table 1, the accuracy of the estimations of the
enzyme reaction rates was confirmed by the reproduced
metabolite concentrations, except for PGP in E. coli. Since
the concentration of PGP was very low (average concentration, 3.60 × 10⁻³ mM), even a slight error in the enzyme
reaction rate had a large influence. In fact, the average
errors between the true enzyme reaction rate time series
and the estimated enzyme reaction rate time series for
both GAPDH (PGP-producing enzyme) and PGK (PGPconsuming enzyme) in E. coli were adequately small,
2.44% and 1.46%, respectively. In the process for distinguishing dynamic/static enzymes, the average of the
squared errors of all metabolite concentrations is used to
calculate the fitness function (Eq. (5)); thus, an error in
only one metabolite concentration has a limited effect.
Actually, the results of distinguishing dynamic/static
enzymes without the PGP time series (data not shown)
were entirely the same as those shown in Table 2. However, if many metabolites with low concentrations are
included in the modelled metabolic system, the processes
for distinguishing dynamic/static enzymes may cause an
erroneous conclusion to be drawn. This is a limitation of
the current procedure. In comparison with the results for
E. coli, errors for all metabolites for S. cerevisiae were adequately small, because the dynamics of the metabolic system in S. cerevisiae is relatively slow compared with the
sampling frequency.
Page 8 of 12
(page number not for citation purposes)
Theoretical Biology and Medical Modelling 2007, 4:19
Another difficulty in applying the proposed method is
that we assume that the concentrations of all metabolites
are measurable. It is expected that high-throughput measurement techniques for detecting a huge number of
metabolites, such as capillary electrophoresis combined
with mass spectrometry (CE-MS) [17-19], can be used for
such comprehensive measurements. The 1-s sampling
interval employed in this study is feasible, because some
rapid-sampling instruments capable of drawing multiple
samples within 1 s from a bioreactor have already been
developed [26-28].
Distinction of dynamic and static enzymes
After a process for distinguishing dynamic/static enzymes
is completed, the MRE in the corresponding hybrid model
can be estimated using the linear relationship between the
MRE in the process for distinguishing dynamic/static
enzymes and the MRE in the hybrid model (Figure 3).
This information helps to build a hybrid model that has
the desired accuracy.
The staircase pattern of the relationships between the
error and static enzyme ratio with decreasing w, observed
in Figure 4, was probably caused by a property of metabolic systems. In a testing system, the number of enzymes
that can potentially be allocated to the static module may
be restricted. If w is greatly changed, the few potentially
static enzymes would eventually start to be converted to
static enzymes.
Weighting coefficient in the fitness function
The weighting coefficient in the fitness function (Eq. (5))
is a tuning parameter. Since a suitable value for the
weighting coefficient (w) is not given a priori, we need to
consider how to define the value.
As shown in Figure 4, with a w of 1.000, about half of the
enzymes were discriminated to the static module. Thus, a
large amount of experimental work can be saved because
no kinetic information is required by the static module.
The MRE at w = 1.000 was 15.2% for the E. coli hybrid
model and 18.6% for the S. cerevisiae hybrid model (Figure 4). These errors are acceptable considering the accuracy of the experimentally measured metabolite
concentrations. Thus, w = 1.000 may simply be chosen at
the initial trial stage of model construction. When a more
precise model is required, a smaller w can be used. Even if
w is set to between 0.025 and 0.100, the proportion of
static enzymes remains at about 30% for both the metabolic systems tested. Our recommendation for w for general modelling is 0.050. At around this w value, the
sensitivity of the error to a change of w is low; thus, strict
specification of w is not required. Moreover, even if the
actual error in the constructed hybrid model becomes
considerably higher than the expected value – as in the
/>
case of S. cerevisiae at w = 0.250 –the actual error remains
low.
Noise in metabolome data
As shown in Table 2, almost the same results in distinguishing dynamic/static enzymes were obtained between
the procedures using noise-free data and those using
noise-added data. This result could be predicted because
most metabolite time series were successfully reproduced
from the noisy data by the smoothing treatment, as
shown in Figure S3. This result indicates that the proposed
method for distinguishing dynamic/static enzymes can be
applied to noisy measurements if a suitable noise reduction method is employed. To remove noise and obtain the
slopes of metabolite concentration time series, a smoothing technique based on an artificial neural network, proposed by Voit et al. [29-31], is efficient. Many other noise
cancellation techniques have been proposed for biochemical time series data [32-35]. For example, Rizzi et al. [36]
obtained time-course functions of metabolites from noisy
metabolite concentration measurements and used those
functions to tune the parameters in their dynamic model.
Toward construction of accurate hybrid models
In the HDS method, accurate kinetics should be known
not only for system boundary enzymes but also for all
enzymes assigned to the dynamic modules. For this reason, high-throughput techniques for determining accurate and detailed enzyme kinetics are needed for the
efficient development of models of metabolic systems. A
promising power-law approach, generalized mass action
(GMA) [37,38], may be used to solve this problem. This
method has a large representational space that enables
enzyme kinetics to be sufficiently expressed in spite of its
simple fixed form. Although modelling that uses this kind
of power-law approach from time series data is often difficult owing to their nonlinear properties, Polisetty et al.
[39] have proposed a method employing branch-andbound principles to find optimized parameters in GMA
models. Using this method, the global optimal parameter
set can be efficiently searched.
To ensure the validity of the predicting performance of an
HDS model, careful perturbation experiments should be
carried out to obtain the metabolome time series data to
be used for distinguishing dynamic/static enzymes. The
metabolite concentration variations used should be those
considered to be of the maximum possible magnitude
under the modelled conditions. To reproduce a rapidly
changing metabolite concentration time series by an HDS
model, a larger number of dynamic enzymes is required.
Thus, if the number of dynamic enzymes included in the
model is defined by using data showing the maximum
possible variation in magnitude, that is, the model is constructed with the maximum possible number of dynamic
Page 9 of 12
(page number not for citation purposes)
Theoretical Biology and Medical Modelling 2007, 4:19
/>
enzymes, then the model can calculate all probable states
of the system. For instance, consider building a metabolic
model of cultured cells in a reactor, where the model has
no mechanism for calculating gene expression levels or
the consequent changes in protein concentrations (most
proposed metabolic models are of this type). A substratepulse injection experiment giving the maximal substrate
concentration that does not cause changes in gene expression levels in the cells (i.e., enzyme concentrations in the
cells are kept constant) is useful for distinguishing
dynamic/static enzymes. To determine the maximal permitted substrate concentration, many preliminary experiments may be required, and this seems to decrease the
value of the HDS method, which aims to reduce experimental efforts. However, fundamentally speaking, such
evaluation of the limits of a model's parameters is absolutely necessary for maintaining the accuracy of calculations in any kind of modelling, not only in HDS
modelling. Therefore, this requirement for experiments to
determine the maximal possible variation is not a specific
disadvantage of the HDS method.
ACAx acetaldehyde, extracellular
Conclusion
GAP glyceraldehyde 3-phosphate
The proposed method of using metabolite concentration
time series,i.e., experimentally measurable variables, enables us to discriminate dynamic/static enzymes to construct a hybrid model. In this method, the enzyme
reaction rate time series are estimated from metabolite
concentration time series data. Since this estimation relies
on only the mass balance in the system, no kinetic information about internal enzymes is required. Therefore, the
aim of employing the HDS method – to reduce the experimental effort required to obtain enzyme kinetics information – can be achieved. Two microbial central-carbon
metabolism models were used to evaluate our method.
Central-carbon metabolism has many feedback loops and
is rigidly controlled to maintain homeostasis of a living
cell. Since our method was successfully applied for such a
strictly regulated system, we believe it will have wide-ranging applicability to many types of metabolic systems. Furthermore, the analysis using noisy metabolite
concentration data demonstrated that, for the most part,
the proposed method tolerates noise well.
Abbreviations
CNo cyanide, mixed flow
CNx cyanide, extracellular
DHAP dihydroxyacetone phosphate
E4P erythrose 4-phosphate
EtOH ethanol, intracellular
EtOHx ethanol, extracellular
F6P fructose 6-phosphate
FDP fructose 1,6-bisphosphate
G1P glucose 1-phosphate
G6P glucose 6-phosphate
Glco glucose, mixed flow
Glcx glucose, extracellular
Glyc glycerol, intracellular
Glycx glycerol, extracellular
PEP phosphoenolpyruvate
PGP 1,3-bisphosphoglycerate
Pyr pyruvate
Rib5P ribose 5-phosphate
Ribu5P ribulose 5-phosphate
Sed7P sedoheptulose 7-phosphate
Xyl5P xylulose 5-phosphate
Metabolites
Enzymes/reactions
2PG 2-phosphoglycerate
ADH acetaldehyde dehydrogenase
3PG 3-phosphoglycerate
AK adenylate kinase
6PG 6-phosphogluconate
ALDO aldolase
ACA acetaldehyde, intracellular
consum ATP consumption
Page 10 of 12
(page number not for citation purposes)
Theoretical Biology and Medical Modelling 2007, 4:19
difACA diffusion of acetaldehyde
/>
difEtOH diffusion of EtOH
ideas and directed the project, and MT was the project
leader. All authors read and approved the final manuscript.
difGlyc diffusion of glycerol
Additional material
ENO enolase
Additional file 1
Supplementary information for "Distinguishing enzymes using metabolome data for the hybrid dynamic/static method". An example of the estimation of internal enzyme reaction rates (supplementary text),
supplementary tables for conditions of simulation and smoothing (Table
S1, Table S2, and Table S3) and supplementary figures of results (Figure
S1, Figure S2 and Figure S3).
Click here for file
[ />
G6PDH glucose-6-phosphate dehydrogenase
GAPDH glyceraldehyde-3-phosphate dehydrogenase
GlcTrans glucose transporter
HK hexokinase
lpGlyc lumped glycerol formation reaction
lpPEP lumped PEP formation reaction
Acknowledgements
PGI glucose-6-phosphate isomerase
The authors would like to thank Katsuyuki Yugi, Ayako Kinoshita and
Yoshihiro Toya for insightful discussions. This work was supported in part
by a grant from CREST, JST; a grant from New Energy and Industrial Technology Development and Organization (NEDO) of the Ministry of Economy, Trade and Industry of Japan (Development of a Technological
Infrastructure for Industrial Bioprocess Project); and a grant-in-aid from the
Ministry of Education, Culture, Sports, Science and Technology for the 21st
Century Center of Excellence (COE) Program (Understanding and Control
of Life's Function via Systems Biology).
PGK phosphoglycerate kinase
References
PDC pyruvate decarboxylase
PFK phosphofructokinase
PGDH 6-phosphogluconate dehydrogenase
1.
PGluMu phosphoglycerate mutase
PGM phosphoglucomutase
PK pyruvate kinase
2.
3.
4.
R5PI ribose-phosphate isomerase
5.
Ru5P ribulose-phosphate epimerase
6.
TA transaldolase
TIS triosephosphate isomerase
7.
8.
TKa transketolase, reaction a
TKb transketolase, reaction b
9.
Competing interests
The author(s) declare that they have no competing interests.
Authors' contributions
NI contributed to the development of the proposed
method and wrote this manuscript. YN provided the basic
10.
11.
van der Werf MJ, Jellema RH, Hankemeier T: Microbial metabolomics: replacing trial-and-error by the unbiased selection
and ranking of targets.
J Ind Microbiol Biotechnol 2005,
32(6):234-252.
Ishii N, Soga T, Nishioka T, Tomita M: Metabolome analysis and
metabolic simulation. Metabolomics 2005, 1(1):29-37.
Patton WF: Detection technologies in proteome analysis. J
Chromatogr B Analyt Technol Biomed Life Sci 2002, 771(1-2):3-31.
Bertone P, Snyder M: Advances in functional protein microarray technology. Febs J 2005, 272(21):5400-5411.
Leung YF, Cavalieri D: Fundamentals of cDNA microarray data
analysis. Trends Genet 2003, 19(11):649-659.
Johnson JM, Edwards S, Shoemaker D, Schadt EE: Dark matter in
the genome: evidence of widespread transcription detected
by microarray tiling experiments.
Trends Genet 2005,
21(2):93-102.
Schomburg I, Chang A, Schomburg D: BRENDA, enzyme data
and metabolic information. Nucleic Acids Res 2002, 30(1):47-49.
Sundararaj S, Guo A, Habibi-Nazhad B, Rouani M, Stothard P, Ellison
M, Wishart DS: The CyberCell Database (CCDB): a comprehensive, self-updating, relational database to coordinate and
facilitate in silico modeling of Escherichia coli. Nucleic Acids Res
2004, 32(Database issue):D293-5.
Selkov E, Basmanova S, Gaasterland T, Goryanin I, Gretchkin Y, Maltsev N, Nenashev V, Overbeek R, Panyushkina E, Pronevitch L, Selkov
E Jr., Yunus I: The metabolic pathway collection from EMP:
the enzymes and metabolic pathways database. Nucleic Acids
Res 1996, 24(1):26-28.
Yugi K, Nakayama Y, Kinoshita A, Tomita M: Hybrid dynamic/
static method for large-scale simulation of metabolism.
Theor Biol Med Model 2005, 2(1):42.
Shimizu K: Metabolic flux analysis based on 13C-labeling
experiments and integration of the information with gene
and protein expression patterns. Adv Biochem Eng Biotechnol
2004, 91:1-49.
Page 11 of 12
(page number not for citation purposes)
Theoretical Biology and Medical Modelling 2007, 4:19
12.
13.
14.
15.
16.
17.
18.
19.
20.
21.
22.
23.
24.
25.
26.
27.
28.
29.
30.
31.
32.
33.
34.
35.
36.
Aiba S, Matsuoka M: Identification of metabolic model: Citrate
production from glucose by Candida lipolytica. Biotechnol Bioeng 1979, 21(8):1373-1386.
Okino MS, Mavrovouniotis ML: Simplification of mathematical
models of chemical reaction systems. Chem Rev 1998,
98(2):391-408.
Gerdtzen ZP, Daoutidis P, Hu WS: Non-linear reduction for
kinetic models of metabolic reaction networks. Metab Eng
2004, 6(2):140-154.
Moore EH: On the reciprocals of the general algebraic matrix.
Bull American Math Soc 1920, 26:394-395.
Penrose R: A generalized inverse for matrices. Proc Cambridge
Philos Soc 1955, 51(406-413):.
Fiehn O, Kopka J, Dormann P, Altmann T, Trethewey RN, Willmitzer
L: Metabolite profiling for plant functional genomics. Nat Biotechnol 2000, 18(11):1157-1161.
Soga T, Ueno Y, Naraoka H, Matsuda K, Tomita M, Nishioka T: Pressure-assisted capillary electrophoresis electrospray ionization mass spectrometry for analysis of multivalent anions.
Anal Chem 2002, 74(24):6224-6229.
Soga T, Ohashi Y, Ueno Y, Naraoka H, Tomita M, Nishioka T: Quantitative metabolome analysis using capillary electrophoresis
mass spectrometry. J Proteome Res 2003, 2(5):488-494.
Chassagnole C, Noisommit-Rizzi N, Schmid JW, Mauch K, Reuss M:
Dynamic modeling of the central carbon metabolism of
Escherichia coli. Biotechnol Bioeng 2002, 79(1):53-73.
Hynne F, Dano S, Sorensen PG: Full-scale model of glycolysis in
Saccharomyces cerevisiae. Biophys Chem 2001, 94(1-2):121-163.
Delgado JP, Liao JC: Identifying rate-controlling enzymes in
metabolic pathways without kinetic parameters. Biotechnol
Prog 1991, 7(1):15-20.
Kitayama T, Kinoshita A, Sugimoto M, Nakayama Y, Tomita M: A
simplified method for power-law modelling of metabolic
pathways from time-course data and steady-state flux profiles. Theor Biol Med Model 2006, 3(1):24.
Willett P: Genetic algorithms in molecular recognition and
design. Trends Biotechnol 1995, 13(12):516-521.
Shampine LF, Reichelt MW: The MATLAB ODE Suite. SIAM J Scientific Comp 1997, 18:1-22.
Schaefer U, Boos W, Takors R, Weuster-Botz D: Automated sampling device for monitoring intracellular metabolite dynamics. Anal Biochem 1999, 270(1):88-96.
Buziol S, Bashir I, Baumeister A, Claassen W, Noisommit-Rizzi N,
Mailinger W, Reuss M: New bioreactor-coupled rapid stoppedflow sampling technique for measurements of metabolite
dynamics on a subsecond time scale. Biotechnol Bioeng 2002,
80(6):632-636.
Hoque MA, Ushiyama H, Tomita M, Shimizu K: Dynamic responses
of the intracellular metabolite concentrations of the wild
type and pykA mutant Escherichia coli against pulse addition
of glucose or NH3 under those limiting continuous cultures.
Biochem Eng J 2005, 26(1):38-49.
Voit EO, Almeida J: Decoupling dynamical systems for pathway
identification from metabolic profiles. Bioinformatics 2004,
20(11):1670-1681.
Marino S, Voit EO: An automated procedure for the extraction
of metabolic network information from time series data. J
Bioinform Comput Biol 2006, 4(3):665-691.
Chou IC, Martens H, Voit EO: Parameter estimation in biochemical systems models with alternating regression. Theor
Biol Med Model 2006, 3:25.
Wood GA: Data smoothing and differentiation procedures in
biomechanics. Exerc Sport Sci Rev 1982, 10:308-362.
Gazzani F: Comparative assessment of some algorithms for
differentiating noisy biomechanical data. Int J Biomed Comput
1994, 37(1):57-76.
Eilers PH: A perfect smoother.
Anal Chem 2003,
75(14):3631-3636.
Tsai KY, Wang FS: Evolutionary optimization with data collocation for reverse engineering of biological networks. Bioinformatics 2005, 21(7):1180-1188.
Rizzi M, Baltes M, Theobald U, Reuss M: In vivo analysis of metabolic dynamics in Saccharomyces cerevisiae. II. Mathematical model. Biotechnol Bioeng 1997, 55(4):592-608.
/>
37.
38.
39.
Voit EO, Ferreira AEN: Computational analysis of biochemical
systems: a practical guide for biochemists and molecular
biologists. Cambridge, NY , Cambridge University Press; 2000.
Torres NV, Voit EO: Pathway analysis and optimization in metabolic engineering. Cambridge, NY , Cambridge University Press;
2002.
Polisetty PK, Voit EO, Gatzke EP: Identification of metabolic system parameters using global optimization methods. Theor
Biol Med Model 2006, 3:4.
Publish with Bio Med Central and every
scientist can read your work free of charge
"BioMed Central will be the most significant development for
disseminating the results of biomedical researc h in our lifetime."
Sir Paul Nurse, Cancer Research UK
Your research papers will be:
available free of charge to the entire biomedical community
peer reviewed and published immediately upon acceptance
cited in PubMed and archived on PubMed Central
yours — you keep the copyright
BioMedcentral
Submit your manuscript here:
/>
Page 12 of 12
(page number not for citation purposes)