Báo cáo y học: "A continuum mathematical model of endothelial layer maintenance and senescence" ppsx
Bạn đang xem bản rút gọn của tài liệu. Xem và tải ngay bản đầy đủ của tài liệu tại đây (668.25 KB, 10 trang )
BioMed Central
Page 1 of 10
(page number not for citation purposes)
Theoretical Biology and Medical
Modelling
Open Access
Research
A continuum mathematical model of endothelial layer
maintenance and senescence
Ying Wang, Baltazar D Aguda and Avner Friedman*
Address: Mathematical Biosciences Institute, and Department of Mathematics, The Ohio State University Columbus, Ohio 43210, USA
Email: Ying Wang - ; Baltazar D Aguda - ; Avner Friedman* -
* Corresponding author
Abstract
Background: The monolayer of endothelial cells (ECs) lining the inner wall of blood vessels
deteriorates as a person ages due to a complex interplay of a variety of causes including cell death
arising from shear stress of blood flow and cellular oxidative stress, cellular senescence, and
decreased rate of replacement of dead ECs by progenitor stem cells.
Results: A continuum mathematical model is developed to describe the dynamics of large EC
populations of the endothelium using a system of differential equations for the number densities of
cells of different generations starting from endothelial progenitors to senescent cells, as well as the
densities of dead cells and the holes created upon clearing dead cells. Aging of cells is manifested
in three ways, namely, losing the ability to divide when the Hayflick limit of 50 generations is
reached, decreasing replication rate parameters and increasing death rate parameters as cells
divide; due to the dependence of these rate parameters on cell generation, the model predicts a
narrow distribution of cell densities peaking at a particular cell generation. As the chronological age
of a person advances, the peak of the distribution – corresponding to the age of the endothelium
– moves towards senescence correspondingly. However, computer simulations also demonstrate
that sustained and enhanced stem cell homing can halt the aging process of the endothelium by
maintaining a stationary cell density distribution that peaks well before the Hayflick limit. The
healing rates of damaged endothelia for young, middle-aged, and old persons are compared and are
found to be particularly sensitive to the stem cell homing parameter.
Conclusion: The proposed model describes the aging of the endothelium as being driven by
cellular senescence, with a rate that does not necessarily correspond to the chronological aging of
a person. It is shown that the age of the endothelium depends sensitively on the homing rates of
EC progenitor cells.
Background
Endothelial cells (EC) form a monolayer called the
endothelium which lines the inner wall of blood vessels
in the entire circulatory system, from small capillaries to
the heart. The endothelium is involved in controlling the
passage of materials between tissues and the bloodstream,
and its maintenance is of such paramount importance
that a blood clotting mechanism – highly conserved in
evolution – is immediately elicited when an injury or
wound occurs, to plug the damage and stop blood loss
(too large a clot, unfortunately, can lead to myocardial
infarction or stroke). However, as a person ages many vas-
Published: 10 August 2007
Theoretical Biology and Medical Modelling 2007, 4:30 doi:10.1186/1742-4682-4-30
Received: 25 June 2007
Accepted: 10 August 2007
This article is available from: />© 2007 Wang et al; licensee BioMed Central Ltd.
This is an Open Access article distributed under the terms of the Creative Commons Attribution License ( />),
which permits unrestricted use, distribution, and reproduction in any medium, provided the original work is properly cited.
Theoretical Biology and Medical Modelling 2007, 4:30 />Page 2 of 10
(page number not for citation purposes)
cular diseases occur due to a variety of causes, including
cellular oxidative stress and shear stress of blood flow that
induce death of ECs [1-5]. In addition, cellular senescence
or aging slows down the replication rates of ECs and, con-
sequently, the rate of repairing endothelium damage. One
of the primary causes of cellular aging is the progressive
shortening of the ends of chromosomes (telomeres) as
cells divide; upon reaching some critical telomere lengths,
cells become senescent and lose the ability to proliferate
([6] and the references therein). On the other hand, bone
marrow-derived endothelial progenitor cells (EPCs) circu-
lating in the bloodstream can home to holes on the
endothelium and differentiate into ECs to provide
younger cells [3-8].
In a recent work, Op den Buijs et al. [6] presented a model
of endothelium maintenance that incorporates the above-
mentioned factors. The endothelial wall was modeled as a
monolayer of ECs on a square sheet. Computer simula-
tions based on Monte Carlo type [6] approach were car-
ried out involving 500 ECs covering an area of 3.5 × 10
5
μ
m
2
(the cell radius was taken to be 15
μ
m). The model
monitored the changes of the EC monolayer over a period
of 60 years, with a discrete time step of 1 year. Dead ECs
could be replaced either by division of surrounding ECs or
by homing of EPCs according to certain probabilities that
are based on experimental evidence. The cells that die are
chosen at random at each time step, and when the dead
cells are to be replaced by cell division, non-senescent
neighboring cells were randomly chosen to divide. It was
assumed that the rates of EPC production from the bone
marrow and EPC homing are such that there is a steady
state number of EPCs in the blood. EPCs that have homed
are considered to convert instantly to fully differentiated
ECs.
The small number of ECs considered in the computer sim-
ulations of Op den Buijs et al. [6] does not allow one to
generalize the simulation to larger areas of the vascula-
ture, where hundreds of thousands of ECs are involved. It
is of interest to know how the various factors considered
in the model of Op den Buijs et al. [6] play out in a large
population of ECs, because this information will then
allow a correlation of the aging of the organism to the
aging of the EC wall. The aim of the present paper is to
develop a continuum mathematical model of the EC
layer, incorporating maintenance and damaging factors
mentioned above. Unlike the discrete model of Op den
Buijs et al. [6] the model described in this paper is deter-
ministic. More precisely, the model consists of a dynami-
cal system which describes how densities of EC at
different stages of telomere length evolve in time; this evo-
lution is defined by a system of partial differential equa-
tions (PDEs).
Results and discussion
Model equations
Let m
i
(x, y, t) be the number density of cells of generation
identified by an index i that counts the number of mitotic
divisions until senescence is reached. The number of cells
of generation i at time t in the area bounded by x and x +
dx, and y and y + dy is defined to be m
i
(x, y, t)dxdy. For via-
ble cells the index i ranges from 0 (for the EPCs that have
homed on the endothelial wall) to N (for senescent cells).
We take N = 50 in our simulations (the typical Hayflick
limit of human cells). To account for the space created
when dead cells are cleared, we introduce the variable
called 'hole density', h(x, y, t), and define it to be identical
to the number density of dead cells before they are
cleared.
An important feature of our model is the representation of
the observation that a normal EC in contact with other
ECs on all sides do not divide (see [6]), and only non-
senescent cells that border holes can proliferate. The fol-
lowing rate expression is therefore assumed:
rate of cell division =
λ
i
m
i
h for 0 ≤ i ≤ N - 1 (1)
The proliferation parameter
λ
i
depends on i and is
expected to decrease with i (this dependence is discussed
in the next section) – that is, it becomes harder for cells to
proliferate as they get older. Also, every viable cell has a
probability of dying which we assume to occur at the rate
k
i
m
i
for 0 ≤ i ≤ N. As with
λ
i
, the death parameter k
i
depends on i but is expected to increase with i (this
dependence is discussed in the next section). In the equa-
tions below, we only consider the case where viable ECs
and EPCs that have homed on the wall do not undergo
surface migration – either by diffusion or by transport –
on the endothelial wall.
The number density of EPCs evolves according to the fol-
lowing equation
where the first term on the right-hand side is the rate of
EPC homing to the wall, and is assumed to be directly pro-
portional to the local hole density; the second term is the
rate of cell division, and the last term is the rate of cell
death. For the other non-senescent ECs, their number
densities change according to
∂
∂
m
t
hmhkm
0
00 00
=− −
γλ
(2)
∂
∂
m
t
mh mhkm iN
i
i i ii ii
=−−≤≤−
−−
21
11
λλ
(1 )
(3)
Theoretical Biology and Medical Modelling 2007, 4:30 />Page 3 of 10
(page number not for citation purposes)
where the first term is the division rate of cells in the pre-
ceding generation, and the last two terms are division and
death rates as defined previously.
Since senescent cells do not divide, their evolution equa-
tion contains only one source term and a death term, as
given below:
The number density of dead cells, q, is assumed to follow
the equation
The second term on the right-hand side accounts for the
death of all viable cells, and the last term is the rate of
clearing dead cells from the endothelial wall. The first
term on the right-hand side takes into account that dead
cells – prior to being cleared – become loosely attached to
the endothelial wall and can diffuse laterally. Note that
because of cell-cell adhesion among ECs, no diffusion
terms are included in Eqs. (2)–(3). Finally, hole density
varies according to
where the source term is due to clearing of dead cells, the
second term represents homing of EPCs, and the last term
corresponds to filling up holes due to divisions of non-
senescent cells adjacent to holes.
In all the simulations presented in this paper, we consid-
ered a square R of 1 cm
2
area on the endothelial wall
R = {(x, y)|0 ≤ x ≤ 1, 0 ≤ y ≤ 1}
The following set of periodic boundary conditions on the
number density of dead cells is assumed:
On a macroscopic scale (which is the view taken in all our
simulations), it will be assumed that the ECs and holes are
initially distributed so that the total number density is the
same at every point, that is,
By dividing both sides of Eq. (8) by A, we transform the
densities into dimensionless variables. Note that from
hereon, h, q, and m
i
(i = 1, , N) refer to the dimensionless
number densities and that A in Eq. (8) is set to 1.
After summing Eqs. (2)–(6), we get
and using the divergence theorem with Eq. (7),
(where
∂
R is the boundary of R and n is the vector normal
to
∂
R); these equations then imply that
Since one EC covers an area of the order of 300 square
microns, A is in the order of 0.3 × 10
6
cells per cm
2
area.
In our simulations, we scale all the densities such that the
constant A is set to 1. Note that if h(x, y, 0), q(x, y, 0) and
m
i
(x, y, 0) (i = 1, , N) are all constants, then the system
(2)–(6) becomes a system of ordinary differential equa-
tions.
Table 1 is a summary of the parameters used in the com-
puter simulations. The estimation of these parameters is
discussed under the section Methods. Figure 1(a) shows
the assumed dependence of the rate coefficients for cell
replication and death.
Cell generation profiles and aging of the endothelium
In this section we take h(x, y, 0), q(x, y, 0) and m
i
(x, y, 0)
(i = 1, , N) to be constants – that is, these dimensionless
number densities are homogeneous in space. We refer to
the distribution G(t) = {m
i
(t)} as the 'cell generation pro-
file' of the endothelium at time t. It is assumed that, on
average, the endothelium of an individual at any age is
composed of a distribution G of finite spread. Interest-
ingly, due to the dependence of the cell division and death
rate constants (
λ
i
and k
i
) on cell generation i (see Fig. 1a),
our model spontaneously generates G(t) profiles that look
like Gaussian distributions (see Fig. 2) – that is, even an
initially flat distribution eventually becomes Gaussian-
like given enough time, as shown in Fig. 1b (an initial flat
distribution was merely used for numerical reasons and
does not represent any biological condition). In our sim-
ulations, the chronological age of an individual is meas-
ured by the independent variable t in the dynamical Eqs.
(2)–(6). If we take the peak of the distribution G as a
∂
∂
m
t
mhkm
N
NN NN
=−
−−
2
11
λ
(4)
∂
∂
q
t
Dq km q
i
i
N
i
=∇ + −
=
∑
2
0
δ
(5)
∂
∂
h
t
qh mh
i
i
N
i
=−−
=
−
∑
δγ λ
0
1
(6)
qyt qyt qyt qyt
qx t qx t q
(, ,) (, ,) (, ,) (, ,)
(,,) (,,) (
01 0 1
01
=∇=∇
=∇
,
, xxt qxt,,) (,,)01=∇
(7)
hxy qxy m xy A
i
i
N
(,,) (,,) (,,)00 0
0
++ =
=
∑
constant,
(8)
∂
∂
++ =∇
=
∑
t
hq m D q
i
i
N
()
0
2
∇=∇⋅=
∫∫ ∫
∂
2
0qdxdy q dS
RR
()n
()hq mdxdy A t
i
i
N
R
++ = >
=
∑
∫∫
0
0constant, for all
(9)
Theoretical Biology and Medical Modelling 2007, 4:30 />Page 4 of 10
(page number not for citation purposes)
measure of the endothelium's age, the model simulations
presented below demonstrate that the endothelium does
not have to age at the same rate as the individual's chron-
ological age. We investigated the progression of G(t) from
t = 20 years to t = 80 years – that is, the aging of the
endothelium of a 20-year old person in 60 years. Cur-
rently, there are no published measurements that permit
us to correlate an individual's chronological age to the cell
generation index i* where G peaks; for our initial condi-
tion, we arbitrarily assumed that a 20-year old has a G that
peaks at i* = 6 (see leftmost curve in Fig. 2).
Because the initial conditions h(x, y, 0), q(x, y, 0) and m
i
(x,
y, 0) (i = 0, 1, , N) are constants, the simulations shown
in Fig. 2 are the solutions of the system of ordinary differ-
ential Eqs. (2)–(5). Since cells divide only if they are adja-
cent to a hole (see Eq. (1)), h(x, y, 0) must be nonzero for
G(t) to evolve in time; we call h(x, y, 0) (also symbolized
by h
0
) the background hole density that is always present
and drives the normal aging process. As shown in Fig.
2(a), G moves toward senescence at variable rates: initially
slow from 20 to 50 years, followed by higher rates for a
few decades, and then a final slowing down towards a sta-
tionary profile (the overlapping peaks at i* = 36). Note
that G broadens as i* increases. The total number of cells,
, is monitored during all the simulations;
the total remains approximately constant until about age
50, when a slow rate of decline begins. At the advanced
age of 80 years, a significant rise in the number of dead
cells is observed.
The speed by which G moves towards senescence depends
sensitively on the value of the EPC homing parameter
γ
.
This parameter was varied between 0 and 1, and we found
that G(t) becomes slower if
γ
is increased, and faster if
γ
is
decreased. For
γ
= 10
-9
, the results are very similar to those
of Fig. 2(a). For large values of
γ
(>10
-7
), some interesting
results can be observed. When
γ
= 10
-5
, a stationary G is
reached with i* = 27 at the age of t = 60 (see Fig. 2(b)). For
γ
= 10
-1
(see Fig. 2(c)), G moves forward (increasing i*) for
some time and then back to a stationary G with i* = 9;
clearly, this high value of
γ
is unrealistic as one does not
expect the peak i* of the EC aging profile to become
"younger" as a person ages. These results suggest that for
an average person,
γ
ranges from 10
-9
to 10
-8
s
-1
.
Healing of damaged endothelium
Here, we are interested in the dynamics of spatially non-
homogenous hole densities much larger than the back-
ground h
0
considered in the previous section (and we set
h
0
= 0 in the discussion below). In general, the expansion
or shrinkage of holes depends on the parameters
γ
,
δ
,
λ
i
and k
i
(i = 0, 1, , N). We used our model to study the rates
of filling up holes in the endothelia of persons of different
ages. We start with the spatial profile of the holes defined
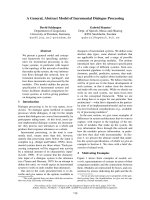
by Eq. (10); this profile is plotted in Figure 3.
h(x, y, 0) = exp [-50((x - 0.5)
2
+ (y - 0.5)
2
)] (10)
To determine the initial cell densities {q(x, y, 0), m
i
(x, y,
0)}, when there is a hole given by Eq. (10) at t = 0, the pro-
file G(T) (for T = 20, 40, or 60 years) is first determined as
in the previous section (i.e., with only the nonzero back-
ground hole density h
0
). Let {m
i
T
} be the set of cell densi-
ties for the G(T), and q
T
be the dead-cell densities at the
same time T. In order to keep the total cell density con-
stant (according to Eq. (8)), we set
m
i
(x, y, 0) =
α
(x, y)m
i
T
for all m
i
T
∈ G(T)(11a)
q(x, y, 0) =
α
(x, y)q
T
(11b)
where
()qm
i
i
N
+
=
∑
0
Table 1: Parameter values used in the computer simulations. (Note that the dimension of
λ
i
, (i = 0, 1, , N) is cm
-2
s
-1
, but it becomes s
-
1
when dimensioness number densities are used).
Parameter Value Description
N 50 number of generations from progenitor to
senescence
D10
-8
cm
2
s
-1
diffusion coefficient of dead cells
k
0
0 s
-1
death rate coefficient of progenitor cells
k
N
0.6 × 10
-7
s
-1
death rate coefficient of senescent cells
k
i
(i = 1, , N - 1) (k
N
+ 1)
i/N
- 1 s
-1
death rate coefficient of cells of age i
λ
0
0.4 × 10
-4
s
-1
division rate constant of progenitor cells
λ
N
0 s
-1
division rate constant of senescent cells
λ
i
(i = 1, , N - 1) (
λ
0
+ 1)
(N-i)/N
- 1 s
-1
division rate constant of cells at age i
γ
10
-9
- 10
-8
day
-1
≈ (10
-9
- 10
-8
) × 10
-5
s
-1
homing rate coefficient of progenitor cells
δ
6 × 10
-7
s
-1
clearance rate coefficient of dead cells
Theoretical Biology and Medical Modelling 2007, 4:30 />Page 5 of 10
(page number not for citation purposes)
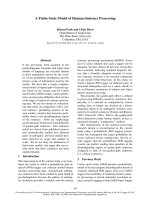
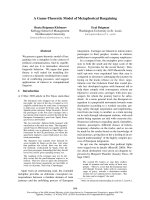
Cell rate parameters and generation profilesFigure 1
Cell rate parameters and generation profiles. (a) Variations of cell replication rate coefficients (h
λ
i
) and death rate coef-
ficients (k
i
) with cell generation. (b) Figure demonstrating that due to the variations in (a), a sharply peaked distribution (black
solid curve) is spontaneously generated, even from an initially flat distribution (dashed line).
0 10 20 30 40 50
−26
−24
−22
−20
−18
−16
−14
−12
cell generation index, i
0 10 20 30 40 50
0
0.05
0.1
0.15
0.2
0.25
0.3
0.35
cell generation index, i
m
i
T=1 year
T=0
ln(hλ
i
)
ln(k
i
)
(b)
(a)
Theoretical Biology and Medical Modelling 2007, 4:30 />Page 6 of 10
(page number not for citation purposes)
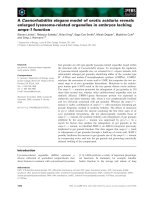
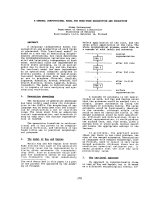
Cell generation profilesFigure 2
Cell generation profiles. Cell generation profiles for a person with advancing chronological age of T = 20, 30, 40, 50, 60, 70,
and 80 years (numbers near the peaks of the curves). The three values used in the simulations for the progenitor cell homing
parameter
γ
are indicated; values of all other parameters are in Table 1.
0 10 20 30 40 50
0
0.2
0.4
0.6
0.8
1
generation index
density
0 10 20 30 40 50
0
0.2
0.4
0.6
0.8
1
generation index
density
0 10 20 30 40 50
0
0.2
0.4
0.6
0.8
1
generation index
density
(a)
γ=10
−8
γ=10
−1
γ=10
−5
20
30
40
40
50
60
70
80
(b)
(c)
80
20
20
30
50
60
70
40
30
50−80
Theoretical Biology and Medical Modelling 2007, 4:30 />Page 7 of 10
(page number not for citation purposes)
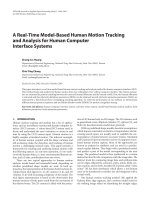
Initial hole density profileFigure 3
Initial hole density profile. The initial hole densities h(x, y, 0) of the damaged endothelium (see Eqn. (10)). The bottom fig-
ure shows the two-dimensional endothelium with hole densities proportional to the darkness of the regions.
0
0.2
0.4
0.6
0.8
1
0
0.5
1
−1
−0.8
−0.6
−0.4
−0.2
0
x
y
−h(x,y,0)
0
0.2
0.4
0.6
0.8
1
0
0.2
0.4
0.6
0.8
1
x
y
Theoretical Biology and Medical Modelling 2007, 4:30 />Page 8 of 10
(page number not for citation purposes)
with A set to 1. Note that
α
depends both on space and the
chronological age T of the person. The dynamics of hole
filling by ECs is then simulated by solving Eqs. (2)–(8),
using the initial cell density and hole profiles given by Eq.
(11) and Eq. (10), respectively.
Let
θ
(t) be the fraction of holes remaining (in excess of
the background h
0
) at time t; this fraction is defined by
Figure 4a shows a comparison of the times required by the
three age groups to reduce the hole fraction by 80% or
more (
θ
≤ 0.2). Eighty percent of the hole (
θ
= 0.2) is filled
in a day for a 20-year old person, almost 2 days for a 40-
year old, and about a week for a 60-year-old. Note that a
60-year-old person requires more than one month to
achieve 90% recovery (
θ
= 0.1), and healing times increase
very rapidly for higher recoveries. The above conclusions
are drawn under the assumption that
γ
is the same for all
ages (
γ
= 10
-8
). However, we expect
γ
to decrease with age,
implying that the recovery of an older person will be even
slower.
Figure 4b demonstrates the sensitivity of healing dura-
tions on the parameter
γ
. An interesting result shown in
this figure is that, despite the reduced replication rates and
increased death rates of the ECs of a 60-year old person, if
somehow
γ
is increased from 10
-8
to 10
-1
, the possibility
exists that the old person's endothelium can heal as fast as
that of a 20-year old (see also Fig. 2c for the possible
reversal of endothelium aging at increased
γ
). This result
is not surprising at all when one remembers that increas-
ing
γ
means larger homing rates of EPCs (whose cell gen-
eration index i is 0), a situation akin to transplanting
patches of brand new ECs to an old endothelium.
Our model of healing of a wounded endothelium has the
limitation that it only involves ECs; in reality, the healing
process is very complex involving many other types of
cells, including platelet cells that aggregate on the wound
during the clotting cascade. Recent work [5] has shown
that, indeed, platelets may be involved in the recruitment
of EPCs as well as in the stimulation of proliferation and
migration of non-senescent ECs surrounding the wound.
Since the clotting process is fast in relation to the prolifer-
ative phase of wound healing considered in this paper,
our results may still hold even if platelet aggregation is
included in the model.
Conclusion
We developed a mathematical model of the endothelium
to investigate the interactions of maintenance factors such
as cell division and stem cell homing, and damaging fac-
tors such as cellular senescence and death. Our model
involves a system of differential equations that offers a
deterministic view of the average dynamics of large EC
populations, hence, providing predictions that apply to
large areas of the vasculature – in contrast to the compu-
tational model of Op den Buijs et al. [6] which focuses on
a few hundreds of ECs.
Our model introduced some novel features. The model
explicitly accounts for the number densities of cell gener-
ations starting from endothelial progenitors to senescent
cells, in addition to the densities of dead cells and the
holes created upon clearing these cells. Aging of cells is
represented by three mechanisms, namely, losing the abil-
ity to divide when the Hayflick limit of 50 generations is
reached, decreasing replication rate parameters and
increasing death rate parameters as cells divide. These fea-
tures implement direct links between aging at the cellular
level and aging of a person. Due to the dependence of the
cell division and death rate parameters on cell generation,
our model predicts a narrow distribution of cell densities
peaking at a particular cell generation – it is this peak that
characterizes the age of the endothelium. As the chrono-
logical age of a person advances, the peak of the distribu-
tion moves towards senescence correspondingly. Our
computer simulations demonstrate that sustained and
enhanced stem cell homing can halt the aging process of
the endothelium by maintaining a stationary cell density
distribution that peaks well before the Hayflick limit. The
healing rates of damaged endothelia for young, middle-
aged, and old persons are compared and are found to be
particularly sensitive to the stem cell homing parameter.
In conclusion, our model predicts that the age of an
endothelium corresponds to a Gaussian-like distribution
of EC generations with a distribution peak that moves
towards senescence at a rate that can be manipulated by
varying the rate parameters of cellular processes that are
considered in our model. The model also suggests that
stem cell transplantation may enhance the rate of
endothelial replacement, so that the effect of aging could
be reversed. The theoretical model presented in this paper
has obvious limitations; for example, aging is also associ-
ated with progressive thickening of arteries (atherosclero-
sis) and plaque formation in the endothelium – a
complex process that is not considered here.
α
(,)
((,,))
()
xy
Ahxy
qm
T
i
T
i
N
=
−
+
=
∑
0
1
(12)
((,,) () ((,,) )h x y t h dx dy t h x y h dx dy
RR
−= −
∫∫ ∫∫
00
0)
θ
(13)
Theoretical Biology and Medical Modelling 2007, 4:30 />Page 9 of 10
(page number not for citation purposes)
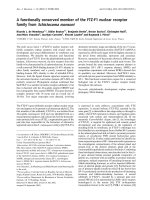
Healing times of damaged endotheliumFigure 4
Healing times of damaged endothelium. (a) Starting with identical hole density profiles (shown in Fig. 3) on their
endothelia, the time it takes (healing time) for the hole to be reduced to a fraction
θ
is shown for a young (T = 20 years), a mid-
dle-aged (T = 40), and an old (T = 60) person. Parameter values as in Table 1, and
γ
= 10
-8
. (b) Starting with the cell generation
profile of an old person (T = 60 years) with a damaged endothelium (hole density profile in Fig. 3), the healing times are deter-
mined for the three
γ
values indicated. Other parameter values in Table 1.
0 0.02 0.04 0.06 0.08 0.1 0.12 0.14 0.16 0.18 0.2
0
5
10
15
20
25
30
θ
Healing Time (days)
0 0.02 0.04 0.06 0.08 0.1 0.12 0.14 0.16 0.18 0.2
0
5
10
15
20
25
30
θ
Healing Time (days)
(b)
(a)
T=40
γ=10
−5
γ=10
−1
T=60
T=20
γ=10
−8
Theoretical Biology and Medical Modelling 2007, 4:30 />Page 10 of 10
(page number not for citation purposes)
Methods
Parameter estimation
The model parameters listed in Table 1 are determined as
follows. Based on published values for EC migration in
cultures containing angiogenic factors (Stokes et al. [9]),
we estimate the diffusion coefficient of dead ECs to be in
the order of 10
-8
cm
2
s
-1
. We assume that cell death rate
coefficients range from a minimum of zero (for k
0
) to a
maximum value of 6 × 10
-8
s
-1
(for k
N
), with intervening
values given by the equation k
i
= (k
N
+ 1)
i/N
- 1 (see Fig.
1a). The results remain essentially the same if k
i
is interpo-
lated in different ways (e.g. linearly) between k
0
and k
N
.
According to [6], ECs in vivo replicate at a rate of 0.1% per
day, which corresponds to a division rate constant of 10
-3
day
-1
or 10
-8
s
-1
– this value will be used for the estimate of
average cell replication rate constants for the entire cell
population, ranging from zero (
λ
N
= 0 for senescent cells)
to a maximum of
λ
0
(= 4 × 10
-5
s
-1
for progenitor cells),
and with intermediate values determined from the equa-
tion
λ
i
= (
λ
0
+ 1)
(N-i)/N
- 1 (see Fig. 1a). The results remain
essentially the same if
λ
i
is interpolated in different ways
between
λ
0
and
λ
N
.
To understand the time scale of the cell replication
dynamics of an entire EC population using the above
parameter values, first consider the equation for the repro-
duction of one type of cell only, that is, .
The time it takes for this cell population to double is given
by . For h = 0.1 (see Results and Discussion),
days or 14 months for N = 50; thus, this
choice of N corresponds to a cell life span from progenitor
to senescence of approximately 14 months. Of course, this
short time span for cellular senescence is different from
the much slower aging rate of the endothelium (discussed
under Results and Discussion) because of contact inhibition
between EC cells and replenishment of holes by EPC
homing.
The value chosen for the clearing rate coefficient,
δ
, of
dead cells is based on the assumption that it is an order of
magnitude larger than k
N
, the death rate constant for
senescent cells. Lastly, the value of the EPC homing rate
coefficient,
γ
, was determined to range from 10
-9
to 10
-8
s
-
1
by imposing biological constraints on the results of the
model simulations (see section on Results and Discussion).
Computational method
The ODEs for calculating cell generation profiles were
integrated using the stiff solver ode15s in MATLAB 7.4.0.
The PDEs describing the healing of damaged endothelium
were solved using C++. Spatial discretization was carried
out using finite difference method with periodic bound-
ary conditions. All plots were made using MATLAB 7.4.0.
Competing interests
The author(s) declare that they have no competing inter-
ests.
Authors' contributions
YW performed the numerical simulations. BDA and AF
formulated the model equations, wrote the manuscript,
and jointly supervised YW's work. All authors read and
approved the final manuscript.
Acknowledgements
This work is partially supported by the US National Science Foundation
upon agreement No. 0112050.
References
1. Cines DB, Pollak ES, Buck CA, Loscalzo J, Zimmerman GA, McEver
RP, Pober JS, Wick TM, Konkle BA, Schwartz BS, Barnathan ES,
McCrae KR, Hug BA, Schmidt A, Stern DM: Endothelial cells in
physiology and in the pathophysiology of vascular disorders.
J Am Soc Hematology 1998, 91:3527-3561.
2. Crosby JR, Kaminski WE, Schatteman G, Martin PJ, Raines EW, Seifert
RA, Bowen-Pope DF: Endothelial cells of hematopoietic origin
make a significant contribution to adult blood vessel forma-
tion. Circ Res 2000, 87:728-730.
3. Gunsilius E, Duba HC, Petzer AL, Kahler CM, Gastl GA: Contribu-
tion of endothelial cells of hematopoietic origin to blood ves-
sel formation. Circ Res 2001, 88:E1.
4. Hill JM, Zalos G, Halcox JP, Schenke WH, Waclawiw MA, Quyyumi
AA, Finkel T: Circulating endothelial progenitor cells, vascular
function, and cardiovascular risk. N Engl J Med 2003,
348:593-600.
5. Langer HF, May AE, Vestweber D, De Boer HC, Hatzopoulos AK,
Gawaz M: Platelet-induced differentiation of endothelial pro-
genitor cells. Semin Thromb Hemost 2007, 33:136-143.
6. Op den Buijs J, Musters M, Verrips T, Post JA, Braam B, van Riel N:
Mathematical modeling of vascular endothelial layer mainte-
nance: the role of endothelial cell division, progenitor cell
homing and telomere shortening. Am J Physiol Heart Circ Physiol
2004, 287:H2651-H2658.
7. Rookmaaker MB, Smits AM, Tolboom H, Van't Wout K, Martens AC,
Goldschmeding R, Joles JA, Van Zonneveld AJ, Grone HJ, Rabelink TJ,
Verhaar MC: Bone-marrow-derived cells contribute to
glomerular endothelial repair in experimental glomerulone-
phritis. Am J Pathol 2003, 163:553-562.
8. Ross R, Glommset JA: The pathogenesis of atherosclerosis (first
of two parts). N Engl J Med 1976, 295:369-377.
9. Stokes CL, Lauffenburger DA, Williams SK: Migration of individual
microvessel endothelial cells: stochastic model and parame-
ter measurement. J Cell Sci 1991, 99:419-430.
dm
dt
hm
i
ii
= ()
λ
T
h
i
i
=
ln2
λ
T
i
i
N
=
∑
≈
0
430