Báo cáo y học: " The hyperbolic effect of density and strength of inter beta-cell coupling on islet bursting: a theoretical investigation" ppt
Bạn đang xem bản rút gọn của tài liệu. Xem và tải ngay bản đầy đủ của tài liệu tại đây (2.38 MB, 13 trang )
BioMed Central
Page 1 of 13
(page number not for citation purposes)
Theoretical Biology and Medical
Modelling
Open Access
Research
The hyperbolic effect of density and strength of inter beta-cell
coupling on islet bursting: a theoretical investigation
Aparna Nittala and Xujing Wang*
Address: Max McGee National Research Center for Juvenile Diabetes & Human and Molecular Genetics Center, Medical College of Wisconsin and
Children's Research Institute of the Children's Hospital of Wisconsin, Milwaukee, WI 53226, USA
Email: Aparna Nittala - ; Xujing Wang* -
* Corresponding author
Abstract
Background: Insulin, the principal regulating hormone of blood glucose, is released through the
bursting of the pancreatic islets. Increasing evidence indicates the importance of islet
morphostructure in its function, and the need of a quantitative investigation. Recently we have
studied this problem from the perspective of islet bursting of insulin, utilizing a new 3D hexagonal
closest packing (HCP) model of islet structure that we have developed. Quantitative non-linear
dependence of islet function on its structure was found. In this study, we further investigate two
key structural measures: the number of neighboring cells that each
β
-cell is coupled to, n
c
, and the
coupling strength, g
c
.
Results:
β
-cell clusters of different sizes with number of
β
-cells n
β
ranging from 1–343, n
c
from 0–
12, and g
c
from 0–1000 pS, were simulated. Three functional measures of islet bursting
characteristics – fraction of bursting
β
-cells f
b
, synchronization index
λ
, and bursting period T
b
,
were quantified. The results revealed a hyperbolic dependence on the combined effect of n
c
and g
c
.
From this we propose to define a dimensionless cluster coupling index or CCI, as a composite
measure for islet morphostructural integrity. We show that the robustness of islet oscillatory
bursting depends on CCI, with all three functional measures f
b
,
λ
and T
b
increasing monotonically
with CCI when it is small, and plateau around CCI = 1.
Conclusion: CCI is a good islet function predictor. It has the potential of linking islet structure
and function, and providing insight to identify therapeutic targets for the preservation and
restoration of islet
β
-cell mass and function.
Background
Insulin, secreted by pancreatic islet
β
-cells, is the principal
regulating hormone of glucose metabolism. In humans,
plasma insulin exhibits oscillatory characteristics across
several time scales independent of changes in plasma glu-
cose [1-4]. These oscillations are caused by pulsatile insu-
lin secretion [5,6]. Loss of insulin pulsatility is observed in
patients of both type 1 diabetes (T1D) and type 2 diabetes
(T2D) [5,7,8], and in relatives with mild glucose intoler-
ance or in individuals at risk for diabetes [9-12]. However,
the role of insulin pulsatility in glucose metabolic control
and diabetes is still not well understood.
The pulsatile insulin release is driven by the electrical
burst of
β
-cell membrane. Theoretically single isolated
β
-
cells can burst, and can be induced in vitro to release insu-
Published: 3 August 2008
Theoretical Biology and Medical Modelling 2008, 5:17 doi:10.1186/1742-4682-5-17
Received: 15 June 2008
Accepted: 3 August 2008
This article is available from: />© 2008 Nittala and Wang; licensee BioMed Central Ltd.
This is an Open Access article distributed under the terms of the Creative Commons Attribution License ( />),
which permits unrestricted use, distribution, and reproduction in any medium, provided the original work is properly cited.
Theoretical Biology and Medical Modelling 2008, 5:17 />Page 2 of 13
(page number not for citation purposes)
lin under tightly controlled conditions. But due to the
extensive heterogeneity among individual
β
-cells, not all
cells will respond to glucose, and for those that do
respond, the amplitude, duration and frequency of oscil-
lations are variable [3,13]. In contrast, in
β
-cell clusters or
islets where the cell-cell communication is intact, all cells
respond to glucose with regular and synchronized oscilla-
tions [3,13,14].
Inter-
β
cell coupling is mediated through the gap junction
channels formed between adjacent
β
-cells. Gap junctions
are specific membrane structures consisting of aggregates
of intercellular channels that enable the direct exchange of
ions. Such channels result from the association of two
hemichannels, named connexons, each contributed sepa-
rately by the two adjacent cells. Each connexon is an
assembly of six transmembrane connexins, encoded by a
family of genes with more than 20 members. Using
rodent models it was found that connexin36 (Cx36) is the
only connexin isoform expressed in
β
-cells [15-18].
Recent study found that Cx36 is also expressed in human
islets [19]. Cx36 gap junctions have weak voltage sensitiv-
ity and small unitary conductance [20]. This unique com-
bination of properties makes them well suited as electrical
coupler, which is important for the regulation of insulin
release from
β
-cells [17].
The critical functional role of the gap junctional coupling
between
β
-cells has been demonstrated in many experi-
ments. Studies on pancreatic islets and acinar cells
revealed that cell-to-cell communication is required for
proper biosynthesis, storage and release of insulin, and
were nicely reviewed in [21,22]. Single uncoupled
β
-cells
show a poor expression of the insulin gene, release low
amounts of the hormone, and barely increase function
after stimulation [23-25]. Alterations in Cx36 level are
associated with impaired secretory response to glucose
[15,17,26,27]. Lack of Cx36 results in loss of
β
-cell syn-
chronization, loss of pulsatile insulin release, and signifi-
cantly higher basal insulin release in the presence of sub-
stimulatory glucose concentration from isolated islets
[28]. Blockage of gap junctions between
β
-cells also simi-
larly abolish their normal secretory response to glucose
[3,25,29]. Restoration of
β
-cell contacts is paralleled by a
rapid improvement of both insulin biosynthesis and
release [23-25]. Further support for this concept comes
from the finding that a number of tumoral and trans-
formed cell lines that do not express connexins show
abnormal secretory characteristics [30]. Transfection of
the cells with a connexin gene corrected the coupling and
some of the secretory defects [30]. In addition to the func-
tional role in insulin secretion, study with transgenic mice
overexpressing Cx36 showed that it protects
β
-cells
against streptozotocin (STZ) and cytokine (IL-1
β
) dam-
age, and loss of the protein sensitizes
β
-cells to such dam-
ages [22]. On the other hand, impaired glucose tolerance
can compromise the gap junctional channels. In vitro
study of freshly isolated rat islets has found that short
exposure (30 min) to glucose can modify gap junction
configuration [31] whilst a chronic increase in glucose
decreases Cx36 expression [32], suggesting that compro-
mise of
β
-cell coupling may be implicated in the early glu-
cotoxicity and desensitization phenomena, and may
therefore be relevant to diabetes pathophysiology.
Theoretical models were developed to describe the
β
-cell
oscillation [33-38], which also revealed how an increased
regularity of glucose-dependent oscillatory events was
achieved in clusters as compared to isolated islet
β
-cells
[35-38]. Together, these experimental and modeling
results strongly indicate the essential role of cell-cell com-
munication in normal
β
-cell function, which may account
for the hierarchical organization of
β
-cell mass. The insu-
lin secreting
β
-cells, together with the other endocrine
cells, comprise only about 1–2% of the total pancreatic
mass. Rather than being distributed evenly throughout
the pancreas, they reside in a highly organized micro-
organ, the pancreatic islet, with specific 3D morphostruc-
ture, copious intercellular coupling and interactions, and
are governed by sensitive autocrine and paracrine regula-
tions. This organization, not individual
β
-cells, is the basis
for generating the insulin oscillation and a proper glucose
dose response. Therefore one would expect that the mor-
phostructural integrity of islets, namely, the interactions
and the three-dimensional architecture among various
cell populations in islets, is critical for islet function.
Indeed, in islet transplantation studies it has been found
that these characteristics are predictive of in vivo function
and survival of islets, as well as the clinical outcome after
transplantation [39]. Despite the many published models
of pulsatile insulin release, a quantitative investigation of
the functional role of islet
β
-cell's cytoarchitectural organ-
ization was not available until recently [40].
In our previous work we have proposed that a
β
-cell clus-
ter can be described by three key architectural parameters:
number of
β
-cells in the cluster n
β
, number of neighboring
β
-cells that each
β
-cell is coupled with n
c
, and intercellular
coupling strength g
c
[40]. Traditional islet simulation has
assumed a simple cubic packing (SCP) arrangement of
β
-
cells, with 6 nearest neighbors for each cell, i.e. n
c,max
= 6.
We found that this model significantly underestimates the
neighboring cells each
β
-cell has, with which potential
intercellular coupling could be formed [40]. It is therefore
limiting to investigate the effect of varying proportions of
non-
β
cells (which do not couple with
β
-cells), or the
functional consequence of architectural perturbations
such as compromised degree of intercellular coupling
resulting from
β
-cell death. We therefore introduced a
new hexagonal closest packing (HCP) model with 12
Theoretical Biology and Medical Modelling 2008, 5:17 />Page 3 of 13
(page number not for citation purposes)
nearest neighbors for each cell, and n
c,max
= 12. It provides
a much more accurate approximation to the cytoarchitec-
tural organization of cells in islet tissue. Experimental
studies of islet
β
-cell clusters also implicated a hexagonal
organization of cells [41,42] (see figure 7 on page S15 of
[41], figure 5 on page 40 of [42], for example). Further, it
was estimated that in rodent islets about 70% of the cells
are
β
-cells; this corresponds to an effective n
c
~ 8.4 (as
30% of the 12 nearest neighbors are non-
β
cells) in our
HCP model, which is consistent with laboratory measure-
ments of the degree of inter-
β
cell coupling [43]. Human
islets are believed to contain proportionally much less
β
-
cells, at ~50% [44,45], which corresponds to n
c
~ 6.
Using this new
β
-cell packing model, we examined, for the
first time, the functional dependence of islet oscillation
on its architecture. Optimal values of n
β
, n
c
and g
c
at which
functional gain is maximized are obtained [40]. In this
study, we further investigate islet-bursting phenomenon
as reflected in three functional measures: fraction of
β
-
cells that could burst f
b
, synchronization index
λ
, and
bursting period T
b
. We will specifically examine the influ-
ence of structural perturbation to n
c
and g
c
, and if a com-
posite measure of islet morphostructural integrity can be
defined from them. As in previous study, we focus the
investigation from the perspective of high frequency oscil-
lation resulting from the feedback loops of intracellular
calcium currents, which is in the time scale of ~10–60 sec.
We reserve the more comprehensive investigation of
β
-cell
oscillation at different time scales in future work.
Results
Sorting cells using Lomb-Scargle periodogram
The first step post simulation of a
β
-cell cluster is to deter-
mine the bursting status of each
β
-cell in the cluster. In
general it can be a burster, a spiker, or a silent cell [40]. A
burster is defined as a cell capable of producing a
sequence of well-defined regular bursts which correlate
with the period between consecutive peaks and nadirs in
the calcium signal or membrane action potential. In con-
trast, a spiker usually produces uncontrolled continuous
voltage spikes and does not spend any significant time in
the plateau phase of sustained oscillation, thereby being
unable to generate a glucose dose response. A silent cell is
one which remains in the hyperpolarized state through-
out, and thus remains inactive in the insulin secretion
process. In our previous work, we used an empirical rule
based on the peak and nadir information of the s(t) signal
(the slow variable of the potassium channel, see equa-
tions 4–5 in methods) to distinguish between spikers and
bursters. In this study we introduce a more analytical
method. The sorting hat (Rowling J.K.) we utilized is the
Lomb-Scargle periodogram [46,47], which describes
power concentrated at particular frequencies. We applied
it to intracellular calcium concentration [Ca(t)].
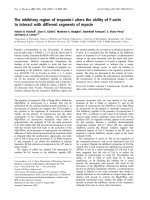
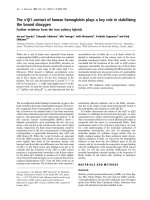
Figure 1 presents the calcium and membrane voltage pro-
files of three sample cells – a burster, a spiker and a silent
cell, along with their computed Lomb-Scargle periodog-
rams. As we can see, the spiker and the silent
β
-cells have
a broad frequency spectrum and power is spread out over
a wide-range of frequencies, whereas for the burster
β
-cell,
the distribution is much narrower and the major peak fre-
quency was observed at 33 mHz. The p-value of the prin-
cipal frequency component of the burster cell assumes a
significantly low value with p < 10
-12
, while it is >0.4 for
the spiker and silent cells. In this study the threshold p-
value for burster cell is set to be 0.005. We find that this
algorithm distinguishes well the burster cells from the
rest. Figure 1d presents the distribution of p-values for 819
β
-cells from three
β
-cell clusters: a HCP-323, a SCP-343,
and a HCP-153 cluster. Cells with regular bursting clearly
segregate from others into a distinct group. Spikers with a
very regular spiking frequency can also have marginally
significant principal peaks, but normally with p > 0.05.
The algorithm was tested extensively and zero misclassifi-
cation was found for all the clusters we have simulated.
Hence we believe that the f
b
estimation using the Lomb-
Scargle periodogram is accurate.
The hyperbolic relationship between g
c
and n
c
, and the
cluster coupling index CCI
To investigate the functional role of islet structure charac-
terized by (n
β
, n
c
, g
c
), we simulated for over 800 different
structural states of islet (see figure 5 in methods). Our pre-
vious study has revealed a quantitative dependence of islet
function on the 3D morphostructural organization of its
β
-cells. This raises the question if a composite measure of
islet architectural integrity can be defined to capture the
dependence and to develop predictive models of islet
function. Given a
β
-cell cluster, the architecture intactness
of the whole cluster depends critically on both the indi-
vidual pair-wise cell coupling strength (g
c
) and the
number of couplings each
β
-cell has (n
c
).
Specifically, the coupling term in equation 3 (see meth-
ods) can be written as:
where is the mean field value
of all the nearest neighbors of cell i. This suggests that
mean (n
c
·g
c
) can be a measure that describes the coupling
integrity of the islet.
For a normal islet, the distribution of (n
c
·g
c
) is around a
constant.
gV V ng V V
ij ii
ji
ccc
all cells coupled to
−
()
=⋅
()
×−
()
=
∑
(1)
VV
ij
ji
n
c
=
=
∑
1
all cells coupled to
Theoretical Biology and Medical Modelling 2008, 5:17 />Page 4 of 13
(page number not for citation purposes)
We have evaluated the three functional measures f
b
,
λ
, and
T
b
for all
β
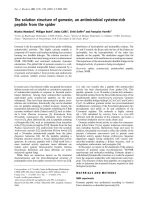
-cell clusters that we have simulated. Figure 2
presents the results for the HCP-323 and SCP-343 clusters
on a g
c
-n
c
plane. It is of interest to note that they indeed
follow a hyperbolic response to g
c
and n
c
at lower values of
g
c
or n
c
, and plateau at higher values. Other clusters with
different n
β
emulate these responses.
The islet cell coupling and cytoarchitecture are likely com-
promised during the onset and progression of diabetes.
During prediabetic development of disease, as well as
after diabetes onset, significant loss of
β
-cell mass occurs
[48,49]. This will reduce the number of available
β
-cells
for coupling, thus reducing the value of n
c
. During T1D
specifically, the infiltrating immune cells will further
reduce n
c
, as many neighboring cells would be replaced by
the immune cells. Though the role of gap junction con-
ductance in human diabetes has not been investigated in
depth, animal model studies have indicated its potential
involvement in both T1D and T2D [22]. The gap junction
conductance g
c
between each pair of cells is the product of
number of gap junctional channels formed between them
Cell sorting using Lomb-Scargle periodogramFigure 1
Cell sorting using Lomb-Scargle periodogram. (a) Calcium profiles, (b) membrane action potential profiles, and (c) Lomb-Scar-
gle periodogram, of a burster cell, a spiker cell and a silent cell. The burster has a clear peak frequency at f = 33 mHz (0.033
sec
-1
), whereas the spiker and silent cells have broad spectra. (d) Distribution of the principal peak p values. All cells with p <
10
-12
were plotted at p = 10
-12
. The burster cells form a distinct group from others, with p < 0.005 (dashed black line).
Theoretical Biology and Medical Modelling 2008, 5:17 />Page 5 of 13
(page number not for citation purposes)
and the specific conductance of each channel, with the lat-
ter depending on the channel configuration among other
factors. Using transgenic rodent models, it has been
shown that the amount of gap junctions directly affects
the cell-cell communication and the synchronization of
β
-
cell oscillation [28,50]. Reduced amount of gap junctions
Fraction of burster cells f
b
, synchronization index
λ
, and bursting period T
b
plotted for a HCP-323
β
-cell cluster (a, c and e) and a SCP-343 cluster (b, d, and f) on the g
c
-n
c
planeFigure 2
Fraction of burster cells f
b
, synchronization index
λ
, and bursting period T
b
plotted for a HCP-323
β
-cell cluster (a, c and e) and
a SCP-343 cluster (b, d, and f) on the g
c
-n
c
plane. A clear hyperbolic relation is visible.
Theoretical Biology and Medical Modelling 2008, 5:17 />Page 6 of 13
(page number not for citation purposes)
leads to loss of regular oscillation and the pulsatile insulin
release at stimulatory levels of glucose, and increased
insulin output at basal glucose. These characteristics of
pancreatic dysfunctions mimic those observed in diabe-
tes, and are suggestive of a role of gap junction in the
pathophysiology of diabetes [22]. Conversely, gap junc-
tions are dynamic structures, their number, size, and con-
figurations are readily affected (regulated) by
environmental conditions, including the glucose level
[31,32]. Therefore diabetes progression likely can also
affect the value of g
c
.
Bearing in mind the significance of the combined effect of
g
c
and n
c
in determining cluster coupling, and their poten-
tial importance in the pathological development of dis-
ease, we propose a dimensionless cluster coupling index:
CCI = (n
c
·g
c
)/C
0
(2)
as an islet cytoarchitectural integrity descriptor, where C
0
= (n
c,0
·g
c,0
) is a normalization constant, and n
c,0
and g
c,0
are their corresponding normal physiological values. In
normal rodent islets, ~70% of the islet cells are
β
-cells,
which gives n
c,0
~ 8.4 assuming hexagonal arrangement.
The gap junctional conductance has been measured, and
found to distribute around g
c,0
~200 pS [51,52]. Therefore
C
0
~ 1680 pS•cell. Less is known about human islets
except that the proportion of
β
-cells is smaller, at ~50%
[44,45], which gives n
c,0
~ 6.0. The g
c,0
value of human
islets is still to be measured. It would of interest to exam-
ine if human islets have higher g
c,0
(most likely by forming
more gap junction channels between pairs of neighboring
β
-cells) compared to rodent islets, to compensate for the
smaller n
c,0
value.
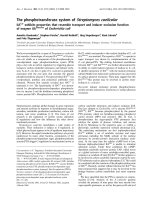
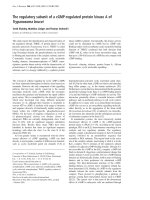
Figure 3 presents the dependence of the three functional
measures on CCI for all HCP
β
-cell clusters we simulated,
assuming C
0
= 1680 pS•cell. Clearly when CCI<1.0, all
three measures increase monotonically with increasing
CCI value. Little additional functional gain is obtained in
the region of CCI>1.0. Values of CCI greater than 1.0 rep-
resent higher states of coupling in the islet network sys-
tem. Islet is robust in its function with strong inter-
communication and synchronization. The functional gain
of increasing either g
c
or n
c
when the other is intact, is not
of much therapeutic value. This region is of interest to
investigate the uplimit of islet connectivity and how this
might have evolved. It would also be of interest to study
the CCI values of real islets, their distribution, and the
upper limit of islet evolution in terms of developing gap
junctions and neighborhood coupling.
During diabetes n
c
and g
c
values are likely compromised,
either contributing to or resulting from problems in glu-
cose tolerance. Reduction either in n
c
or g
c
will lower the
value of CCI. When CCI<1.0, extensive variation in all
three measures is evident, indicating functional impair-
ment and instability. For consideration of potential thera-
peutic treatment, this is the critical region for
investigation of mechanisms to restore islet structural
integrity and functionality by improving g
c
and/or n
c
, and
bringing CCI back to its desired value. For this reason we
denote CCI<1.0 as the region of interest (ROI) for poten-
tial therapy (shaded areas in figure 3).
Discussion
Previously we have, for the first time, studied the func-
tional dependence of islet pulsatile insulin release on its
cytoarchitectural organization of
β
-cells [40]. In the cur-
rent study, we further investigated two key islet structural
parameters g
c
and n
c
on islet bursting properties, which are
likely involved in the pathophysiology of diabetes.
Although numerous experiments have demonstrated the
importance in islet function of cell-cell communication
between
β
-cells mediated through the gap junction chan-
nels, few studies have examined quantitatively the func-
tional role of density and strength of the gap junctions. As
Islet functional measures versus CCI exhibiting potential ROI for therapy (shaded areas)Figure 3
Islet functional measures versus CCI exhibiting potential ROI for therapy (shaded areas). (a) Fraction of burster cells f
b
. (b)
Synchronization Index
λ
. (c) Bursting period T
b
.
Theoretical Biology and Medical Modelling 2008, 5:17 />Page 7 of 13
(page number not for citation purposes)
synchronization of
β
-cells in their electrical burst and
insulin release is the hallmark of normal islet function, we
focused on three related functional measures: fraction of
β
-cells that can burst f
b
, synchronization index
λ
, and
bursting period T
b
. We specifically examined the hyper-
bolic response of
β
-cell cluster function to the combined
input of g
c
and n
c
. This means islet functionality can be
preserved by manipulating any one or both of them. For
example under weak g
c
caused by low expression of gap
junction proteins (Cx36), increasing the value of n
c
will
result in improved number of burster cells, bursting pat-
tern and synchronization, and improved islet function.
Similarly, when infiltration of immune cells and
β
-cell
loss leave few well-connected neighboring
β
-cells
(reduced n
c
), targeting the gap junction strength (improv-
ing g
c
) of existing couplings can improve the bursting and
synchronization.
We characterized the hyperbolic effect of g
c
and n
c
on islet
function in a dimensionless composite measure CCI. We
showed that this measure correlates well with islet func-
tional performance. We believe that CCI has the potential
to be an index of islet's well-being that is predictive of islet
function, and thus a key factor linking structure and func-
tion. It can provide insight to the intrinsic compensation
mechanism of islet cells when damage occurs. The com-
plexity of islet function can be better understood when
associating it with CCI.
Human islet biology is difficult due to tissue inaccessibil-
ity. Most of our current knowledge is obtained and extrap-
olated from animal studies. However, recent studies
revealed cytoarchitectural differences between human and
animal islets [44,45]. Specifically, in the frequently used
rodent models, an islet contains significantly lower pro-
portions of non-
β
cells compared to in humans, ~30%
versus ~50% (this gives, on average, n
c
~ 8.4 versus n
c
~ 6,
in our HCP cell cluster model). It was further estimated
that about 70% of
β
-cells exclusively associate with
β
-cells
in rodent islets (namely 70%
β
-cells have n
c
~ 12), whilst
in human islets, this number can be as low as 30% (only
30%
β
-cells have n
c
~ 12) [44,45]. These reports suggest
that rodent islets may have much higher n
c
than human
ones. The functional implication of such architectural dif-
ference is still not known, but clearly cannot be extrapo-
lated linearly. We believe that our work, aimed at
achieving a quantitative understanding of islet function
and cytoarchitecture, will help us to study human islet
biology utilizing animal models. For example, it will also
be of interest to examine if CCI is conserved across spe-
cies, and if it can serve as a scale-invariant index that
unveils a common reigning principle across species of
islet functional dependence on structure.
Investigation of islet function and structure is no doubt of
interest to the study of glycemic control, diabetes patho-
genesis, and the related metabolic syndromes. Such a
study is sine qua non for understanding pathological pro-
gression of
β
-cell mass and function loss, and islet tissue
engineering and transplantation, to name a few [39,40].
Under many physiological/pathological conditions, such
as pregnancy, puberty, and diabetes,
β
-cell mass is modi-
fied. Often the modification is more profound than a
mere change of islet size or islet number. For example in
T1D the infiltrating immune cells spread from peripheral
islet vessels to the centre of a given islet, causing
β
-cell
apoptosis across the islet [53] and modification of islet
architecture in addition to its total
β
-cell mass. To many
with T1D, islet transplantation represents a viable hope to
control hyperglycemia; however, significant loss of islet
mass and function are observed both short term and long
term after transplantation [54]. It is still not clear what
exactly the transplanted islets go through. Predictive mod-
els of islet function and survival post transplantation are
much needed. Several commonly used parameters in islet
preparation quality control: islet size (n
β
), percent of cells
that are
β
-cells (affects n
c
), non-apoptotic
β
-cells (affects
both n
c
and g
c
), etc [39], actually constitute the structural
framework of the islet. Very recently, it has been explicitly
pointed out that the morphostructural integrity of the
islets is critical and predictive of in vivo function and clin-
ical outcome in islet allotransplantation, and should be
studied more [39]. We believe our study provides a start-
ing point for better understanding these issues.
In this study, we focused the investigation on islet archi-
tectural measures, and how they affect islet oscillation. For
simplicity, as in previous study, we adopted an oscillation
model that describes only the high frequency (at the time
scale of ~10–60 sec) component resulting from the feed-
back loops of the intracellular calcium currents. To have a
more comprehensive physical description and better
understanding of the pulsatile insulin secretion from
islets, and how it depends on islet cytoarchitecture, the
other components, especially the intracellular metabo-
lism and the signal transduction pathway of glucose
induced insulin release need to be included: the oscilla-
tion of glycolysis, ATP/ADP ratio, cAMP, and the other
metabolic factors such as NADPH, glutamate, glutamine;
the cytosolic calcium, and the exchange of calcium with
ER and the effect of ER stress; etc [55-66]. These coupled
with the electrical current oscillation, would generate an
additional slow rhythm at the time scale of 2–10 min. The
latter is important as it is at a more readily measurable
time scale with available laboratory techniques. It would
be of interest to investigate how the intracellular pathways
and intercellular connections are coupled in determining
the islet function, how the properties of individual
β
-cells
Theoretical Biology and Medical Modelling 2008, 5:17 />Page 8 of 13
(page number not for citation purposes)
affect the islet function through the network of coupled
β
-
cells, and whether in a coupled network, the islet is more
robust to defects in individual
β
-cells such as problems in
the intracellular pathways. In this sense, our work only
represents the first step towards developing practical mod-
els and quantitative measures of islet architecture and
investigating its role in islet function. More sophisticated
models and laboratory studies are needed. The electro-
physiology of islet and
β
-cell oscillation, and evaluation
of islet architectural organization, are all experimentally
challenging. We believe that such theoretical analysis,
though may only represent an initial minimal model
approach, are meaningful to gain some insight, and to
help design the most relevant and feasible experiment to
examine the key factors in these issues.
Methods
Mathematical model of the electrical excitability of β-cells
As we have previously described in [40], we adopt the for-
mulation developed by Sherman et al [67,68] of the
Hodgkin-Huxley model for
β
-cell electrical excitability,
for its simplicity:
The ionic current terms include the fast voltage-dependent
L-type Ca
2+
-channel current I
Ca
, the glucose sensitive K
ATP
channel current I
KATP
, the voltage-dependent delayed rec-
tifier K
+
current I
K
, and a slow inhibitory K
+
current I
S
,
given by:
where g
KATP
, g
Ca
, g
K
, g
S
are channel conductance. The acti-
vation parameters n, s are given by
with , ,
being the fraction of open chan-
nels for the corresponding currents respectively at steady
state. The parameters V
m
, V
n
, V
s
, and
θ
m
,
θ
n
,
θ
s
are constants
that describe the dependence of channel activation on
membrane voltage V. The change in intercellular calcium
concentration is given by
where f is the fraction of free Ca
2+
and k
Ca
is the removal
rate of Ca
2+
in the intracellular space.
α
is a conversion fac-
tor from chemical gradient to electrical gradient. For a
more detailed explanation of the model equations,
parameters and their values, and the implementation,
please refer to [40]. The numerical simulation was per-
formed for the 4 ODEs given in equations 3, 5, and 6.
The HCP model of β-cell cluster
We have previously introduced the HCP model of islet
cytoarchitecture to simulate the functional consequence
of varying structure [40]. In this model each cell has 6
nearest neighbors in 2D (n
c,max
= 6), and 12 in 3D (n
c,max
= 12). Setting up the simulation for HCP
β
-cell clusters is
more intricate than the SCP model, and we have devel-
oped a cell labeling algorithm [40]. Briefly, given a
β
-cell
cluster with edge size n, labeling of cells starts with the
center or the primary layer. It is a 2D regular hexagon of
edge size n, with a total of 3n
2
-3n+1 cells. The remaining
n-1 layers on each side (top and bottom) of the primary
layer, starting from immediate layer adjacent to it, alter-
nate between being an irregular hexagonal (IH, the six
sides and internal angles are not all equal) layer, and a reg-
ular hexagonal (RH) layer. The edge size decreases each
time when traversing up or down. The number of cells in
IH and RH layers is given by 3(r-1)
2
and 3r
2
-3r+1 respec-
tively where r is the edge size of that layer. When n is even,
a 3D HCP cluster ends with an IH-layer on its surface and
when n is odd, it ends with an RH-layer on its surface [40].
This definition ensures that our HCP clusters are symmet-
ric along all directions, which simulates the natural
growth of pancreatic islets. Lastly, the program generates
nearest neighbor list for each
β
-cell based on the Eucli-
dean distance between cells.
All cell j located at (x
j
, y
j
, z
j
) belongs to the neighborhood
of cell i at (x
i
, y
i
. z
i
) if the Euclidean distance between the
two cells is 1, namely:
C
dV
i
dt
II II
gV V
mi CaiKiKiSi
ij
j
,,,,,
( ) =− + + + −
−
()
=
ATP
c
all ceells coupled to i
∑
(3)
IgOVV
IgmVV
IgnVV
Ig
KKK K
Ca Ca Ca
KK K
SS
ATP ATP ATP
=−
=⋅ −
()
=⋅ −
()
=⋅
∞
()
ssV V
K
−
()
(4)
dn
dt
n
nn
ds
dt
s
ss
=−
()
=−
()
∞
∞
1
1
t
t
(5)
m
V
m
V
m
∞
=
+−
()
()
1
1exp
q
n
V
n
V
n
∞
=
+−
()
()
1
1 exp
q
s
V
s
V
s
∞
=
+−
()
()
1
1 exp
q
dCa
i
dt
fI kCa
iCai Cai i
[]
[]
,,
2
2
+
=− −
()
+
a
(6)
Nbr Cell Cell () ( )( )( )ijxxyyzz
ij ij ij
=−+−+−=
{}
222
1
(7)
Theoretical Biology and Medical Modelling 2008, 5:17 />Page 9 of 13
(page number not for citation purposes)
This neighbor list is then utilized to set up the
term in equation 3.
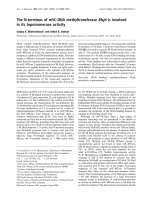
Figure 4 presents the top view of a 3D HCP-323 and a
SCP-343 cell cluster. Evident from the figure is the com-
plexity of HCP but the added advantage of a higher degree
of intercellular coupling, as well as the simplicity of SCP
with its limited intercellular coupling.
Numerical Simulations
HCP and SCP
β
-cell clusters of different sizes with number
of
β
-cells n
β
ranging from 1–343, number of inter
β
-cell
couplings of each
β
-cell n
c
varying between 0–12, and cou-
pling strength g
c
spanning from 0–1000 pS, were simu-
lated, as described in figure 5. Totally we simulated for
over 800 different clusters. For each point in the structure
space S: (n
β
, n
c
, g
c
), 10 replicate clusters were simulated
with the biophysical properties of individual
β
-cells fol-
lowing the heterogeneity model as previously described,
in table 2 of [40]. 500 uncoupled single
β
-cells were also
simulated, which corresponds to point (1, 0, 0) in S (fig-
ure 5). This provides the baseline information for analyz-
ing the functional characteristics of coupled cell clusters.
Simulation for n
c
is modulated by randomly decoupling
varying percentages of
β
-cells from the rest. This is
designed to simulate the loss of
β
-cell mass under patho-
logical conditions, or the presence of non
β
-cells (mainly
α
- and
δ
-cells) in natural islets. It is known the non-
β
islet
cells do not synchronize with
β
-cells or among themselves
[69], presumably because they do not couple to
β
-cells,
and the coupling among themselves are too sparse to
coordinate their dynamic activities. Gap conductance g
c
is
varied from a no coupling state (where each cell is in a
quarantine-like state and functioning without any com-
munication, g
c
= 0 pS) to a strongly coupled state of 1000
pS.
The Sorting Hat for β-cells
We introduce the Lomb-Scargle periodogram [46,47],
which describes power concentrated in a particular fre-
quency, namely, the power spectral density (PSD), to sort
the bursting status of
β
-cells. We adopt this method over
the more commonly used Fourier method for two rea-
sons: (1) it does not require evenly spaced time series
while the Fourier method does. It may not be a major con-
cern if we restrict to only the analysis of the intracellular
calcium (figure 1, upleft), and only the steady state solu-
tion. But other parameters, particularly the membrane
potential, exhibit more complex temporal patterns, with
high frequency oscillation overlaying the plateau phase of
the slower oscillations (figure 1, upright). (2) the Lomb-
Scargle Periodogram comes with a statistical method to
evaluate the significance of the observed periodicity [47]
while Fourier transform method does not.
Briefly, let y
i
be the time-dependent intra-cellular calcium
[Ca(t)] obtained by simulation at each time t
i
, where i =
1,2, , N, with mean and variance
σ
2
. The Lomb-Scargle
periodogram P(
ω
) at an angular frequency of
ω
= 2
π
f is
computed according to the following equation:
where the constant
τ
is obtained from:
The low-limit of f is taken to be 1/T, where T is the time
span and is equal to t
N
- t
1
. Since our simulations are car-
ried out for a period of 120 sec, f is 0.0083 Hz. The uplimit
of f is taken as the Nyquist frequency, N/(2T), where N is
the length of the dataset. This gives a value of 1.0 Hz. Scar-
gle showed that the null distribution of the Lomb-Scargle
periodogram at a given frequency is exponentially distrib-
uted, namely the cumulative distribution function of P(
ω
)
is given by Pr [P(
ω
) <z] = 1 - e
-z
[47]. Therefore, once P(
ω
)
is calculated for different frequencies, the significance of
the principal peak, max(P(
ω
)) can be evaluated by [47]:
gV V
ij
ji
c
all cells coupled to
−
()
=
∑
y
P
y
i
yt
i
i
N
t
i
i
N
y
()
cos
cos
w
s
wt
wt
=
−
()
−
()
=
∑
⎡
⎣
⎢
⎢
⎤
⎦
⎥
⎥
−
()
=
∑
+
1
2
2
1
2
2
1
ii
yt
i
i
N
t
i
i
N
−
()
−
()
=
∑
⎡
⎣
⎢
⎢
⎤
⎦
⎥
⎥
−
()
=
∑
⎧
⎨
⎪
⎪
⎪
⎩
⎪
⎪
⎪
⎫
⎬
sin
sin
wt
wt
1
2
2
1
⎪⎪
⎪
⎪
⎭
⎪
⎪
⎪
(8)
tan( )
sin
cos
2
2
1
2
1
wt
w
w
=
=
∑
=
∑
t
i
i
N
t
i
i
N
(9)
3D HCP and SCP cell clusters projected on a 2-dimensional x-y planeFigure 4
3D HCP and SCP cell clusters projected on a 2-dimensional
x-y plane. (a) A HCP-323 cluster with edge size 5. Each cell is
connected with n
c
= 12 neighbors, 6 from the same layer and
6 from the layers above and below. (b) A conventional SCP 7
× 7 × 7 cluster with n
c
= 6 for each cell.
Theoretical Biology and Medical Modelling 2008, 5:17 />Page 10 of 13
(page number not for citation purposes)
p = 1 - (1 - e
-max(P(
ω
))
)
M
(10)
where M equals number of independent test frequencies.
In our case it equals the number of data points N. Expres-
sion (10) tests the null hypothesis that the peak is due to
random chance. When p-value of the principal peak is
small, the time series is considered to contain significant
periodic signal, and in our case, the cell can be considered
a burster with regular oscillatory pattern. In this study the
threshold p-value for burster cell is set to be 0.005. Among
non-bursters, cells whose maximum and minimum mem-
brane voltages differ by less than 30 mV, ΔV = |V
max
- V
min
|
< 30 mV, are sorted as silent cells and the rest as spikers.
The flowchart of the complete sorting process is presented
in figure 6. For the burster
β
-cells, their bursting periods T
b
and degree of synchronization in bursting were then
determined.
cc
Synchronization Analysis
Briefly, the instantaneous phase of each
β
-cell was first
determined using the Matlab command:
φ
j
(t) =
unwrap(angle(Hilbert(detrend(V
j
(t)))). A mean field
value of phase Φ is determined by taking the circular
mean of the individual phase angles of all bursting
β
-cells
Φ(t
k
) = arg ∑ exp (i
φ
j
(t
k
)) (11)
The synchronization strength to mean field by each
β
-cell
can be calculated by
ρ
j
= | exp(i
φ
j
(t
k
) - Φ(t
k
)) | (12)
A cluster synchronization index (CSI) is then defined by
It measures how cells in the whole cluster are coupled in
their oscillation. When synchronization is evaluated
among bursting
β
-cells only, a simpler approach that
measures the mean pair-wise phase difference can be
taken. The synchronization of each pair of cells j and k is
calculated by
λ
j,k
= | exp(i(
φ
j
(t) -
φ
k
(t)) | (14)
The mean of all pair-wise synchronization are then deter-
mined by:
For each cluster both the mean value and the distribution
of CSI and
λ
are evaluated. The results are compared to
reveal if there is modular pattern within the cluster,
namely, if there are sub-regions within the whole cluster
where the
β
-cells within each region is well synchronized,
but not with
β
-cells in the other sub-regions. In the
β
-clus-
ters we have simulated, the results of CSI and
λ
are not sig-
nificantly different, and therefore for simplicity we only
report the results of
λ
.
Abbreviations
CCI: cluster coupling index; CSI: cluster synchronization
index; HCP: hexagonal closest packing; SCP: simple cubic
CSI ==
∑
r
b
r
jj
j
n
1
(13)
ll
bb
l
b
==
−
()
>
∑
jk jk
jk j
n
nn
,,
,
2
1
(15)
Simulation schemaFigure 5
Simulation schema.
Theoretical Biology and Medical Modelling 2008, 5:17 />Page 11 of 13
(page number not for citation purposes)
packing; T1D: type 1 diabetes; T2D: type 2 diabetes; ROI:
region of interest; PSD: power spectral density.
Competing interests
The authors declare that they have no competing interests.
Authors' contributions
AN and XW both contributed to the development of the
modeling method. AN wrote the Matlab code and ran the
simulation. Both contributed to the writing of the manu-
script, read and approved the final manuscript.
Acknowledgements
This work is supported in part by a special fund from Children's Hospital
Foundation, Children's Research Institute of Wisconsin and Children's
Hospital of Wisconsin. Most simulations were run on the cluster Zeke of
the Computational Bioengineering group at MCW, courtesy of Dr. Dan
Beard. We thank Gregg McQuestion for administration assistance with the
cluster.
References
1. Porksen N, Hollingdal M, Juhl C, Butler P, Veldhuis JD, Schmitz O:
Pulsatile insulin secretion: detection, regulation, and role in
diabetes. Diabetes 2002, 51(Suppl 1):S245-254.
2. Sonnenberg GE, Hoffmann RG, Johnson CP, Kissebah AH: Low- and
high-frequency insulin secretion pulses in normal subjects
and pancreas transplant recipients: role of extrinsic innerva-
tion. J Clin Invest 1992, 90:545-553.
3. Jonkers FC, Jonas JC, Gilon P, Henquin JC: Influence of cell
number on the characteristics and synchrony of Ca2+ oscil-
lations in clusters of mouse pancreatic islet cells. J Physiol
1999, 520(Pt 3):839-849.
4. Boden G, Ruiz J, Urbain JL, Chen X: Evidence for a circadian
rhythm of insulin secretion. Am J Physiol 1996, 271:E246-252.
5. Matthews DR, Lang DA, Burnett MA, Turner RC: Control of pulsa-
tile insulin secretion in man. Diabetologia 1983, 24:231-237.
The flowchart of our cell sorting algorithmFigure 6
The flowchart of our cell sorting algorithm. Intra-cellular calcium signals, Ca(t) are passed to a program which calculates the
periodogram PSD and the probability of the peak PSD values. If p < 0.005, cell is sorted as a burster cell. Among non-bursters,
cells which satisfy the condition ΔV = |V
max
- V
min
| < 30 mV are considered silent cells, and the rest as spiker cells.
Theoretical Biology and Medical Modelling 2008, 5:17 />Page 12 of 13
(page number not for citation purposes)
6. Lefebvre PJ, Paolisso G, Scheen AJ, Henquin JC: Pulsatility of insulin
and glucagon release: physiological significance and pharma-
cological implications. Diabetologia 1987, 30:443-452.
7. Bergsten P: Pathophysiology of impaired pulsatile insulin
release. Diabetes Metab Res Rev 2000, 16:179-191.
8. Lang DA, Matthews DR, Burnett M, Turner RC: Brief, irregular
oscillations of basal plasma insulin and glucose concentra-
tions in diabetic man. Diabetes 1981, 30:435-439.
9. Nyholm B, Porksen N, Juhl CB, Gravholt CH, Butler PC, Weeke J,
Veldhuis JD, Pincus S, Schmitz O: Assessment of insulin secretion
in relatives of patients with type 2 (non-insulin-dependent)
diabetes mellitus: evidence of early beta-cell dysfunction.
Metabolism 2000, 49:896-905.
10. Schmitz O, Porksen N, Nyholm B, Skjaerbaek C, Butler CP, Veldhuis
DJ, Pincus MS: Disorderly and nonstationary insulin secretion
in relatives of patients with NIDDM. Am J Physiol 1997,
272:E218-226.
11. O'Rahilly S, Turner CR, Matthews RD: Impaired pulsatile secre-
tion of insulin in relatives of patients with non-insulin-
dependent diabetes. N Engl J Med 1988, 318:1225-1230.
12. Bingley JP, Matthews RD, Williams JA, Bottazzo FG, Gale AE: Loss of
regular oscillatory insulin secretion in islet cell antibody pos-
itive non-diabetic subjects. Diabetologia 1992, 35:32-38.
13. Salomon D, Meda P: Heterogeneity and contact-dependent
regulation of hormone secretion by individual B cells. Exp Cell
Res 1986, 162:507-520.
14. Andreu E, Soria B, Sanchez-Andres JV: Oscillation of gap junction
electrical coupling in the mouse pancreatic islets of Langer-
hans. J Physiol 1997, 498(Pt 3):753-761.
15. Le Gurun S, Martin D, Formenton A, Maechler P, Caille D, Waeber
G, Meda P, Haefliger JA: Connexin-36 contributes to control
function of insulin-producing cells. J Biol Chem 2003,
278:37690-37697.
16. Serre-Beinier V, Le Gurun S, Belluardo N, Trovato-Salinaro A, Cha-
rollais A, Haefliger JA, Condorelli DF, Meda P: Cx36 preferentially
connects beta-cells within pancreatic islets. Diabetes 2000,
49:727-734.
17. Speier S, Gjinovci A, Charollais A, Meda P, Rupnik M: Cx36-Medi-
ated Coupling Reduces {beta}-Cell Heterogeneity, Confines
the Stimulating Glucose Concentration Range, and Affects
Insulin Release Kinetics. Diabetes 2007, 56:1078-1086.
18. Moreno AP, Berthoud VM, Perez-Palacios G, Perez-Armendariz EM:
Biophysical evidence that connexin-36 forms functional gap
junction channels between pancreatic mouse beta-cells. Am
J Physiol Endocrinol Metab 2005, 288:E948-956.
19. Caton D, Calabrese A, Mas C, Serre-Beinier V, Wonkam A, Meda P:
Beta-cell crosstalk: a further dimension in the stimulus-
secretion coupling of glucose-induced insulin release. Diabe-
tes Metab 2002, 28:3S45-53.
20. Srinivas M, Rozental R, Kojima T, Dermietzel R, Mehler M, Condorelli
DF, Kessler JA, Spray DC: Functional properties of channels
formed by the neuronal gap junction protein connexin36. J
Neurosci 1999, 19:9848-9855.
21. Bavamian S, Klee P, Britan A, Populaire C, Caille D, Cancela J, Cha-
rollais A, Meda P: Islet-cell-to-cell communication as basis for
normal insulin secretion. Diabetes Obes Metab 2007, 9(Suppl
2):118-132.
22. Nlend RN, Michon L, Bavamian S, Boucard N, Caille D, Cancela J,
Charollais A, Charpantier E, Klee P, Peyrou M, Populaire C, Zulianello
L, Meda P: Connexin36 and pancreatic beta-cell functions.
Arch Physiol Biochem 2006, 112:74-81.
23. Meda P: The role of gap junction membrane channels in
secretion and hormonal action. J Bioenerg Biomembr 1996,
28:369-377.
24. Philippe J, Giordano E, Gjinovci A, Meda P: Cyclic adenosine
monophosphate prevents the glucocorticoid-mediated inhi-
bition of insulin gene expression in rodent islet cells. J Clin
Invest 1992, 90:2228-2233.
25. Meda P, Bosco D, Chanson M, Giordano E, Vallar L, Wollheim C, Orci
L: Rapid and reversible secretion changes during uncoupling
of rat insulin-producing cells. J Clin Invest 1990, 86:759-768.
26. Caton D, Calabrese A, Mas C, Serre-Beinier V, Charollais A, Caille D,
Zufferey R, Trono D, Meda P: Lentivirus-mediated transduction
of connexin cDNAs shows level- and isoform-specific altera-
tions in insulin secretion of primary pancreatic beta-cells. J
Cell Sci 2003, 116:2285-2294.
27. Calabrese A, Zhang M, Serre-Beinier V, Caton D, Mas C, Satin LS,
Meda P: Connexin 36 controls synchronization of Ca2+ oscil-
lations and insulin secretion in MIN6 cells. Diabetes 2003,
52:417-424.
28. Ravier MA, Guldenagel M, Charollais A, Gjinovci A, Caille D, Sohl G,
Wollheim CB, Willecke K, Henquin JC, Meda P: Loss of connexin36
channels alters beta-cell coupling, islet synchronization of
glucose-induced Ca2+ and insulin oscillations, and basal insu-
lin release. Diabetes 2005, 54:1798-1807.
29. Meda P, Bruzzone R, Chanson M, Bosco D, Orci L: Gap junctional
coupling modulates secretion of exocrine pancreas. Proc Natl
Acad Sci USA 1987, 84:4901-4904.
30. Vozzi C, Ullrich S, Charollais A, Philippe J, Orci L, Meda P: Adequate
connexin-mediated coupling is required for proper insulin
production. J Cell Biol 1995, 131:1561-1572.
31. In't Veld PA, Pipeleers DG, Gepts W: Glucose alters configura-
tion of gap junctions between pancreatic islet cells. Am J Phys-
iol 1986, 251:C191-196.
32. Allagnat F, Martin D, Condorelli DF, Waeber G, Haefliger JA: Glu-
cose represses connexin36 in insulin-secreting cells. J Cell Sci
2005, 118:5335-5344.
33. Chay TR, Keizer J: Minimal model for membrane oscillations in
the pancreatic beta-cell. Biophys J 1983, 42:181-190.
34. Rinzel J, Chay TR, Himmel D, Atwater I: Prediction of the glucose-
induced changes in membrane ionic permeability and
cytosolic Ca2+ by mathematical modeling. Adv Exp Med Biol
1986, 211:247-263.
35. Bertram R, Previte J, Sherman A, Kinard TA, Satin LS: The phantom
burster model for pancreatic beta-cells. Biophys J 2000,
79:2880-2892.
36. Sherman A, Rinzel J, Keizer J:
Emergence of organized bursting
in clusters of pancreatic beta-cells by channel sharing. Biophys
J 1988, 54:411-425.
37. Sherman A, Rinzel J: Model for synchronization of pancreatic
beta-cells by gap junction coupling. Biophys J 1991, 59:547-559.
38. Smolen P, Rinzel J, Sherman A: Why pancreatic islets burst but
single beta cells do not. The heterogeneity hypothesis. Bio-
phys J 1993, 64:1668-1680.
39. Bertuzzi F, Ricordi C: Prediction of clinical outcome in islet
allotransplantation. Diabetes Care 2007, 30:410-417.
40. Nittala A, Ghosh S, Wang X: Investigating the Role of Islet
Cytoarchitecture in Its Oscillation Using a New beta-Cell
Cluster Model. PLoS ONE 2007, 2:e983.
41. Hellman B, Gylfe E, Bergsten P, Grapengiesser E, Lund EP, Berts A,
Tengholm A, Pipeleers GD, Ling Z: Glucose induces oscillatory
Ca2+ signalling and insulin release in human pancreatic beta
cells. Diabetologia 1994, 37(Suppl 2):S11-20.
42. Gylfe E, Ahmed M, Bergsten P, Dansk H, Dyachok O, Eberhardson M,
Grapengiesser E, Hellman B, Lin MJ, Sundsten T, Tengholm A, Vieira
E, Westerlund J: Signaling underlying pulsatile insulin secre-
tion. Ups J Med Sci 2000, 105:35-51.
43. Charollais A, Gjinovci A, Huarte J, Bauquis J, Nadal A, Martin F,
Andreu E, Sanchez-Andres JV, Calabrese A, Bosco D, Soria B, Woll-
heim CB, Herrera PL, Meda P: Junctional communication of pan-
creatic beta cells contributes to the control of insulin
secretion and glucose tolerance. J Clin Invest 2000, 106:235-243.
44. Brissova M, Fowler MJ, Nicholson WE, Chu A, Hirshberg B, Harlan
DM, Powers AC: Assessment of human pancreatic islet archi-
tecture and composition by laser scanning confocal micros-
copy. J Histochem Cytochem 2005, 53:1087-1097.
45. Cabrera O, Berman DM, Kenyon NS, Ricordi C, Berggren P-O, Ale-
jandro Caicedo A: The unique cytoarchitecture of human pan-
creatic islets has implications for islet cell function. Proc Natl
Acad Sci USA 2006, 103:2334-2339.
46. Lomb N: Least-squares frequency analysis of unevenly spaced
data. Astrophysics and Space Science 1976, 39:447-462.
47. Scargle J: Studies in astronomical time series analysis. II. Sta-
tistical aspects of spectral analysis of unevenly sapaced data.
Astrophysical Journal 1982, 263:835-853.
48. Rhodes CJ: Type 2 diabetes-a matter of beta-cell life and
death? Science 2005, 307:380-384.
49. Meier JJ: Beta cell mass in diabetes: a realistic therapeutic tar-
get? Diabetologia 2008, 51:703-713.
50. Speier S, Gjinovci A, Charollais A, Meda P, Rupnik M: Cx36-medi-
ated coupling reduces beta-cell heterogeneity, confines the
Publish with BioMed Central and every
scientist can read your work free of charge
"BioMed Central will be the most significant development for
disseminating the results of biomedical research in our lifetime."
Sir Paul Nurse, Cancer Research UK
Your research papers will be:
available free of charge to the entire biomedical community
peer reviewed and published immediately upon acceptance
cited in PubMed and archived on PubMed Central
yours — you keep the copyright
Submit your manuscript here:
/>BioMedcentral
Theoretical Biology and Medical Modelling 2008, 5:17 />Page 13 of 13
(page number not for citation purposes)
stimulating glucose concentration range, and affects insulin
release kinetics. Diabetes 2007, 56:1078-1086.
51. Mears D, Sheppard FN Jr, Atwater I, Rojas E: Magnitude and mod-
ulation of pancreatic beta-cell gap junction electrical con-
ductance in situ. J Membr Biol 1995, 146:163-176.
52. Perez-Armendariz M, Roy C, Spray CD, Bennett VM: Biophysical
properties of gap junctions between freshly dispersed pairs
of mouse pancreatic beta cells. Biophys J 1991, 59:76-92.
53. Foulis KA: C. L. Oakley lecture (1987). The pathogenesis of
beta cell destruction in type I (insulin-dependent) diabetes
mellitus. J Pathol 1987, 152:141-148.
54. Ryan AE, Paty WB, Senior AP, Bigam D, Alfadhli E, Kneteman MN,
Lakey RJ, Shapiro MA: Five-year follow-up after clinical islet
transplantation. Diabetes 2005, 54:2060-2069.
55. Bertram R, Satin L, Zhang M, Smolen P, Sherman A: Calcium and
glycolysis mediate multiple bursting modes in pancreatic
islets. Biophys J 2004, 87:3074-3087.
56. Goldbeter A, Lefever R: Dissipative structures for an allosteric
model. Application to glycolytic oscillations. Biophys J 1972,
12:1302-1315.
57. Wierschem K, Bertram R: Complex bursting in pancreatic
islets: a potential glycolytic mechanism. J Theor Biol 2004,
228:513-521.
58. Pedersen MG, Bertram M, Sherman A: Intra- and Inter-islet Syn-
chronization of Metabolically Driven Insulin Secretion. Bio-
physical Journal 2005, 89:107-119.
59. Araki E, Oyadomari S, Mori M: Endoplasmic reticulum stress and
diabetes mellitus. Intern Med 2003, 42:7-14.
60. Bertram R, Sherman A: A calcium-based phantom bursting
model for pancreatic islets. Bull Math Biol 2004, 66:1313-1344.
61. Fridlyand LE, Harbeck MC, Roe MW, Philipson LH: Regulation of
cAMP dynamics by Ca2+ and G protein-coupled receptors in
the pancreatic beta-cell: a computational approach. Am J
Physiol Cell Physiol 2007, 293:C1924-1933.
62. Fridlyand LE, Ma L, Philipson LH: Adenine nucleotide regulation
in pancreatic beta-cells: modeling of ATP/ADP-Ca2+ inter-
actions. Am J Physiol Endocrinol Metab 2005, 289:E839-848.
63. Fridlyand LE, Tamarina N, Philipson LH: Modeling of Ca2+ flux in
pancreatic beta-cells: role of the plasma membrane and
intracellular stores. Am J Physiol Endocrinol Metab 2003,
285:E138-154.
64. Diederichs F: Mathematical simulation of membrane proc-
esses and metabolic fluxes of the pancreatic beta-cell. Bull
Math Biol 2006, 68:1779-1818.
65. Schuster S, Marhl M, Hofer T: Modelling of simple and complex
calcium oscillations. From single-cell responses to intercellu-
lar signalling. Eur J Biochem 2002, 269:1333-1355.
66. Zhang M, Goforth P, Bertram R, Sherman A, Satin L: The Ca2+
dynamics of isolated mouse beta-cells and islets: implications
for mathematical models. Biophys J 2003, 84:2852-2870.
67. Sherman A: Contributions of modeling to understanding stim-
ulus-secretion coupling in pancreatic beta-cells. Am J Physiol
1996, 271:E362-372.
68. de Vries G, Sherman A: From spikers to bursters via coupling:
help from heterogeneity. Bull Math Biol 2001, 63:371-391.
69. Nadal A, Quesada I, Soria B: Homologous and heterologous
asynchronicity between identified alpha-, beta- and delta-
cells within intact islets of Langerhans in the mouse. J Physiol
1999, 517(Pt 1):85-93.