Báo cáo y học: " Analysis of novel geometry-independent method for dialysis access pressure-flow monitoring" pdf
Bạn đang xem bản rút gọn của tài liệu. Xem và tải ngay bản đầy đủ của tài liệu tại đây (474.42 KB, 12 trang )
Theoretical Biology and Medical
Modelling
BioMed Central
Open Access
Research
Analysis of novel geometry-independent method for dialysis access
pressure-flow monitoring
William F Weitzel*1, Casey L Cotant1, Zhijie Wen2, Rohan Biswas1,
Prashant Patel1, Harsha Panduranga1, Yogesh B Gianchandani2 and
Jonathan M Rubin1
Address: 1School of Medicine, University of Michigan, Ann Arbor, MI, USA and 2College of Engineering, University of Michigan, Ann Arbor, MI,
USA
Email: William F Weitzel* - ; Casey L Cotant - ; Zhijie Wen - ;
Rohan Biswas - ; Prashant Patel - ; Harsha Panduranga - ;
Yogesh B Gianchandani - ; Jonathan M Rubin -
* Corresponding author
Published: 5 November 2008
Theoretical Biology and Medical Modelling 2008, 5:22
doi:10.1186/1742-4682-5-22
Received: 21 August 2008
Accepted: 5 November 2008
This article is available from: />© 2008 Weitzel et al; licensee BioMed Central Ltd.
This is an Open Access article distributed under the terms of the Creative Commons Attribution License ( />which permits unrestricted use, distribution, and reproduction in any medium, provided the original work is properly cited.
Abstract
Background: End-stage renal disease (ESRD) confers a large health-care burden for the United
States, and the morbidity associated with vascular access failure has stimulated research into
detection of vascular access stenosis and low flow prior to thrombosis. We present data
investigating the possibility of using differential pressure (ΔP) monitoring to estimate access flow
(Q) for dialysis access monitoring, with the goal of utilizing micro-electro-mechanical systems
(MEMS) pressure sensors integrated within the shaft of dialysis needles.
Methods: A model of the arteriovenous graft fluid circuit was used to study the relationship
between Q and the ΔP between two dialysis needles placed 2.5–20.0 cm apart. Tubing was varied
to simulate grafts with inner diameters of 4.76–7.95 mm. Data were compared with values from
two steady-flow models. These results, and those from computational fluid dynamics (CFD)
modeling of ΔP as a function of needle position, were used to devise and test a method of
estimating Q using ΔP and variable dialysis pump speeds (variable flow) that diminishes dependence
on geometric factors and fluid characteristics.
Results: In the fluid circuit model, ΔP increased with increasing volume flow rate and with
increasing needle-separation distance. A nonlinear model closely predicts this ΔP-Q relationship
(R2 > 0.98) for all graft diameters and needle-separation distances tested. CFD modeling suggested
turbulent needle effects are greatest within 1 cm of the needle tip. Utilizing linear, quadratic and
combined variable flow algorithms, dialysis access flow was estimated using geometry-independent
models and an experimental dialysis system with the pressure sensors separated from the dialysis
needle tip by distances ranging from 1 to 5 cm. Real-time ΔP waveform data were also observed
during the mock dialysis treatment, which may be useful in detecting low or reversed flow within
the access.
Conclusion: With further experimentation and needle design, this geometry-independent
approach may prove to be a useful access flow monitoring method.
Page 1 of 12
(page number not for citation purposes)
Theoretical Biology and Medical Modelling 2008, 5:22
Background
Dialysis access blood volume flow and pressure may be
helpful parameters in end-stage renal disease (ESRD) vascular access monitoring. [1-5] The magnitude of the clinical problem is well recognized, with 330,000 dialysis
patients with ESRD in the U.S., and the cost of maintaining dialysis access in the care of these patients is over $1
billion in the U.S. alone, which represents approximately
10% of the total cost of dialysis care.[6,7] The recently
updated National Kidney Foundation (NKF) Dialysis
Outcomes and Quality Initiative (DOQI) recommendations have reaffirmed the recommendation for monitoring using monthly measurement of flow or static venous
pressure as the preferred methods.[8] Monthly flow monitoring may lead to as much as a 50% reduction in access
failure,[9] yet this number still represents 25% of patients
with grafts experiencing failure (thrombosis or clotting)
per year, which requires emergency treatment to re-establish flow. Divergent opinions exist about the utility of
flow monitoring, partly fueled by the relatively infrequent
(e.g., monthly) flow monitoring interval. [10-12] Since it
may be practical to follow access pressure more frequently,[13] some have advocated pressure monitoring
over flow monitoring.[14] Additionally, it should be
noted that other data support the cost effectiveness of
access flow monitoring even when performed less frequently,[15] and that the combined sensitivity and specificity improves,[16] and cost effectiveness improves,[17]
when flow monitoring frequency is increased.
Our group is investigating the possibility of using differential pressure (ΔP) monitoring to estimate access flow
for dialysis access monitoring, with the current study
aimed at developing and testing an access geometry-independent algorithm that is convenient to perform throughout dialysis or at least at every dialysis session. The
underlying assumption is that flow along with pressure
monitoring may be a more complete representation of the
hemodynamic status of the access. Furthermore, frequent
and convenient flow estimations may improve monitoring by determining each patient's mean access flow and
standard deviation in flow. Additionally, this would allow
the change in access blood flow with ultrafiltration and
blood pressure reduction to be followed, just as blood
pressure and various machine parameters are followed
during dialysis. However, several engineering problems
must be addressed to make this approach clinically practical.
While pressure measurements within the access have been
used as an indicator of stenosis (which partially obstructs
flow and alters access pressure), pressure differences
within the dialysis graft or fistula have not typically been
used to estimate flow. This is primarily because wellestablished fluid dynamics models require knowledge or
/>
estimation of access geometry, needle separation, and
fluid properties, such as viscosity, to determine flow.[18]
This study derived experimental data on the relationship
between access flow and ΔP between two dialysis access
needles in a model of the arteriovenous graft (AVG) vascular circuit. This geometry-dependent data was used to
devise methods and perform experiments that estimate
access flow using ΔP and variable dialysis pump speeds
while being mathematically independent of geometric
factors and fluid characteristics. We present a potentially
useful geometry-independent method, modeling data,
and experimental results for flow determination using
intra-access ΔP and its dependence on dialysis pump
speed. Implementation of this method will require the
development of new dialysis needle technology or intraaccess ΔP measurement devices to allow for intra-access
pressure measurement during dialysis, work that is currently in progress. These data suggest that this approach or
subsequent permutations may result in easy to use, operator-independent alternative methods of access monitoring to improve future access monitoring strategies.
Materials and methods
Experimental Steady-Flow AVG Circuit
A fluid circuit model of the AVG vascular circuit was developed to study the relationship between access flow (Q)
and the ΔP between two dialysis access needles placed 2.5,
5, 10, 15, and 20 cm from one another within the circuit.
A Masterflex Console Drive non-pulsatile blood roller
pump (Cole Parmer, Vernon Hills, IL) was utilized to
draw a glycerol-based fluid, with a kinematic velocity of
0.029 cm2/s (corresponding to a hematocrit of approximately 37%), from a fluid reservoir. The fluid was channeled to a Gilmont flow meter (Thermo Fisher Scientific,
Waltham, MA), which was calibrated using the 37% glycerol solution. The fluid subsequently flowed back to the
fluid reservoir before returning to the pump in a closed
circuit. The polyvinyl tubing used in the circuit had inner
diameters of 4.76 mm (3/16"), 6.35 mm (1/4"), and 7.95
mm. The 16-guage needles were primed with the 37%
glycerol solution, and a digital pressure monitor (model
PS409, Validyne, Northridge, CA) was used to directly
measure ΔP between the "upstream" and "downstream"
needles, in millimeters of mercury. Digital data were
downloaded to a PC using data acquisition hardware and
software (DATAQ Instruments, Akron, OH). During
steady-state flow, the pressure monitor was observed for
20–30 seconds, until the reading stabilized, before recording the value.
Experimental values were compared to the theoretical
results from two well-established steady flow models,
which are first-order approximations to pulsatile flow.
One of the best described solutions for laminar flow
through a straight circular tube of constant cross section is
Page 2 of 12
(page number not for citation purposes)
Theoretical Biology and Medical Modelling 2008, 5:22
/>
the Hagen-Poiseuille (hereafter, Poiseuille) equation.[19]
This equation for laminar flow was evaluated as follows:[18]
128μQL G
,
(1)
4
π DG
in which μ is the dynamic viscosity of the liquid, LG is the
length of the graft, and DG4 refers to the inner diameter of
the graft raised to the 4th power. With this equation, the
relationship between ΔP and Q is linear. For each tube
inner diameter and at each distance of separation, ten
measurements were taken at each flow rate. The mean,
standard deviation, and correlation coefficient values
between Poiseuille's model and the experimental data
were calculated.
ΔP =
Similarly, Young's general expression for a flow ratedependent pressure drop between two locations where a
liquid flows through a channel was evaluated:[20,21]
ΔP = RaV + RbV2,
(2)
where ΔP represents the pressure difference between the
downstream and upstream locations, V is area-averaged
flow velocity in an unobstructed vessel, and Ra and Rb are
coefficients that depend on obstacle geometry and fluid
properties. Young's expression was chosen as one of the
simplest models incorporating higher order terms (Q
raised to the second power) that may be used to characterize turbulent flow resulting from higher velocity flow conditions with higher Reynolds numbers, geometry-induced
flow disturbances from vessel diameter change or intraluminal irregularities, as well as cannulas within the flow
path. [18-20]
Correlation coefficients were calculated to evaluate the fit
of the data to Poiseuille's linear model and Young's second-order polynomial equation. To establish dynamic
similitude between our in vitro model and the in vivo AVG
circuit, Reynolds numbers were calculated for each flow
rate and for each of the three separate AVG inner diameters based on the expression Re = ρvD/μ, where ρ is the
density of the fluid (1090.04 kg/m3), v is the velocity 4 Q/
πD2, D is the inner diameter of the tube, and μ is the
dynamic viscosity (0.0032 kg/ms).[18]
Experimental Variable Flow Dialysis Circuit
To test the geometry-independent algorithms for flow
determination, we constructed a laboratory flow phantom
system comprising the dialysis blood pump system
described above communicating in parallel with a patient
blood circuit. Access diameters of 4.76- and 6.35-mm
inner diameter were used to approximate AVG inner
diameters. The dialysis circuit was assembled to generate
measurable flow rates using the adjustable non-pulsatile
roller pump, the Gilmont flow meter calibrated to ensure
the accuracy of simulated dialysis pump speeds ranging
from 0 to 500 mL/min, and an S-110 digital flow meter
(McMillan, Georgetown, TX). The dialysis circuit was connected to the dialysis graft with 15-gauge dialysis needles
(Sysloc, JMS Singapore PTE LTD, Singapore). The dialysis
access was simulated using vinyl tubing (Watts Water
Technologies, North Andover, MA). The patient blood circuit was modeled using a pulsatile adjustable blood pump
(Harvard Apparatus, Holliston, MA) in series with a bubble trap (ATS Laboratories, Bridgeport, CT) to act as a large
capacitance vessel. This was in series with the access graft,
which had been cannulated with the dialysis needles from
the dialysis circuit. A downstream air trap was also located
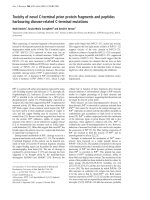
within the patient circuit. Pressure sensing within the conduit was achieved using 21-gauge spinal needles positioned with needle tips 5, 2 and 1 cm from the upstreamfacing arterial needle and the downstream-facing venous
needle tip. The model flow circuit is depicted in Figure 1.
Experimental data were collected at pulsatile pump speeds
of 400, 800, and 1200 mL/min, simulating these dialysis
access flow rates, and the dialysis pump speed was varied
from 0 to 400 mL/min, simulating dialysis pump "off"
and "on" conditions, respectively, for each access diameter (4.76 and 6.35 mm), with 20-cm dialysis needle separation, at variable pressure sensor needle distances (1 to 5
cm) from the intraluminal dialysis needle tip. Fluid viscosity was 0.29 centistokes, corresponding to hematocrit
of 37%.
Derivation of Geometry-independent Models
The pressure drop between needles may be represented by
numerous fluid dynamics models representing the blood
flow through a dialysis conduit. The pressure in these
models depends to varying degrees on polynomial expressions of the flow raised to integer or fractional powers.[18,20] Although many of these are straightforward
algebraic expressions, the models become rather complicated to implement in clinical practice because, in addition to relating flow and pressure, they contain additional
parameters such as the dialysis needle separation (or distance along the dialysis access where pressure difference is
measured), access diameter (or potentially more complicated forms expressing dialysis access geometry), and factors affecting fluid flow such as blood viscosity. With any
of these relationships, it is understood that pressure is
always with respect to a reference pressure. Therefore, if
needle pressure is used, the pressure difference between
the arterial (PA) and venous (PV) needle sites in the dialysis access is the ΔP between sensors (ΔPAV). Since PV, as
it is used in dialysis access monitoring currently, is the relative pressure between the venous needle site and atmospheric pressure, and since PA is the relative pressure
Page 3 of 12
(page number not for citation purposes)
Theoretical Biology and Medical Modelling 2008, 5:22
/>
Figure 1
Schematic of flow circuit
Schematic of flow circuit. Model of patient blood flow system to test geometry-independent algorithms for flow determination.
between the arterial needle site and atmospheric pressure,
PV-PA gives the relative pressure between the two needle
sites indirectly using two pressure readings with the same
reference pressure (in this case atmospheric pressure), and
ΔPAV may be determined by direct measurement of the
pressure difference between the two points using a single
pressure measurement transducer.
In general, any mathematical relationship (so-called function F) that allows one to map (in a mathematical sense)
Page 4 of 12
(page number not for citation purposes)
Theoretical Biology and Medical Modelling 2008, 5:22
/>
the two or more pressure measurements to determine the
volume flow (Q) or velocity (v) in the blood circuit may
be used. This may take the general form:
F(PV, PA) = Q
(3)
Alternatively, their inverse relationships may be utilized.
These functions may be determined from theoretical principles, or F (or approximations of F) may be determined
from values derived from experiments or clinical data and
applied to make measurements of Q or v in practice.
A pulsatile-flow model relating pressure to flow is not
used here; rather, we employ a first-order approximation
with steady flow to allow us to test the method of measurement being evaluated. Based on theoretical grounds of
using laminar flow with linear pressure-flow relationships
and our experimental system showing pressure-flow relationships fitting a second-order polynomial, we selected
two relationships to test, one in which pressure is related
to the square of flow and one in which pressure is related
linearly to flow. Other mathematical relationships may
take alternative algebraic, numerical, or other mathematical forms.
Using Diverted Dialysis Pump Flow To Determine Access
Flow
Methods that exploit the decreasing blood flow between
the needles within the access as blood is pumped through
the circuit during dialysis take advantage of changes in
pressure within this segment of the access. The effects of
needle tip flow must be considered whenever the needle
tip flow disturbance is near the pressure transducer; precisely how near or far the transducer must be from the
needle tip must be determined from modeling, such as
computational fluid dynamics (CFD), and experimental
results, such as those presented in this study.
One physical system exploiting this method involves pressure transducers integrated on the outside of the shaft. The
measurement method outlined below will be tested with
needle designs in the future based on the experimental
results presented in this study. A micro-electro-mechanical systems (MEMS) manufacturing method referred to as
micro-electro-discharge machining (EDM) has been used
for three-dimensional machining of cavities in needle
shafts for MEMS sensor integration within needles.[22]
The possibility of using this type of approach is also supported by our previous work using analogous extracorporeal measurement methods employing Doppler
signals.[16,23,24]
Geometry- and fluid-dependent models can be used with
any ΔP monitoring system.[20] However, given the uncertainty in the physical system and changes in vessel geom-
etry that may occur over time, it may be advantageous to
use geometry-independent modeling as a means of independently validating the measurements. In general, geometry-independent modeling can be performed if a
tractable modeling relationship can be developed,
exploiting the flow-dependent differential changes within
the access, between the needles, as a result of changing the
dialysis pump speed. The access blood flow rate (QA)
depends on numerous factors, including systemic blood
pressure and central venous pressure (reflecting pre- and
post-access pressure gradients), access geometry (and
thereby resistance), and blood viscosity, to name a few.
Two needles are introduced into the access lumen during
conventional dialysis; one for the removal of blood (arterial) to pass through the dialysis circuit and one for the
return of blood (venous) to the circulation. For the purposes of testing this ΔP-based method, the arterial needle
is facing upstream and the venous needle is facing downstream. The flow through the graft or fistula remaining
downstream (QR) from the arterial needle will decrease
during dialysis as a function of the blood flowing through
the dialysis circuit at a blood pump flow rate (QB). To the
extent that the net flow through the system does not
change, this flow rate through the portion of the access
between the dialysis needles (QR) will follow the relationship QR = QA - QB.[23,24] Other modeling functions can
be constructed to model net changes in QA as a function
of QB, but are not considered here for the sake of simplicity.
The ΔP between the needles will decrease as QB increases
and QR decreases. While other observable signals that are
predictably related to volume flow may have utility in this
method, we will focus on ΔP (the pressure difference
between the needles). The signal ΔP is measured and
related mathematically to QB using a modeling function
constructed for this signal F(QB) based on the measured
values such that ΔP = F(QB). This modeling function may
take the form of any algebraic or numerical function (preferably, but not necessarily, one-to-one in the range and
domain of interest): linear, polynomial, exponential or
otherwise. As QR decreases with increasing QB, the signal
ΔP = F(QB) will decrease. As QR approaches zero, ΔP will
approach zero, or a known value for ΔP that corresponds
to zero blood flow QR. For our purposes in evaluating this
method, zero or near zero time-averaged mean ΔP will
correspond to zero volume flow QR. We can define this
value using the modeling function as the signal S0 = F(0).
This value for F(0) corresponds to the value for QB = QA,
since QR = 0. QB at the value QA can be solved by calculating the projected intercept of the modeling function
where ΔP = 0 or the known value for ΔP corresponding to
zero mean flow between the needles. These calculations
can be performed numerically by determining the inverse
function of the modeling function or by solving them
Page 5 of 12
(page number not for citation purposes)
Theoretical Biology and Medical Modelling 2008, 5:22
/>
algebraically. To evaluate the method most simply, we
evaluated a quadratic and linear form of the relationship
between ΔP and access flow Q, with two dialysis pump
speeds (pump "on" and pump "off"). For one expression,
we have ΔP = CQ, in general, where C is a parametric constant containing geometric and rheologic factors. We
define Poff = CQA and Pon = C(QA - QB) as the ΔP for
pump off and pump on, respectively. Solving for the
access flow QA gives the linear model:
imental data and CFD results demonstrate a combination
of linear (laminar) and quadratic (turbulent) flow patterns, we would anticipate that a geometry-independent
model may represent a combination of these models.
Most simply this may be an average of Equations 4 and 5
to yield the combined model:
QA = QB/(1 - Pon/Poff).
or a more complex combination with components
accounting for laminar and turbulent flow patterns. The
important feature of any of these models is that they are
geometry and viscosity independent. We note that in the
above, all flows are considered as time-averaged means to
eliminate the need for phase information.
(4)
For a second expression, we have ΔP = C(QA)2, and we
define Poff = C(QA)2 and Pon = C(QA - QB)2 as the ΔP for
pump off and pump on, respectively. Solving for the
access flow QA gives the quadratic model:
QA = QB/(1 - √(Pon/Poff)),
(5)
where QA depends on QB and the square root of the ratio
of Pon and Poff. Importantly, notice that all of the geometric access and needle position parameters as well as the
blood viscosity parameters contained in the term C have
been eliminated from Equations 4 and 5. Therefore,
although these parameters may be helpful in estimating
flow from pressure, we have developed a method and
derived an expression for determining flow from pressure
that does not depend on these factors.
Real-time Flow Estimation
An expression for real-time flow estimation (without
altering the pump rate) can be tested using these experimental data. A parametric value for C (geometric and rheologic factors) can be used for C and estimated from the
variable flow method: C = Poff/(QA)2. Substituted into Pon
= C(QA - QB) and solving for QA gives
QA = QB + √(Pon/C),
(6)
where QA can be followed in real time without altering
the pump rate by tracking the square root of the ratio of
ΔP with pump on (Pon) and C and adding this to the
pump rate QB.
An analogous relationship can be determined using Equation 4, yielding
QA = QB + Pon/C,
(7)
should pressure vary linearly with flow. It should be noted
that in practice it is anticipated that the pump may be
briefly paused to re-calculate C to adjust for factors that
may change during dialysis (e.g., ultrafiltration raising the
hematocrit and altering viscosity) and then restarted to
resume tracking QA in real time. Similarly, because exper-
QA = (QB/2)(1/(1 - Pon/Poff) + 1/(1 - √(Pon/Poff)),
(8)
Results
Geometry-dependent Modeling
For each of the three tubes of varying inner diameter, ΔP
increases as the volume flow rate increases, and there is a
consistent increase in measured ΔP with increasing needle-separation distance. The non-linear curves demonstrate an apparent polynomial ΔP dependence on flow
rate. This relationship appears to be more pronounced at
needle separations >2.5 cm.
The data for each of the three tubes of varying inner diameter were matched to Poiseuille's (laminar flow) and
Young's (turbulent flow) equations for Reynolds numbers
less than and greater than, respectively, an approximate
transitional value of 2100, where the transition between
laminar and turbulent flow usually occurs.[25] For all
tube diameters and needle separation distances, correlation coefficients were consistently higher (R2 > 0.9828) for
Young's equation compared with Poiseuille's (0.8449–
0.9484). For the 4.76-mm tube, Reynolds numbers were
<2100 for all flows <1387 mL/min. For the 6.35-mm
tube, only the 1968-mL/min flow demonstrated a Reynolds number >2100. All Reynolds numbers were <2100
for the 7.95-mm-inner-diameter tube.
As graft inner diameter decreases, the mean ΔP also predictably increases. In addition, as Q increases for a given
inner diameter, mean ΔP increases, with this relationship
being most pronounced for the 4.76-mm-diameter tube.
One final observation from the steady flow experiments is
that ΔP increases with increasing distance between the
two access needles. This relationship becomes more pronounced as the access flow increases, with the magnitude
of the mean ΔP values being substantially greater using
the 4.76-mm vs. the 7.95-mm-inner-diameter tube.
Page 6 of 12
(page number not for citation purposes)
Theoretical Biology and Medical Modelling 2008, 5:22
Computational Fluid Dynamics (CFD) Modeling
A family of CFD modeling curves was generated using
FLUENT software (version 6.3, Fluent, Inc, Lebanon, NH).
The pressure at the entrance of the tubing was set at
atmospheric pressure (760 mmHg). The main meshing
element applied to the cylinder geometry was "Tet/
Hybrid," which specifies that the mesh is composed primarily of tetrahedral elements but may include hexahedral, pyramidal, and wedge elements where appropriate.
In this model a "sink" is introduced upstream within the
dialysis access to model the blood being drawn from the
dialysis access through the arterial needle to the dialysis
machine at a pump rate of 400 mL/min. A "source" is
introduced downstream at a needle separation distance of
10 cm to model the venous needle returning blood to the
dialysis access at a flow rate of 400 mL/min. ΔP is plotted
along the y-axis, with distance along the vascular access
plotted along the x-axis, thereby plotting the pressure
drop along the length of the access longitudinally for a
family of access flows Q. The Reynolds numbers >2300
for blood exiting the dialysis needles suggest blood flow is
turbulent in dialysis needles,[26] becoming laminar again
within the dialysis access. Anticipated from the models
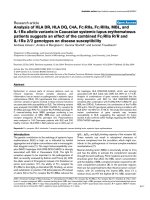
derived above, Figure 2 illustrates that the slope of ΔP
/>
changes at the position of the arterial and venous needles,
showing a lower slope between the needles as a function
of the reduced flow in the access QR between the needles.
Of importance, the CFD analysis allows estimation of
regional pressure variations induced by needle tip turbulence to provide information about how close a pressure
sensor may be to the needle tip while estimating the ΔP
along the access between the needles. The flow profiles
and needle tip effects were examined using CFD for access
flows of 400, 800, and 1200 mL/min with pump on and
off at pump rates of 400 mL/min in the center of the
lumen and off axis within the dialysis access conduit. We
performed CFD analysis under multiple conditions, using
pressure tracing as a function of position along the inner
diameter of the access and along lines parallel to the axis
of the access. These showed constant features as represented in Figure 2, demonstrating that needle tip effects
were greatest within 1 cm of the needle tip upstream or
downstream from the upstream-facing arterial needle,
and within 1 cm upstream of the downstream-facing
venous needle, but several centimeters downstream from
the venous needle with the dialysis pump on.
Figure 2
Pressure as function of needle position
Pressure as function of needle position. Absolute pressure vs. position of arterial and venous needles within access with
flow 1200 mL/min, pump on at 400 mL/min.
Page 7 of 12
(page number not for citation purposes)
Theoretical Biology and Medical Modelling 2008, 5:22
Variable Flow Pressure (VFP) Modeling Results Using Flow
Pressure Data
The flow-pressure relationship data were used to test the
linear (laminar) and quadratic (turbulent) VFP modeling
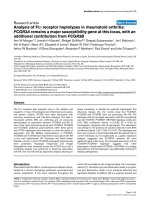
functions derived above. VFP modeling Equation 4 (linear) and Equation 5 (quadratic) were used to estimate
flows, and results are shown in Figures 3A and 3B for 4.76mm and 6.35-mm-inner-diameter access data, respectively, with standard deviation (10 measurements for each
flow) and line of identity shown. It is important to note
that these flow estimations used models with no geometry- or viscosity-dependent terms (see derivation of Equations 1 and 3 above).
As Figure 3 illustrates, VFP modeling Equation 4 (linear
model) consistently yielded lower than true volume flow
results, and Equation 5 (quadratic model) generally
yielded values equal to or above those of true flow. The
VFP modeling expressions for linear, quadratic and combined (Equation 8) models were tested using the experimental system in Figure 1 with intraluminal pressure
sensing. The results obtained using the experimental system described in the Methods section above are shown for
the 4.76- and 6.35-mm-diameter accesses in Figures 4A
and 4B, respectively.
Experimental results for the VFP modeling Equation 4
(linear) yielded lower than true volume flow results for
the 4.76-mm-diameter access and better approximated
the flow in the 6.35-mm-diameter access. The results for
Equation 5 (quadratic model) yielded values higher than
those of true flow in both access diameters. Results were
consistent for sensor needle distances 1, 2, and 5 cm from
the dialysis needle tips.
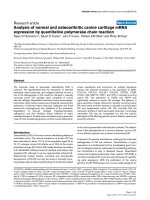
Results of real-time waveform information obtained during monitoring are shown in Figure 5. The waveform
information reveals that while the pump is off (pump
speed = 0), the pulsatility in the pressure gradient between
the sensor needles corresponds to the higher pressure gradient and higher flow during systole and correspondingly
lower pressure gradients and flows during diastole. When
the pump is turned on, an interesting phenomenon is
observed: The net pressure gradient between the needles is
slightly more than zero. This corresponds to slight net forward flow between the needles while the pump is on.
However, what is also seen is that the systolic pressure gradient between the needles is greater than zero during systole, and the diastolic pressure gradient is less than zero.
This corresponds to flow in the forward direction during
systole and retrograde flow in the access during diastole.
Analogous results were seen in a previous study in vivo[24]
using Doppler measurements of flow between the dialysis
needles during dialysis, and the pressure gradients in this
/>
experimental system corroborate the prior clinical Doppler flow findings.
The pressure gradients will correspond to alternating flow
in either direction and may result in access recirculation
depending on the duration of the retrograde flow and needle separation. If the retrograde distance traversed by the
blood during the retrograde flow period is greater than the
needle separation, then recirculation will develop. The
threshold for developing recirculation can be determined
by integrating the velocity of reversed (retrograde) blood
flow over the time period when flow is reversed within the
cardiac cycle. The velocity may be defined simply as v(t) =
Q/A, where A is the cross-sectional area and Q is the flow
determined from ΔP. A more accurate but complicated Q
can be obtained using CFD modeling. For access recirculation to take place, the blood is required to traverse the
distance between the needles. This distance D(v, t) for
recirculation to develop can be determined by integrating:
t1
D( v , t) =
∫ v(t)dt,
(9)
t2
where t1 is the point in time when retrograde flow starts
(when the ΔP signal begins to become negative) during
the cardiac cycle, and t2 is the point in time when flow
becomes forward again (when the ΔP signal begins to
become positive) during the cardiac cycle.
Discussion
The motivation for investigating these relationships is the
desire to have readily available dialysis access flow estimation for use at each treatment, or even multiple times during each treatment, without disrupting the dialysis
session. While there is argument about the utility of access
flow monitoring, it should be recognized that the current
state of flow monitoring technology makes frequent and
easy measurements throughout each dialysis treatment
impractical. ΔP may allow more frequent monitoring by
using either dialysis needle ΔPs or newly evolving MEMS
technology for integration of pressure sensors within needle shafts or graft materials.
Since geometric factors must be used for geometrydependent modeling, ΔP measurements will be based
upon approximations or assumptions about graft geometry. As needle separation varies linearly with ΔP, this too
will need to be estimated for standard ΔP monitoring
strategies. Alternatively, a reference measurement may be
made with indicator dilution or Duplex ultrasound to
establish a reference flow value when ΔPs are measured.
Trends can then be followed at each treatment between
periodic reference measurements. Alternatively, in this
study, we tested the feasibility of using a geometry-inde-
Page 8 of 12
(page number not for citation purposes)
Theoretical Biology and Medical Modelling 2008, 5:22
/>
Figure flow pressure modeling results
Variable3
Variable flow pressure modeling results. Results of variable flow pressure modeling for (A) 4.76- and (B) 6.35-mm
accesses using Equations 4 (linear) and 5 (quadratic), without geometry- or viscosity-dependent terms.
Page 9 of 12
(page number not for citation purposes)
Theoretical Biology and Medical Modelling 2008, 5:22
/>
Figure 4
Experimental flow modeling results
Experimental flow modeling results. Experimental flow modeling results for (A) 4.76- and (B) 6.35-mm accesses, without
geometry- or viscosity-dependent terms.
Page 10 of 12
(page number not for citation purposes)
Theoretical Biology and Medical Modelling 2008, 5:22
/>
Figure 5
Real-time waveform results
Real-time waveform results. Differential pressure waveform of pulsatile flow shifted by turning the pump on. Pulsatile
pump flow is 500 mL/min.
pendent flow estimation technique that could be used frequently at each dialysis to improve the accuracy and
utility of measurements. Using a combination of quadratic and linear VFP algorithms, true flow may be nearly
estimated in grafts on the order of 5- to 6-mm inner diameter typically used in the dialysis setting. Our CFD and
experimental results support the possibility of using this
method with sensors as close as 1 cm from the dialysis
needle tip when the arterial needle faces upstream and the
venous needle faces downstream. Alternatively, implantable sensors may be used at greater distances from the dialysis needles. The potential advantages of this or related
approaches are based on establishing measurement methods that reduce dependence on access geometry, needle
separation distance, and fluid characteristics that may
confound other measurement techniques or at least make
them more labor intensive to perform.
While ΔP measurements may be obtained from MEMS
needle shaft sensors, preliminary data from our laboratory
show wider variation in access flow estimation in settings
where the access geometry is in the order of 8 mm or
larger, such as is encountered with dilated fistulas.
Research is ongoing to extend this approach to larger
access diameters and more variable access geometries.
In addition, without altering the treatment, diagnostic
information may be gathered in real time during dialysis,
including continuous pressure waveform monitoring to
detect flow reversal that could lead to recirculation. Waveform information has largely been ignored in recent
access monitoring literature but may be of additional
diagnostic value.[24,27] Parameters derived from waveform information may yield diagnostic information
about the compliance and elastic/mechanical properties
of the access.
Integrating intraluminal pressure sensors within the dialysis needle may offer advantages in addition to real-time
pressure and flow monitoring during dialysis. The location of the sensor could allow real-time detection of the
needle migrating out of the lumen prior to the needle tip
becoming extra-vascular. Detection of needle migration
may decrease the risk of infiltration or bleeding and be a
helpful adjunct to monitoring, particularly in settings
such as home or nocturnal dialysis. Prior to clinical evaluation, however, the effect of needle tip-induced local
flow variances and turbulence, the accuracy and resolution of pressure and placement of the pressure sensors,
and the effect of stenosis will all influence the accuracy
and practicality of this diagnostic and monitoring
Page 11 of 12
(page number not for citation purposes)
Theoretical Biology and Medical Modelling 2008, 5:22
approach. These factors will need to be rigorously evaluated in the laboratory and clinical setting.
/>
12.
13.
Conclusion
In summary, a novel approach to determining access flow
from intra-access pressure is presented and the feasibility
of determining access volume flow independent of access
geometry is examined. While there are clearly multiple
factors that must be evaluated such as the effects of access
geometries and hemodynamics, variable flow patterns,
and the performance of different algorithms, these initial
data support further study using differential pressure for
dialysis access monitoring.
Competing Interests
None of the authors have competing interests related to
this work.
14.
15.
16.
17.
18.
19.
20.
Authors' contributions
All authors contributed to the writing of the manuscript.
Additionally, WFW performed theoretical background
work, designed and conducted experiments, and analyzed
data. ZW designed and performed modeling and data
analysis. CLC, RB, PP, and HP conducted experimental
work and data analysis. And YBG and JMR performed theoretical background work and experimental design.
21.
22.
23.
24.
Acknowledgements
This work was supported in part by NIH grant DK62848.
25.
References
26.
1.
2.
3.
4.
5.
6.
7.
8.
9.
10.
11.
May RE, Himmelfarb J, Yenicesu M, et al.: Predictive measures of
vascular access thrombosis: A prospective study. Kidney Int
1997, 52:1656-1662.
Neyra NR, Ikizler TA, May RE, et al.: Change in access flow over
time predicts vascular access thrombosis. Kidney Int 1998,
54:1714-1719.
Wang E, Schneditz D, Nepomuceno C, et al.: Predictive value of
access blood flow in detecting access thrombosis. ASAIO J
1998, 44:M555-M558.
Bosman PJ, Boereboom FT, Eikelboom BC, et al.: Graft flow as a
predictor of thrombosis in hemodialysis grafts. Kidney Int
1998, 54:1726-1730.
McCarley P, Wingard RL, Shyr Y, et al.: Vascular access blood flow
monitoring reduces access morbidity and costs. Kidney Int
2001, 60:1164-1172.
Nolan CR: Strategies for improving long-term survival in
patients with ESRD.
J Am Soc Nephrol 2005,
16(Suppl):S120-S127.
Roy-Chaudhury P, Kelly BS, Zhang J, Narayana A, et al.: Hemodialysis vascular access dysfunction: From pathophysiology to
novel therapies. Blood Purif 2003, 21:99-100.
National Kidney Foundation: K/DOQI Clinical Practice Guidelines for Vascular Access. Am J Kidney Dis 2006, 48(Suppl
1):S210-S233.
Sands JJ: Vascular access monitoring improves outcomes.
Blood Purif 2005, 23:45-49.
Moist LM, Churchill DN, House AA, et al.: Regular monitoring of
access blood flow rate compared with monitoring of venous
pressure fails to improve graft survival. J Am Soc Nephrol 2003,
14:2645-2653.
Ram SJ, Work J, Caldito GC, et al.: A randomized controlled trial
of blood flow and stenosis surveillance of hemodialysis grafts.
Kidney Int 2003, 64:272-280.
27.
Dember LM, Holmberg EF, Kaufman JS: Randomized controlled
trial of prophylactic repair of hemodialysis arteriovenous
graft stenosis. Kidney Int 2004, 66:390-398.
Kennedy MT, Quinton H, Bubolz TA, Wennberg JE, Wilson SE: An
analysis of the patency of vascular access grafts for hemodialysis using the Medicare Part B claims database. Semin Vasc
Surg 1996, 9:262-265.
Frinak S, Zasuwa G, Dunfee T, Besarab A, Yee J: Dynamic venous
access pressure ratio test for hemodialysis access monitoring. Am J Kidney Dis 2002, 40:760-768.
McCarley P, Wingard RL, Shyr Y, et al.: Vascular access blood flow
monitoring reduces access morbidity and costs. Kidney Int
2001, 60:1164-1172.
Weitzel WF, Segal JH, Leavey SF, et al.: Effect of time on sensitivity and specificity of access flow in predicting thrombosis.
Semin Dial 2003, 16:498-501.
Vilkomerson D, Chilipka T, Rafi H, Homel P, et al.: A trial of detecting impending access-graft failure by simplified weekly flow
monitoring. Int J Artif Organs 2005, 28(3):237-243.
Jones SA, Jin S, Kantak A, et al.: Mathematical model for pressure
losses in the hemodialysis graft vascular circuit. J Biomech Eng
2005, 127:60-66.
Munson BR, Young DF, Okiishi TH: Fundamentals of Fluid Mechanics
5th edition. Hoboken, NJ: John Wiley & Sons; 2006.
Takahata K, Gianchandani YB, Wise KD: Micromachined antenna
stents and cuffs for monitoring intraluminal pressure and
flow. JMEMS 2006, 15:1289-1298.
Young DF: Some factors affecting pressure-flow relationships
for arterial stenoses. Proc Appl Mech Bioeng Fluid Eng 1983:87-90.
Li T, Gianchandani RY, Gianchandani YB: Micromachined bulk
PZT tissue contrast sensor for fine needle aspiration biopsy.
Lab Chip 2007, 7:179-185.
Weitzel WF, Rubin JM, Swartz RD, Woltmann DJ, Messana JM: Variable flow Doppler for hemodialysis access evaluation: Theory and clinical feasibility. ASAIO J 2000, 46:65-69.
Weitzel WF, Rubin JM, Leavey SF, Swartz RD, et al.: Analysis of variable flow Doppler hemodialysis access flow measurements
and comparison with ultrasound dilution. Am J Kidney Dis 2001,
38:935-940.
Munson BR, Young DF, Okiishi TH: Fundamentals of Fluid Mechanics
5th edition. New York: Wiley & Sons; 2006:418.
Polaschegg HD: Pressure drops in cannulas for hemodialysis.
Int J Artif Organs 2001, 24:614-623.
Molina PS, Moraes R, Baggio JFR, Tognon EA: Continuous wave
Doppler methods to dialysis access monitoring. Conf Proc IEEE
Eng Med Biol Soc 2004, 4:2352-2355.
Publish with Bio Med Central and every
scientist can read your work free of charge
"BioMed Central will be the most significant development for
disseminating the results of biomedical researc h in our lifetime."
Sir Paul Nurse, Cancer Research UK
Your research papers will be:
available free of charge to the entire biomedical community
peer reviewed and published immediately upon acceptance
cited in PubMed and archived on PubMed Central
yours — you keep the copyright
BioMedcentral
Submit your manuscript here:
/>
Page 12 of 12
(page number not for citation purposes)