Báo cáo y học: " Construction and analysis of a modular model of caspase activation in apoptosis" pot
Bạn đang xem bản rút gọn của tài liệu. Xem và tải ngay bản đầy đủ của tài liệu tại đây (957.59 KB, 15 trang )
Theoretical Biology and Medical
Modelling
Research
Construction and analysis of a modular model of caspase activation
in apoptosis
Heather A Harrington*
1,2
,KennethLHo
3
,SamikGhosh
4
and KC Tung
5
Address:
1
Department of Mat hematics, I mperial College London, London, SW7 2AZ, UK,
2
Centre for Integrative Systems Biology at Imperial
College (CISBIC), Imperial C ollege London, London, SW7 2AZ, UK,
3
Courant Institute of Mathematical S ciences, New York University,
251 Mercer Street, New York, NY 10012, USA,
4
The Systems Biology Institute (SBI) 6-31-15 Jingumae M31 6A, Shibuya, Tokyo 150-0001, Japan
and
5
Department of Molecular Biophysics University of Texas Southwestern Medical Center, Dallas, TX 75235, USA
E-mail: Heather A Harrington* - heather.harrington06@imperia l.ac.uk; Kenneth L Ho - ; Samik Ghosh - ;
KC Tung - KC.Tung@utsouthwestern. edu
*Correspondi ng author
Publishe d: 10 December 2008 Received: 12 June 2008
Theoretical Biology and Medical Modelling 2008, 5:26 doi: 10.1186/1742-4682-5-26 Accepted: 10 December 2008
This article is available from: ome d.com/content /5/1/26
© 2008 Harrington et al; lice nsee BioMed Central Ltd.
This is an Open Access article distributed under the terms of the Creativ e Commons Attribution License (
/>which permits unrestricte d use, distribution, and re production in any medium, provided the original work is properly cited.
Abstract
Background: A key physiological mechanism employed by multicellular organisms is apoptosis,
or programmed cell death. Apoptosis is triggered by the activation of caspases in response to both
extracellular (extrinsic) and intracellular (intrinsic) signals. The extrinsic and intrinsic pathways are
characterized by the formation of the death-inducing signaling complex (DISC) and the
apoptosome, respectively; both the DISC and the apoptosome are oligomers with complex
formation dynamics. Additionally, the ex trinsic and intrinsic pathways are coupled through the
mitochondrial apoptosis-induced chann el via the Bcl-2 family of proteins.
Results: A model of caspase activation is constructed and analyzed. The apo ptosis signaling
network is simplified through modularization m ethodologies and equili brium abstractions for three
functional modules. The mathematical model is composed of a system of ordina ry differential
equations which is numerically solved. Multiple linear regression analysis investigates the role of
each module and reduced models a re constructed to identify key contributions of the extrinsic and
intrinsic p athways in triggering apoptosis for different cell lines.
Conclusion: Through linear regressio n techniques, we id entified the feedbacks, dissociation of
complexes, and negative regulators as the key components in apoptosis. The analysis and reduced
models for our model formulation reveal that the cho sen cell lines p redominately exh ibit stron g
extrinsic caspase, typical of type I cell, behavior. Fur thermore, under the simplified model
framework, the selected cells lines exhibit different modes b y which caspase activation may occur.
Finally the proposed modularized model of apoptosis may generalize behavior for additional cells
and tissues, specifically identifying and pr edicting components responsible for the transition from
type I to type II cell behavior.
Page 1 of 15
(page number n ot for citation purposes)
BioMed Central
Open Access
Background
Apoptosis, or pr ogrammed cell death, is a h ighly
regulated cell death mechanism involved in many
physiological processes including development, elimina-
tion of damaged cells, and immune response [1-9].
Dysregulation of apoptosis is associated with pathologi-
cal conditions such as developmental defec ts, neurode-
generative disorders, autoimmune disorders, and
tumorigenesis [10-16]. The apoptotic pathway is char-
acterized by complex interactions of a large number of
molecular components which are involved in the
induction and execution of apoptosis. Although scien-
tists do not fully understand the entire pathway, key
characteristics have been identified which motivates
further study of this cellular process.
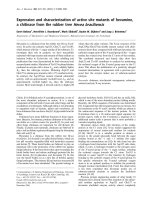
As summarized in Figure 1, apoptosis is a cell suicide
mechanism in which cell death is mediated by apoptotic
complexes along one of two pathways: the extrinsic
pathway (receptor mediated) via the death inducing
signaling complex (DISC), or the intrinsic pathway
(mitochondrial) via the apoptosome [1, 17-23].
The extrinsic initiator caspase (casp ase-8) couples the
two pathways by initiating the mitochondrial apoptosis-
induced channel (MAC), leading to the activation of the
intrinsic pathway [24]. The subsequent cell death for
either pathway is execute d through a cascade activation
of effector caspases (e.g., caspase-3) by initiator caspases
(e.g., caspase-8 and -9) and the amplification of death
signals implemented by several positive feedback loops
and i nhibitors in the network [ 4, 15, 16, 25-28].
The DISC is formed by the ligation of transmembrane
death receptors such as Tumor Necrosis Factor (TNF)
Receptor family TNFR1 (CD95, Fas or APO-1) with
extracellular death ligands (such as FasL) which cluster
and bind to FADD adaptor proteins [21, 29-36]. The
ensuing complex recruits procaspase-8 through proxi-
mity-induced self-cleavage, which leads to the activation
of procaspase-8 to caspase-8 [37-39]. Caspase-8 then
activates downstream effector caspases such as caspase-3
to induce apoptosis [17].
The intrinsic pathway is activated by stimuli (such as
cellular str ess or extrinsic pathway signals) inducing
mitochondrial membrane permeabilization, followed by
the formation of the apoptosome [40, 41]. The apopto-
some is a large caspase-activating complex [18-20] that
assembles in response to cytochrome c released from
mitochondria due to physical or chemical stress [ 22, 23].
Cytosolic cytochrome c activates Apaf-1 [42, 43] which
oligomerizes to form the apoptosome, a wheel-like
heptamer with angular symmetry [19, 44]. The apopto-
some recruits and activates procaspase-9 through pro-
teolytic cleavage [20]. Caspase-9 then catalyzes the
activation of procaspase-3 [45, 46].
These apoptotic pathways also include essential positive
and negative regulators. Negative regulators such as bifunc-
tional apoptosis inhibitor (BAR) or inhibitor of apoptosis
(XIAP) prevent caspase activation; conversely, Smac (DIA-
BLO) which is a protein released with cytochrome c from the
mitochondria interacts with inhibitors of apoptosis to
promote caspase activation [47-50].
Both the extrinsic and intrinsic pathways may converge
at the destruction of the mitochondrial membrane. The
extrinsic pathway may activate the intrinsic pathway
through a mitochondrial apoptosis-induced channel
(MAC) of i ntracellular signals involving the Bcl-2 protein
family, w hich includes both pro-apoptotic (e.g., Bid,
tBid, Bax, Bad, Bcl-xs) and anti-apoptotic (e.g., Bcl-2, Bcl-
xL) members [5 1, 52].
Specifically, mitochondrial release of cytochrome c is
enhanced by truncated Bid [53-55]; upon cleavage by
caspase-8, Bid translocates to the outer mitochondrial
Figure 1
Extrinsic and intrinsic pathways to c aspase-3
activation. Overview of pathways to caspase-3 activation.
Each separate gray region represent the three modules:
DISC (death-inducing signaling complex), MAC
(mitochondrial apo ptosis-induced channel) and apopto some.
Species and their symbols are: FasL (FasL), FasR (FasR), DISC
(DISC), procaspase-8 and caspase-8 (Casp 8), bifunctional
apoptosis inhibitor (BAR), procaspase-3 and caspase-3
(Casp3), XIAP (XIAP), Bid and truncated Bid (Bid), Bax (Bax),
tBid - Bax
2
complex (tBid - Bax
2
), Smac (Smac), Apaf-1 (Apaf),
cytochrome c (Cytc), apoptosome (Apop), procaspase-9 and
caspase-9 (Casp9). Arrows denote chemical conversions or
catalyzed reactions while hammerheads represent inhibition.
Theoretical Biology and Medical Modelling 2008, 5:26 />Page 2 of 15
(page number n ot for citation purposes)
membrane. The MAC formation requires truncated Bid
interaction with Bax, leading to membrane pore forma-
tion by Bax oligomerization [24, 52, 56-59]. Corre-
sponding to the two apoptotic signaling pathways are
two types of cells [60, 61]: in response to death ligands,
cells that require DISC formation for apoptotic death are
primarily type I (e.g., T cells and thymocytes) while those
that release mitochondrial apoptogenic factors are
predominately type II cells (e.g., hepatocytes of Bcl-2
transgenic mice) [60-63].
Mathematical models have been employed recently to
gain further insights on the complex regulation of
caspase activation in apoptosis [57, 64-71]. Most of
these models focus on specific components of the full
apoptotic machinery. Models by Eissing et al. [65] and
Legewie et al. [66] emphasize d only either the extrinsic or
intrinsic pathways, respectively. The model of Fusseneg-
ger et al. [67] implemented both pathways but did n ot
consider the coupling between them; however, Bagci et
al.[57],Albecket al. [72] and Cui et al. [73] modeled the
mitochondrial apoptosis-induced channel. Stucki et al.
[68] modeled only the caspase-3 activation and degrada-
tion but none of the aforementioned models closely
track the upstream formation dynamics o f the DISC and
the apoptosome, which have since been modeled in
detail by Lai and Jackson [74], and by Nakabayashi and
Sasaki [75], respectively. Hua et al. [69, 70] formulated
complete system models that incorporate the differences
in type I an d II signalin g as well as include more species,
such as Smac; however not all dynamics (e.g. feedbacks)
are included from previous component models [65, 66,
74, 75]. More recently, Okazaki et al.[71]formulateda
model based on Hua et al. of the phenotypic switch from
type I and type II apoptotic death, but their model does
not incorporate protein synthesis or degradation.
The primary focus of this work is to construct the simplest
model of caspase-3 activation featuring the oligomerization
kinetics of the DISC, mitochondrial apoptosis-induced
channel (MAC) and the apoptosome; the dynamics of the
extrinsic and intrinsic caspase subnetworks, as well as the
coupling between the extrinsic and intrinsic pathways. To
accomplish this, we constructed three independent func-
tional modules [76-79]. These are implemented for the
abstraction of oligomerization kinetics that simplify the full
system. Analysis of the system generates predictions of key
system components; furthermore, reduced models are
constructed to validate the analysis for different cell types.
Methods
Model formulation
The full reaction network of the model is built from
three component subnetworks (see Figure 1): the
extrinsic, coupling, and intrinsic su bnetworks; and
three oligomerization modules (represented by gray
areas in Figure 1): the DISC, MAC, and apoptosome
modules. Each subnetwork captures a vital part of the
full apoptotic reaction network and borrows heavily
from previous work [57, 65, 66, 70, 71], while each
module abstracts the oligomerization kinetics of an
apoptotic complex to give a simplified net synthesis
function using steady-state results [74, 75].
The extrinsic subnetwork follows Eissing et al. [65] and
captures the dynamics of the extrinsic pathway. The
subnetwork contains the species FasL, FasR, DISC,
procaspase-8 (Casp8), caspase-8 (Casp8*), procaspase-
3 (Casp3), caspase-3 (Casp3*), XIAP, and BAR. The
subnetwork is driven by DISC, w hose formation
dynamics from FasL and FasR are encapsulated by the
DISC module using the results of Lai and Jackson [74].
DISC induces the cleavage of Casp8 to Casp8*, which
then activates Casp3 to produce Casp3*. Positive feed-
back between Casp8* and Casp3* is provided by the
activation of Casp8 by Cas p3*. XIAP and BAR act as
regulators by binding to Casp3* and Casp8*, respec-
tively. Furthermore, degradation of XIAP is enhanced by
Casp3*.
The extrinsic subnetwork can drive the intrinsic pathway
through the coupling subnetwork, which describes the
role of Casp8* in inducing mitochondrial membrane
permeabilization and triggering the release of cyto-
chrome c and Smac. The coupling subnetwork takes
after a combination of Bagci et al., Hua et al., and
Okazaki et al. [57, 70, 71], and contains the additional
species Bid, tBid, Bax, cytochrome c (mitochondrial,
Cytc; cytosolic Cytc*), and Smac (mitochondrial, Smac;
cytosolic, Smac*). The subnetwork receives input from
Casp8*, which cleaves Bid to produce tBid. Bax then
dimerizes with tBid to form tBid-Bax
2
,whichistakenas
a rep resentation of the MAC that controls the release of
Cytc and Smac from the mitochondria to produce Cytc*
and Smac*, respectively; the formation dynamics of tBid-
Bax
2
are abstracted in the MAC module using similar
methods as for the DISC module. Morever, Smac* acts as
a regulator by binding to XIAP.
The intrinsic subnetwork follows the intrinsic pathway
from the assembly of the apoptosome to the resulting
caspase interactions. The oligomerization of the apopto-
some is abstracted in the apoptosome module using the
results of Nakabayashi and Sasaki [75], while the
remainder of the subnetwork is simplified from Lege wie
et al. [66]. Additional species contained in the subnet-
work include Apaf-1 (Apaf), apoptosome (Apop),
procaspase-9 (Casp9), and caspase-9 (Casp9*). The
subnetwork is driven by Cytc*, which binds to Apaf;
Theoretical Biology and Medical Modelling 2008, 5:26 />Page 3 of 15
(page number n ot for citation purposes)
activated Apaf then oligomerizes to form Apop, which
cleaves C asp9 to produce Casp9*. As in the extrinsic
subnetwork, positive feedback exists between Casp9*
and Casp3*. Furthermore, Casp9* binds XIAP.
Constitutive synthesis and degradation rates are assumed
for a ll appropriate species.
Steady-state abstraction of oligomerizatio n kinetics
The oligomerization kinetics of the DISC, MAC, and the
apoptosome are abstracted using steady-state results; this
abstraction is a demonstration of a simple technique for
modularization and model reduction. For an oligomer X
with inte rmedia te structures X
1
, , X
n
and d ynamics
dX
dt
fX X X X
n
[]
([ ],[ ] , ,[ ] ) [ ],=−
1
m
where f is the oligomerization rate function and μ the
degradation rate, use the steady-state approximation f ≈
f
ss
µ [X]
ss
. This allows the modeling of only the final
complex and hence significant simplification of the
dynamical equations. Although the time dependence of
the oligomerization rate is neglected , information
regarding the long-term behavior is retained. For the
present application, take f =[X]
ss
with proportionality
constant μ.
The abstractions for each of the DISC, MAC, and
apoptosome modules are described below, where the
notation is understood to apply only within each
module.
DISC module
The DISC oligomerization kinetics are simplified from
the crosslinking model [8 0-82] of Lai and Jackson [74]
and follow the reactions
FasL FasR FasL-FasR
FasL-FasR FasR
+
+
3
2
2
k
k
k
k
f
r
f
r
,
FasL-FasR
FasL-FasR FasR FasL-Fas
2
2
3
,
+
k
k
f
r
RR
3
describing the trimerization of FasR to FasL. With l ≡
[FasL], r ≡ [FasR], and c
i
≡ [FasL-FasR
i
], the correspond-
ing d ynamics are
dl dt v
dr dt v v v
dc dt v v
dc dt v v
dc dt
/,
/,
/,
/,
/
=−
=− − −
=−
=−
1
123
112
223
3
==
⎧
⎨
⎪
⎪
⎪
⎩
⎪
⎪
⎪
=−
=−
=−
v
vklkc
vkcrkc
vkcrkc
fr r
fr
fr
3
11
21 2
32 3
3
22
3
,
,
,
,,
⎧
⎨
⎪
⎩
⎪
so at steady state,
cl
r
K
D
cl
r
K
D
cl
r
K
12
2
3
33
,, ,
,,
ss ss ss ss ss ss
ss ss ss
=
⎛
⎝
⎜
⎞
⎠
⎟
=
⎛
⎝
⎜
⎞
⎠
⎟
=
DD
⎛
⎝
⎜
⎞
⎠
⎟
3
,
where K
D
= k
r
/k
f
. Apply the c onservation relations
l
0
= l + c
1
+ c
2
+ c
2
, r
0
= r + c
1
+2c
2
+3c
3
to obtain
l
l
rK
D
rK
D
rK
D
ss
ss ss ss
=
++ +
0
13 3
23
(/ )(/ )(/ )
,
where r
ss
is given by solving
rrrrKr
lr K
KlrK
D
D
DDss ss ss ss
432 3
0
00
00
0
33
32+++− =
=−+
=−+
abg
a
b
,
,
()),
(),
g
=−+
⎧
⎨
⎪
⎩
⎪
Kl rK
DD
2
00
33
which has at most one positive root. Assume now that
FADD is in excess (see, e.g., [70, 71]) to obtain
[DISC]
ss
= c
2,ss
+ c
3,ss
≡ f (l
0
, r
0
; K
D
),
where it is assumed that both FasL-FasR
2
and FasL-FasR
3
can propagate the death signal [74]. Externally, in the
full reaction network, the ol igomerization rate function
will be called as f
DISC
([FasL]
0
,[FasR]
0
; K
DISC
). This
abstraction reduces the order of the system by four.
MAC module
The oligomerization kinetics of the MAC module are
assumed to follow a similar crosslinking model and
therefore obey the reactions
tBid Bax tBid-Bax tBid-Bax Bax++
2
2
k
k
k
k
f
r
f
r
,
tBid-Bax
2
.
With the analogous notation l ≡ [tBid], r ≡ [Bax], and c
i
≡
[tBid-Bax
i
], the dynamics are
dl dt v
dr dt v v
dc dt v v
dc dt v
vk
/,
/,
/,
/,
=−
=− −
=−
=
⎧
⎨
⎪
⎪
⎩
⎪
⎪
=
1
12
112
22
1
2
ffr r
fr
lkc
vkcrkc
−
=−
⎧
⎨
⎪
⎩
⎪
1
21 2
2
,
,
so
cl
r
K
D
cl
r
K
D
12
2
2
,,
,,
ss ss ss ss
ss ss
=
⎛
⎝
⎜
⎞
⎠
⎟
=
⎛
⎝
⎜
⎞
⎠
⎟
Similar conservation relations then give that
Theoretical Biology and Medical Modelling 2008, 5:26 />Page 4 of 15
(page number n ot for citation purposes)
l
l
rK
D
ss
ss
=
+
0
1
2
(/)
with
rrrKr
lr K
Kl rK
D
D
DD
ss ss ss
32 2
0
00
00
0
22
22
++− =
=−+
=−+
⎧
⎨
⎩
ab
a
b
,
,
(),
which again has at most one positive root. Therefore,
[tBid-Bax
2
]
ss
= c
2,ss
≡ f (l
0
, r
0
; K
D
),
and externally this will be denoted by
fK
tBid-Bax
22
0
([ ],[ ] ; )tBid Bax
tBid Bax−
, where the dynamical
concentration of tBid is used a s input. The abstraction
reduces the order of the system by three.
Apoptosome module
The oligomerization kinetics of the a poptosome follow
the model of Nakabayashi and Sasaki [75] with no
dissociation, which considers bimolecular interactions of
the form
Apaf Cyt Apaf-Cyt
Apaf-Cyt Apaf-Cyt
+⎯→⎯⎯
+⎯→
∗∗
∗∗
cc
cc
k
ij
k
1
2
,
()()⎯⎯⎯ + = ≤
∗
(), ,Apaf-Cytcijk
k
7
where Apop ≡ (Apaf-Cytc*)
7
. With the nondimensiona-
lizations
c
c
ax
c
i
i
≡
∗
≡≡
∗
[]
[]
,
[]
[]
,
[( ) ]
[]
Cyt
Apaf
Apaf
Apaf
Apaf-Cyt
Apaf
00 0
,,
the dynamics are
da
d
dc
d
ac
dx
d
ac x x x x
dx
i
d
xx x
jij i
j
tt
t
l
t
l
==−
=− +++
=−
−
=
,
(),
1
2
11 2 6
11
2
1
7
127
i
ij j
j
i
xi
/
(), ,,,
⎢
⎣
⎥
⎦
=
−
∑∑
+
⎡
⎣
⎢
⎢
⎤
⎦
⎥
⎥
=
d
…
where τ = aa
0
t, l = k
2
/k
1
,andδ is the Kronecker delta.
Integration of this system until steady state over a r ange
of c
0
generates a curve for x
7
that may be accurately fit
with a piecewise exponential function
gc
gc c
gc c
gc e
ii
c
i
i
()
(),
(), ,
() ,
0
10 0
20 0
0
1
1
0
=
≤
>
⎧
⎨
⎩
=+
ag
b
Continuity at c
0
= 1 and boundary conditions at c
0
=0
and ∞ give
gc
e
c
e
xgcxx
10 7 20 7 7
10
1
1
1
11( ) (), ( ) [ ()
,,,
=
−
−
⎛
⎝
⎜
⎜
⎞
⎠
⎟
⎟
=−
b
b
ss ss ss
(()] (),
()
,
∞+∞
−
ex
c
b
20
1
7ss
where b
1
and b
2
may be fit for any prescribed l.
The apoptosome oligomerzation rate function is then
f(c
0
; l)=a
0
g(c
0
; l), and externally this is f
Apop
([Cytc*]/
[Apaf]
0
; l
Apop
). This abstraction reduces the order of the
system by eight.
Remarks on modularization
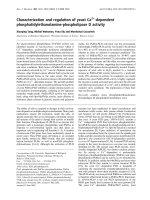
The steady-state profiles of the oligomerization kinetics
(as shown in Figure 2) are supported by the models that
motivated this simplification [74, 75] and experimen-
tally for tBid inducing a switch [49]. The abstraction
enables these module simplifications to operate as
inputs into the full dynamical system of apoptosis.
Model dynamical equations
The model species and reactions are summariz ed in
Tables 1 and 2. Reaction kinetics are d escribed by mass
action, with the corresponding ordinary differential
equation (ODE) system given in Table 3. Initial
conditions to solve the ODEs for HeLa cells (from
[65]) and Jurkat T cells ( based on [70, 71]), as well as
steady-state abstraction parameters, are given in Table 4,
where in particular the baseline value of [FasL]
0
=2nM
corresponds to a dose which has b een used to
experimentally i nduce apoptosis (see [70]).
Table 5 summarizes all model parameters (forward and
reverse reactions, synthesis and degradation rates and
parameters for the steady-state abstractions). Addition-
ally, a variant of the Jurkat T cell, denoted Jurkat T*, is
considered, which has the the same parameter values as
Jurkat T but with k
2
= k
5
= k
12
= 0 following Hua et al.
and Okazaki et al.[70,71].
The model ODEs are implemented in M
ATLAB R20 07a
(The MathWorks, Inc., Natick, Mass., USA) and solved
using ode15s.
Regression analysis and model reduction
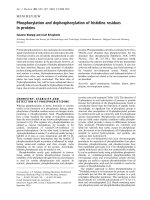
Integration of the model ODEs at baseline parameter
values (Table 5) gives the [Casp3*] time courses shown
in Figure 3. Both the HeLa and Jurkat T cells (the Jurkat
T* case will be addressed in the results) demonstrate a
characteristic behavior, whereby [Casp3*] stays low
initially, then quickly switches to a high state at some
threshold time.
Two quantitati ve descriptors are used to capture the form
of these time courses: the peak activation , the maximum
value of [Casp3*] attained over the time course; and the
activation time, the time at which this peak is achieved. To
determine the most significant aspects of the model
Theoretical Biology and Medical Modelling 2008, 5:26 />Page 5 of 15
(page number n ot for citation purposes)
within a given parameter regime, sensitivity analysis is
performed wit h respect to these descriptors according to
the following procedure: For a given set of baseline
parameter values, we generate normally distributed
random parameters about the baseline with standard
deviation 5% of the baseline values. Then we simulate
the model at these parameters, compute the descriptors
and repeat this 100 times (the model has 54 parameters)
tocollectasetofsyntheticdata.
Since only local parameter perturbations have been
considered, linear relationship y =(1X)b is assumed
between the standardized descriptors y (y being one of
[Casp3*]
max
and τ in standardized form) and the
standardized random parameters X,whereeachrowof
X is a concatenation of the 54 model parameters in the
order given by Table 5. The relation b is solved by
multiple linear regression and large regression coeffi-
cients are taken to indicate essential components of the
network. This information is used to guide the formula-
tion of reduced models.
Results and discussion
Regression analyses and reduced models for FasL
induction
Regression analysis as described previously is performed
for baseline HeLa parameter values. Regression coeffi-
cients for each of the descriptors show isolated peaks,
indicating that only a small subset of the network is
responsible for the system behavior. Particularly, the
coefficients for the peak activation (r
2
= 0.9991) show
strong components only at the synthesis and degrada-
tion rates a
Casp3
and μ
Casp3
, which together control the
initial concentration [Casp3]
0
; evidently, this turns out
to largely be the case for all parameter sets considered
(not shown), so the peak activation will not be generally
further discussed. More interesting is the result for the
activation time (r
2
= 0.9958; see Figure 4a), which,
notably, shows that only the reactions of the extrinsic
subnetwork appear to be essential. Accordingly, a
reduced model (Figure 5a) consisting only of the
extrinsic subnetwork is formulated, and validation of
the reduction is given by comparison of the [Casp3*]
time courses between the full and re duced models.
Note that this result should be expected since the HeLa
cell was used in Eissing et al. [65] to study type I
apoptosis. Surprising, a similar analysis of the Jurkat T
cell, whose initial concentration parameters were used to
study type II apoptosis by Hua et al. and Okazaki et al.
[70, 71], leads to a similar reduction. The regression
coefficients (for the activation time; r
2
= 0.9903) are
shown in Figure 4b, with reduction shown in Figure 5b,
whichisjustthatfortheHeLacasebutwithXIAP
omitted. It should be noted that the regression analysis
does not show a strong component at k
2
, perhaps due to
the corresponding reaction occurring at saturation;
therefore not sensitive to small perturbations.
Figure 2
Steady-state profiles of DISC, tBid-Bax
2
,and
apoptosome. Steady-state concentrations of DISC, tBid-
Bax
2
, and apoptosome, used for modularization of the DISC,
MAC, and apoptosome modules, respectively. (a) The
steady-state DISC concentration [DISC]
ss
as a function of the
initial death ligand ([FasL]
0
) and receptor ([FasR]
0
)
concentrations. (b) The steady-state tBid-Bax
2
concentration
[tBid-Bax
2
]
ss
as a function of the initial Bax ([Bax]
0
)andtBid
([tBid]
0
) concentrations. (c) The steady-state apoptosome
concentration [Apop]
ss
as a function of the initial Apaf-1
([Apaf]
0
)andcytochromec ([Cytc]
0
) c oncentrations.
Theoretical Biology and Medical Modelling 2008, 5:26 />Page 6 of 15
(page number n ot for citation purposes)
Nevertheless, simulations show the necessity to capture
the correct dynamics.
Review of the literature reveals that Hua et al.andOkazaki
et al. [70, 71] used the model variant denoted as Jurkat T*
in this work; for completeness, analysis of the Jurkat T* was
hence considered. While induction of the Jurkat T* cell by
baseline FasL still shows characteristic type I behavior
(Figure 4c, r
2
= 0.9846; see also the delayed activation in
Figure 3), a transition to type II apoptosis is observed for
low FasL ([FasL]
0
= 0.01 nM), in accordance with the
transition reported Okazaki et al. [71]. This is to be
compared against the low FasL cases for the HeLa and
Jurkat T cells, which do not exhibit such a transition (not
shown). The activation time regression coefficients for the
Jurkat T* cell induced by low FasL case are shown in Figure
4d (r
2
= 0.9569), which in particular has strong
components at k
7
and k
8
, which describe Bid truncation
Table 1: Species description, synthesis and deg radation rates for the model equations
Species Description Synthesis rate (nM/s) Degradation rate (s
-1
)
DISC DISC 8.807 × 10
-3
Casp8 procaspase-8 adjusted 6.5 × 10
-5
[65]
Casp8* caspase-8 9.667 × 10
-5
[65]
Casp3 procaspase-3 adjusted 6.5 × 10
-5
[65]
Casp3* caspase-3 9.667 × 10
-5
[65]
XIAP XIAP adjusted 1.933 × 10
-4
[65]
Casp3*-XIAP Casp3*-XIAP complex 2.883 × 10
-4
[65]
BAR BAR 1.111 × 10
-3
([BAR]
0
= 66.67 nM [65]) 1.667 × 10
-5
[65]
Casp8*-BAR Casp8*-BAR complex 1.933 × 10
-4
[65]
Bid Bid 4.168 × 10
-4
([Bid]
0
= 25 nM [70, 71]) 1.667 × 10
-5
(μ
BAR
)
tBid truncated Bid 1.667 × 10
-5
(μ
Bid
)
tBid-Bax
2
tBid-Bax
2
complex 0.0264
Cytc cytochrome c (mitochondrial) 10
-3
([Cytc]
0
= 100 nM [70, 71]) 10
-5
Cytc* cytochrome c (cytosolic) 10
-5
Smac Smac (mitochondrial) 0.0167 ([Smac]
0
= 100 nM [70, 71]) 1.667 × 10
-5
(μ
BAR
)
Smac* Smac (cytosolic) 1.667 × 10
-5
(μ
Smac
)
Smac*-XIAP Smac-XIAP complex 1.933 × 10
-4
(μ
Casp8*-BAR
)
Apop apoptosome 1.487 × 10
-5
Casp9 procaspase-9 1.3 × 10
-3
([Casp9]
0
= 20 nM [70, 71]) 6.5 × 10
-5
(μ
Casp8
)
Casp9* caspase-9 9.667 × 10
-5
(μ
Casp8*
)
Casp9*-XIAP Casp9*-XIAP complex 2.883 × 10
-4
(μ
Casp3*-XIAP
)
Model species and description are given. In the model, synthesis and degradation rates are given for the model system and labeled a and μ,
respectively.
Table 2: Reactions for the model equations
Number Reaction Forward rate (nM
-1
s
-1
) Reverse rate (s
-1
)
DISC (FasL, FasR) Æ DISC f
DISC
1DISC+Casp8Æ DISC + Casp8* 10
-4
(k
2
)
2 Casp3* + Casp8 Æ Casp3* + Casp8* 10
-4
[65]
3 Casp8* + Casp3 Æ Casp8* + Casp3* 5.8 × 10
-4
[65]
4 Casp3* + XIAP ⇌ Casp3*-XIAP 3 × 10
-3
[65] 0.035 [65]
5 Casp3* + XIAP Æ Casp3* 3 × 10
-3
[65]
6 Casp8* + BAR ⇌ Casp8*-BAR 5 × 10
-3
[65] 0.035 [65]
7 Casp8* + Bid Æ Casp8*+tBid 5×10
-4
(est. [70, 71])
tBid-Bax
2
(tBid, Bax) Æ tBid-Bax
2
f
tBid-Bax
2
8 tBid-Bax
2
+Cytc Æ tBid-Bax
2
+Cytc*10
-3
[70, 71]
9 tBid-Bax
2
+SmacÆ tBid-Bax
2
+Smac* 10
-3
[70, 71]
10 Smac* + XIAP ⇌ Smac*-XIAP 7 × 10
-3
[70, 71] 2.21 × 10
-3
[70, 71]
Apop (Cytc*; Apaf) Æ Apop f
Apop
11 Apop + Casp9 Æ Apop + Casp9* 2 × 10
-4
(est. [66])
12 Casp3* + Casp9 Æ Casp3* + Casp9* 2 × 10
-4
[66]
13 Casp9* + Casp3 Æ Casp9* + Casp3* 5 × 10
-5
[66]
14 Casp9* + XIAP ⇌ Casp9*-XIAP 1.06 × 10
-4
[70, 71] 10
-3
[70, 71]
Each reaction described highlights whether the reaction is a forward or reversible reaction by the arrows. The rates are provided from previous
work. Reaction are illustrated in Figure 1.
Theoretical Biology and Medical Modelling 2008, 5:26 />Page 7 of 15
(page number n ot for citation purposes)
and the release of Cytc. Moreover, the peak activation
regression coefficients (r
2
= 0.9972, not shown) exhibit a
strong contribution by a
Smac
. The reduced model
(Figure 5c) is correspondingly dominated by the intrinsic
pathway; indeed, there is no direct interaction between
Casp8 and Casp3 at all. Furthermore, as implicated by the
synthesis rate of its inactive form, Smac*, and correspond-
ingly its target XIAP, plays a vital role in achieving the
correct activation level, which in particular illustrates the
critical role of the shared-inhibitor motif in apoptosis as
discussed by Legewie et al. [66].
Regression analyses and reduced models for
mitochondrial apoptosis
The behavior of the system pathways under mitochon-
drial apoptosis can also be studied. Cell stressors that
cause the depolarization and permeab ilization of the
mitochondrial membrane are functionally represented in
the model by an input [tBid]
0
=25nM(now[FasL]
0
=
0). As for the FasL case, peak activation regression
coefficients for the cases considered below are domi-
nated by a
Casp3
and μ
Casp3
; therefore, will not be further
discussed.
Performing the regression analysis on the HeLa cell
induced by tBid produces the activation time regression
coefficients shown in Figure 4e (r
2
= 0.9705). Strong
components corresponding to the reactions of the
intrinsic subnetwork are observed; interestingly, the
system behavior is sensitive to seve ral e xtrinsic re actions
as well. The model reduction is shown in Figure 6a,
which demonstrates that the extrinsic caspase feedback
Table 3: Ordinary differential equation system for the model
Differential equations Reaction velocities
d [DISC]/dt = μ
DISC
(f
DISC
([FasL]
0
,[FasR]
0
; K
DISC
) - [DISC]) v
1
= k
1
[DISC] [Casp8]
d [Casp8]/dt =-v
1
- v
2
+ a
Casp8
- μ
Casp8
[Casp8] v
2
= k
2
[Casp3*] [Casp8]
d [Casp8*]/dt = v
1
+ v
2
- v
6
- μ
Casp8*
[Casp8*] v
3
= k
3
[Casp8*] [Casp3]
d [Casp3]/dt =-v
3
- v
13
+ a
Casp3
- μ
Casp3
[Casp3] v
4
= k
4
[Casp3*] [XIAP] - k
-4
[Casp3*-XIAP]
d [Casp3*]/dt = v
3
- v
4
+ v
13
- μ
Casp3*
[Casp3*] v
5
= k
5
[Casp3*] [XIAP]
d [XIAP]/dt =-v
4
- v
5
- v
10
- v
14
+ a
XIAP
- μ
XIAP
[XIAP] v
6
= k
6
[Casp8*] [BAR] - k
-6
[Casp8*-BAR]
d [Casp3*-XIAP]/dt = v
4
- μ
Casp3*-XIAP
[Casp3*-XIAP] v
7
= k
7
[Casp8*] [Bid]
d [BAR]/dt =-v
6
+ a
BAR
- μ
BAR
[BAR] v
8
= k
8
[tBid-Bax
2
][Cytc]
d [Casp8*-BAR]/dt = v
6
- μ
Casp8*-BAR
[Casp8*-BAR] v
9
= k
9
[tBid-Bax
2
][Smac]
d [Bid]/dt =-v
7
+ a
Bid
- μ
Bid
[Bid] v
10
= k
10
[Smac*] [XIAP] - k
-10
[Smac*-XIAP]
d [tBid]/dt = v
7
- μ
tBid
[tBid] v
11
= k
11
[Apop] [Casp9]
d [tBid-Bax
2
]/dt =
m
tBid-Bax
2
v
12
= k
12
[Casp3*] [Casp9]
(
f
tBid-Bax
2
([tBid], [Bax]
0
;
K
tBid-Bax
2
) - [tBid-Bax
2
]) v
13
= k
13
[Casp9*] [Casp3]
d [Cytc]/dt =-v
8
+ a
Cytc
- μ
Cytc
[Cytc] v
14
= k
14
[Casp9*] [XIAP] - k
-14
[Casp9*-XIAP]
d [Cytc*]/dt = v
8
- μ Cytc*[Cytc*]
d [Smac]/dt =-v
9
+ a
Smac
- μ
Smac
[Smac]
d [Smac*]/dt = v
9
- v
10
- μ
Smac
* [Smac*]
d [Smac*-XIAP]/dt = v
10
- μ
Smac*-XIAP
[Smac*-XIAP]
d [Apop]/dt = μ
Apop
(f
Apop
([Cytc*]/[Apaf]
0
; l
Apop
) - [Apop])
d [Casp9]/dt =-v
11
- v
12
+ a
Casp9
- μ
Casp9
[Casp9]
d [Casp9*]/dt = v
11
+ v
12
- v
14
- μ
Casp9*
[Casp9*]
d [Casp9*-XIAP] = v
14
- μ
Casp9*-XIAP
[Casp9*-XIAP]
Ordinary differential equations for the full system are given in the left hand column. Corresponding reaction velocities use mass-action kinetics are
found in the right hand column.
Table 4: Initial condit ions for the model variables and oli gomerization parameters
Initial concentration (nM)
Species HeLa Jurkat T Parameter Value
Casp8 216.67 [65] 33.33 [70, 71] [FasL]
0
2 nM [70, 71]
Casp3 35 [65] 200 [70, 71] [FasR]
0
10 nM [70, 71]
XIAP 66.67 [65] 30 [70, 71] K
DISC
1.032 nM [70, 71]
BAR 66.67 [65] 66.67 [65] [Bax]
0
83.33 nM [70, 71]
Bid 25 [70, 71] 25 [70, 71]
K
tBid-Bax
2
100 nM [70, 71]
Cytc 100 [70, 71] 100 [70, 71] [Apaf]
0
100 nM [70, 71]
Smac 100 [70, 71] 100 [70, 71] l
Apop
1 [75]
Casp9 20 [70, 71] 20 [70, 71]
Initial conditions of model variables are given. Some species initial conditions differ between HeLa or Jurkat T cell type. Par ameters and values are
given for steady-state oligomerization modules.
Theoretical Biology and Medical Modelling 2008, 5:26 />Page 8 of 15
(page number n ot for citation purposes)
between Casp8 and Casp3 is essential to capturing the
correct dynamics (compare the time course with k
2
=0).
Thus, the HeLa cell displays an apoptotic mechanism that
involves the intrinsic pathway triggering the extrinsic
pathway. Furthermore, the role of Smac* as an indirect
activator of Casp3 through the sequestration of XIAP is
recovered. Although Casp9* possesses a similar seques-
tration ability, the analysis reveals that the primary role of
Casp9* is through direct activation of Casp3.
Analysis of the Jurkat T cell induced by tBid gives similar
results (Figure 4f, r
2
= 0.9879; reduced model not shown),
though the magnitude of the regression coefficient of k
13
,
which describes the activation of Casp3 by Casp9*, is larger
than in the HeLa case, suggesting a stronger role for the
intrinsic caspase. For completeness, the Jurkat T* cell is
induced by tBid is also considered. The activation time
regression coefficients are shown in Figure 4g. In this case,
the fit is relatively poor (r
2
= 0.8873) and some parameters
are selected in error (e.g., k
1
, which has no effect on the
system by construction; also note the larger number of
significant component s). Nevertheless, the regression
serves to guide the model reduction, which in this
case required manual correction. The reduced model
(Figure 6b) reveals a purely intrinsic mechanism of caspase
activation. Similarly to the HeLa and Jurkat T cells, the
sequestration of XIAP by Smac* is essential, while that by
Casp9* may be neglected.
Although the peak activation for each of the HeLa, Jurkat T,
and Jurkat T* cells is essentially identical to that obtained
under FasL induction, the activation time shows a
significant increase (factor increas e of 2. 1457, HeLa;
1.3003, Jurkat T; 1.9920, Jurkat T*). This is in general
agreement with experimental evidence that caspase activa-
tion through the intrinsic pathway is delayed relative to that
through the extrinsic pathway [62].
Table 5: Summ ary of all rates and parameters for the system
Forward rate Reverse rate Synthesis rate Degradation rate Parameter
1 k
1
15 k
-4
19 a
Casp8
27 μ
DISC
48 [FasL]
0
2 K
2
16 k
-6
20 a
Casp3
28 μ
Casp8
49 [FasR]
0
3 k
3
17 k
-10
21 a
XIAP
29 μ
Casp8*
50 K
DISC
4 k
4
18 k
-14
22 a
BAR
30 μ
Casp3
51 [Bax]
0
5 k
5
23 a
Bid
31 μ
Casp3*
52
K
tBid-Bax
2
6 k
6
24 a
Cytc
32 μ
XIAP
53 [Apaf]
0
7 k
7
25 a
Smac
33 μ
Casp3*-XIAP
54 l
Apop
8 k
8
26 a
Casp9
34 μ
BAR
9 K
9
35 μ
Casp8*-BAR
10 k
10
36 μ
Bid
11 k
11
37 μ
tBid
12 k
12
38
m
tBid-Bax
2
13 k
13
39 μ
Cytc
14 K
14
40 μ
Cytc*
41 μ
Smac
42 μ
Smac*
43 μ
Smac*-XIAP
44 μ
Apop
45 μ
Casp9
46 μ
Casp9*
47 μ
Casp9*-XIAP
The counter on the left hand columns totals the 54 model rates and parameters for the full system. Each subscript for k, a and μ corresponds to its
reaction number. The final column are the parameters used in the abstraction of oligomerization kinetics for the three modules.
0 1000 2000 3000 4000 5000 6000 7000 8000 9000 10000
0
20
40
60
80
100
120
140
160
180
200
Time (s)
[Casp3*] (nM)
Casp3* time course
HeLa
Jurkat T
Jurkat T*
Figure 3
Caspase-3 time course results.Timecourseofcaspase-3
activation ([Casp3*]) in HeLa and Jurkat T cells represented
by solid and dashed lines, respectively. The time course for a
modification of the Jurkat T cell with k
2
= k
5
= k
12
= 0 based
on the formulation of Hua et al. and Okazaki et al. [70, 71] is
denoted Jurkat T* and r epresented by the dotted line.
Theoretical Biology and Medical Modelling 2008, 5:26 />Page 9 of 15
(page number n ot for citation purposes)
Type II apoptosis prediction
In the preceding cases considered, type II apoptosis was
observed only for the Jurkat T* cell under low FasL
induction. This may be unsatisfactory since the Jurkat T*
cell omits caspase feedback interactions which suggest
potentially questionable biological relevance. Thus, a
natural idea is to determine whether parameters leading to
type II apoptosis may be predicted for the full reaction
network rather than resorting to the Jurkat T* formulation.
An attempt to use the regression analysis for this task was
made based on the idea of performing regression with
respect to differences in the peak activation and in the
activation times between a given parameter set and the
corresponding set with k
7
= 0 (no Bid truncation, i.e., no
extrinsic-intrinsic coupling). The intuition in this
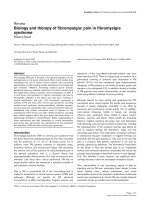
Figure 4
Regression analysis of apoptosis under various
conditions. Activation time regression coefficients for
sample mod el cases. The activation time is defined as the
time at which the peak caspase-3 concentration over the
time course occurs. The regression coefficients are ordered
by their parameter indices as shown in Table 5. Induction by
FasL ([FasL]
0
= 2 nM unless noted) corresponds to receptor-
mediated apoptosis, while induction by tBid corresponds to
mitochondrial apoptosis ([tBid]
0
=25nMand[FasL]
0
=0
unless otherwise noted). (a) HeLa cell induced by FasL ( r
2
=
0.9958). (b) Jurkat T cell i ndu ced by FasL (r
2
= 0.990 3). (c)
Jurkat T* cell induced by FasL (r
2
= 0.9846). (d) Jurkat T* cell
induced by low FasL ([FasL]
0
=0.01nM;r
2
= 0.9569). (e)
HeLa cell induced by tBid (r
2
= 0.970 5). (f) Ju rkat T cell
induced by tBid (r
2
= 0.9 879). (g) Jurkat T* cell in duced by
tBid (r
2
= 0.88 73). (h) Predicted type II apoptosis cell
parameters (k
-4
= k
-6
=10
-3
s
-1
,[XIAP]
0
= 200 nM, [FasR]
0
=
1 nM) induced by FasL (r
2
= 0.926 4).
Figure 5
Reduced models under induction by FasL. Reduced
models of apoptosis under induction by FasL (r eceptor -
mediated apoptosis; [FasL]
0
= 2 nM unless noted), with time
course validations. In (a) an d (c), the time courses of the full
and reduced models essentially overl ap. (a) HeL a cell induced
by FasL. (b) Jurkat T cell induced by FasL. (c) Jurkat T* cell
induced by low FasL ([FasL]
0
=0.01nM).
Figure 6
Reduced models by tBid. Reduced models of apoptosis
under induction by tBid (mitochondrial apoptosis; [tBid] = 25
nM an d [FasL]
0
= 0), with time course validations. In both
cases,thetimecoursesofthefullandreducedmodels
essentially o verlap. (a) HeLa cell induced by tBid. (b) Jurkat
T* cell induced by tBid.
Theoretical Biology and Medical Modelling 2008, 5:26 />Page 10 of 15
(page number n ot for citation purposes)
analysis is that st rong regression coefficients (assuming
the modifie d descriptors are t aken with the appropriate
sign) now select parameters whose increase may effect a
transition from type I to type II behavior. Furthermore,
the parameters randomly perturbed are now restricted to
only the synthesis and degradation rates, and to [FasL]
0
,
[FasR]
0
,[Bax]
0
,and[Apaf]
0
, i.e., the parameters that
control only the initial concentr ati on, referred to as cell-
specific parameters, as these are presumably the only
parameters which may vary between different cell types.
Unfortunately, the regression coefficients for this analy-
sis give poor fits (0.3884 ≤ r
2
≤ 0.7714 for the activation
time diffe rence) for the cases considered, so the method
fails. However, progress may nevertheless be made by
considering the result from the case of Jurkat T* induced
by low FasL. The strategy is to transform the conditions
of that case into equivalent cell-specific parameter
conditions. For example, the Jurkat T* cell mutes the
reactions involving the action of Casp3* on other
molecules. This effect may be achieved in principle by
increasing [XIAP]
0
and hence the inhibition o f Casp3*,
whichturnsouttobeinsufficientasaresultofthestrong
positive feedback between C asp8 and Casp3. Therefore,
it is further necessary to decrease the rate at which Casp8
is activated. This may be controlled at the DISC module,
so accordingly decrease [FasR ]
0
(for the dependence, see
Figure 2 a).
At the assumed rate parameters, however, the changes in
[XIAP]
0
and [FasR]
0
required to achieve type II apoptosis
are rather dramatic. Note though that the dissociation
rates k
-4
and k
-6
of Casp3*-XIAP and Casp8*-BAR,
respectively, as estimated from Eissing et al. [65] are
suspiciously large; if the estimate k
-4
= k
-6
=10
-3
s
-1
is
taken instead, more consistently with, e .g., [66, 70, 71],
thenthechangesrequiredarenomorethananorderof
magnitude. Specifically, starting with Jurkat T para-
meters, increasing [XIAP]
0
from 20 to 200 nM, and
decreasing [FasR]
0
from 10 to 1 nM gives a cell type for
which the intrinsic pathway is significant even under
high FasL induction. The sensitivity regression analysis
forthiscellisshowninFigure4h(r
2
= 0.9264), which
displays significant components corresponding to the
intrinsic subnetwork, notably at k
13
.Theinfluenceofthe
intrinsic pathway demonstrated by the comparison of
time courses in Figure 7 shows a significant delay of
caspase activation upon disabling the pathway coupling
through tBid. In comparison, control results for the HeLa
and Jurkat T cells show no such dependence (not
shown).
Perhaps in light of t his result, an alterna tive interpreta-
tion of the fact that the modified regressions produced
poor fits occurs due to type II transitions requiring large
changes that the local character of the linear regression
cannot capture. This is consistent with the changes that
Hua et al. and Okazaki et al. [70, 71] report to effect
transitions in their models (without caspase feedback),
where, ef fectively, [Casp8]
0
was modified by a similar
amount. As a final note, changes of this magnitude are
likely reasonable given the inherent variability experi-
mentally observed (see, e.g., [83]).
Activation thresholds and stability
It should be noted that the model in its present
formulation is unstable, even to transient signals, a s
Figure 7 suggests. However, some notion of stability may
nevertheless be achieved by considering activation times.
This is shown for HeLa, Jurkat T, and Jurkat T* cells in
Figure 8 .
Consider first the case of receptor-mediated apoptosis, i.
e., by FasL induction. For HeLa and Jurkat T cells, the
peak activation is essentially constant (Figure 8a) with
[FasL]
0
, in accordance with the observation from the
regression analyses that the peak ac tivation is relatively
insensitive. However, the activation time (Figure 8b)
varies significantly, showing first a sharp decrease with
[FasL]
0
for low [FasL]
0
, then a gradual leveling-off as
[FasL]
0
increases thereafter. Clearly, this latter portion
may be interpreted as the cell undergoing apoptosis in a
saturated manner, in which further increase of the death
0 0.2 0.4 0.6 0.8 1 1.2 1.4 1.6 1.8 2
x 10
4
0
20
40
60
80
100
120
Time (s)
[Casp3*] (nM)
Type II prediction time course
full
no tBid
Figure 7
Type II prediction time course.Timecourseofcaspase-
3 a ctivation ([Casp3*]) for the type II apoptosis cell
prediction parameters (k
-4
= k
-6
=10
-3
s
-1
,[XIAP]
0
= 200
nM, [FasR]
0
= 1 nM) induced by [FasL]
0
= 2 nM. The solid line
gives the time course of the full model, while the dashed line
gives the time course with k
7
= 0 (i.e., no Bid truncation,
hence no extrinsic-intrinsic coupling). Note the significant
delay in caspase activation.
Theoretical Biology and Medical Modelling 2008, 5:26 />Page 11 of 15
(page number n ot for citation purposes)
signal no longer affects the response time. Analogously,
the initial drop appears to define a transition region,
wherein t he cell switches from slow to fast apoptotic
dynamics over a narrow range of the death signal input;
this is indicative of some threshold-like behavior.
Although this is not bistability, a sense of the existence
of both low and high apoptotic states is nevertheless
furnished, whi ch, furthermore, may be made p recis e by
introducing an artificial cutoff on the activation time to
discount activations which take too long to occur. The
case of the Jurkat T* cell is similar, though now the peak
activation does show nontrivial variation with [FasL]
0
.
However, the peak activation remains uniformly rather
high which questions biological significance.
Corresponding data for mitochondrial apoptosis (vari-
able [tBid]
0
with [FasL]
0
=0)areshowninFigure8c,d.
The cases for the HeLa and Jurkat T cells are similar as the
receptor-mediated case; however, the Jurkat T* cell
appears to exhibit bistability (Figure 8c ). For low FasL
(approximately [FasL]
0
<10
-2
nM), the peak activation
stays low (near zero), whereas for high FasL ([FasL]
0
>
1 nM), the peak activation reaches a high state around
145 nM. Intermediate concentrations define a transition
regionwherethecellmaybeinterpretedtoswitchfrom
life to death.
The present data was computed with a constant input for
the receptor-mediated case and an exponentially decay-
ing (i.e., transient) input for the mitochondrial case
(since tBid has a constitutive degradation rate i n the
model). Interestingly , instituti ng a transient FasL signal,
with e stimated degradation rate μ
FasL
=10
-5
s
-1
,givesno
discernab le change to the receptor-mediated data, while
setting μ
tBid
= 0 degrades the quality of the bistability
result of the Jurkat T* case for mitochondrial apoptosis
(not shown). This affords some insight into why the
noted bistability is observed: by virtue of the delay of
apoptosis incurred by the intrinsic pathway through the
necessary activation of the mitochondrial apoptogenic
factors and the assembly of the apoptosome (compare
Figures 8b a nd 8d), the intrinsic pathway is able to better
filter out transient signals.
With regard to stabi lit y, perhaps this implies that further
models of apoptosis should be careful to include
potentially important regulators such as cFLIP, which
inhibits DISC and hence imposes a delay on Casp 8
activation [70, 71]. Moreover, it may likewise be prudent
to expand in full any series of activations occuring
sequentially; an example might be the interactions
between Bid and Bax to form the MAC, which currently
is not mechanistically understood and consequently may
be inappropriately abstracted; although in defense of the
abstraction, it is experimentally suggested that compo-
nent levels (such as Apaf-1 or Casp9) may determine
how quickly some cells die [83]. Finally, in this view, the
steady-state abstractions presented are actually quite
unsuitable for the purposes of model stability; however,
modulation of the given abstracted dynamics by appro-
priate time-dependent functions (e.g., by an appropriate
Heaviside function) may suffice.
Conclusion
This study has presented a methodological construction
of a straightforward and informative mathematical
model of apoptosis. This was done by combining both
the e xtrinsic and intrinsic pathways through the imple-
mentation of functional modules and subnetworks
motivated by previous models and findings [65-67,
69-71, 74, 75]. The subnetworks, responsible for the
activation of Casp3 and ultimately apoptosis, included
descriptions of both the extrinsic and intrinsic pathways
as well as the coupling between them. Modularization of
the oligomerization kinetics of the DISC, MAC, and
apoptosome were achieved through the implementation
of steady-state abstraction techniques.
Sensitivity analysis by linear regression was used to
identify key components of the apoptotic network under
various cell conditions. This allowed for the formulation
Figure 8
Peak caspase-3 activations and activation times.Peak
caspase-3 activations and activations times for HeLa (dots),
Jurkat T (circles), and Jurkat T*(asterisks) cells under
receptor-mediated apoptosis (variable [FasL]
0
)and
mitochondrial apoptosis (variable [tBid]
0
with [FasL]
0
=0).
(a) P eak activations for receptor-mediated apoptosis. (b)
Activation times for receptor-mediated apoptosis. (c) Peak
activations for mitochondrial apoptosis. (d) Activation times
for mitochondrial apoptosis.
Theoretical Biology and Medical Modelling 2008, 5:26 />Page 12 of 15
(page number n ot for citation purposes)
of reduced models to capture only the essential
dynamics of the system. Importantly, these reductions
allowed the extraction of biological insight and helped
clarify the roles of specific molecular components. For
example, the model predicts for the parameter regimes
considered that Casp9* contributes to the activation of
Casp3 by direct catalytic activation rather than through
sequestration of their common inhibitor XIAP. Further-
more, the reduced models validated many previous
findings, including the critical role of XIAP and the
shared-inhibitor motif in mediating apoptosis [66,
84-87], as well as the transition from type I to type II
apoptosis as the induction of the extrinsic pathway is
decreased [70, 71]. Finally, the analysis revealed the
variety of modes through which caspase activatio n can
be achieved. In the cases considered, caspase activation
was observed to occur 1) solely through the ext rinsic
pathway 2) solely through the intrinsic pathway 3)
through the extrinsic triggering the intrinsic pathway and
4) through the intrinsic triggering the extrinsic pathway.
Whether cells employ all of these modes is an interesting
experimental question, with possibly profound biologi-
cal significance.
The results of the regression analyses were also used to
predict cell parameters (i.e., initial concentrations) that
would elicit type II apoptosis, even under high FasL
induction, without having to use the Jurkat T* model of
Hua et al. and Okazaki et al. [70, 71], which omits
important caspase feedback interactions [65, 66]. This
adheres to the notion of highly conserving the apoptosis
pathway [1, 6, 15], and in principle, achieving both type
I and type II apoptosis using the same network.
Naturally, the type II cell prediction invites experimental
investigation.
Furthermore, remarks on caspase activation thresholds
and s tability were given. The critical element in achieving
bistability in the system (at least to transient signals)
appears to be related to whether sufficient delays are
included. In particular, this implies the importance of
modeling regulators, especially inhibitors, of the system,
as well as the correct dynamical description of complex
formation. Specifically, for this latter point, the present
formulation neglects the time dependence of the
oligomerization rate and assumes that the formation of
a given final complex proceeds without delay. This,
however, does not reflect actual dynamics; for example,
the model of apoptosome assembly by Nakabayashi and
Sasaki [75] at the parameter values considered in this
study exhibits a characteristic time delay on the order of
100 min. A simple improvement is the delayed initiation
of the present approximation by an appropriate time. A
general theory of oligomerization that gives such a time
would be particularly useful. Finally, of special interest is
whether the incorporation of such delays can recover the
expected type II behavior of the Jurkat T cell while
maintaining the type I behavior of the HeLa cell.
Future directions for model refinement include more
sophisticated treatment of oligomerization kinetics as
described. A more comprehensive procedure for model
reduction would a lso be helpful. The current method of
sensitivity analysis is unable to eliminate reactions near
saturation; however these cases should intuitively be
treatable analytic ally. Moreover, the implementation of a
faithful model exhibiting bistability is of primary
biological interest as this would allow the formal
definition and investigation of a point of no return in
apoptosis. Furthermore, it may be profit able to adapt
and apply the model to other cell types, e.g., mature
neurons, which have repressed Apaf-1 expression and
hence apoptosome formation [88, 89]. Extending the
presented work to model apoptosis at a cell population
level may predict key mechanisms; and perhaps, prove
fruitful for understanding drug sensitivity in various cell
lines.
The model thus presented serves as a guide for future
theoretical and experimental work in analyzing apopto-
sis and achieves progress toward a full model of this
important biological process.
Competing interests
The authors declare that they have no competing
interests.
Authors' contributions
HAH, SG, KLH and KCT equally contributed in
constructing and simplifying the model. HAH and SG
conducted analysis and KLH and KCT performed
simulations. HAH and KLH prepared the initial drafts
of the manuscript.
Acknowledgements
We would like to specially thank Baltazar D. Aguda for the idea of
modularization and Chiu-Yen Kao for advice on numeric al simulations;
both of whom provided fruitful conversations and supervision. We also
acknowledge the Mathematical Biosciences Institute at the Ohio State
University for hosting the graduate summer school where this work
commenced. HH also gratefully acknowledges support from Imperial
College Deputy Rector's Award, IC Department of Mathematics and a
National Science Foundation Graduate Resear ch Fell owship (NSFGRF).
References
1. Hengartner M: The biochemistry of apoptosis. Nature 2000,
407:770–776.
2. Jacobson M, Weil M and Raff M: Programmed cell death in
animal development. Cell 1997, 88(3).
3. Leist M and Jäättelä M: Four deaths and a funeral: from
caspases to alternative mechanisms . Nat Rev Mol Cell Biol 2001,
2:589–598.
Theoretical Biology and Medical Modelling 2008, 5:26 />Page 13 of 15
(page number n ot for citation purposes)
4. Oppenheim R: Cell death during development of the nervous
system. Ann Rev Neurosci 1991, 14:453–50 1.
5. Raff M: Cell suicide for beginners. Nature 1998, 396
(6707):119–122.
6. Lockshin RA and Zakeri Z: Programmed cell death and
apoptosis: origins of the theory. Nat Rev Mol Cell Bi ol 2001, 2
(7):545–50, [1471-0072 (Print) Historical Article Journal Article
Research S upport, Non-U.S. Gov't Research Support, U.S. Gov't, P.
H.S.].
7. Zuzarte-Luis V and Hurle JM: Programmed cell death in the
developing limb. Int J Dev Biol 2002, 46(7):871–6, [0214-6282
(Print) Journal Article Research Suppo rt, Non-U.S. Gov't Review].
8. Hutchins JB and Barger SW: Why neurons die: cell death in the
nervous system. Anat Rec 1998, 253(3):79–90, [0003-276X (Print)
Jou rnal Article Research Support, Non-U. S. Gov't Research Support,
U.S . Gov't, P.H.S. Review].
9. Meier P, Finch A and Evan G: Apoptosis in development. Nature
2000, 407(6805):796– 801, [0028-0836 (Print) J ournal Article
Review].
10. Chang H and Yang X: Proteases for cell suicide: Functions and
regulat ion of caspases. Microbiol Mol Biol Rev 2000, 64:821–846.
11. Fadeel B, Orrenius S and Zhivotovsky B: Apoptosis in human
disease: a new skin for the old ceremony?. Biochem Biophys Res
Commun 1999, 266:699–717.
12. Haass C: Apoptosis: Dead end for neurodegeneration?. Nature
1999, 399(6733):204–205, 207.
13. Pritchard J and Hickman J: Why does stage 4s neuroblastoma
regress spontaneously?. Lancet 1994, 344(8926):869–870.
14. Thompson C: Apoptosis in the pathogenesis and treatment of
disease. Scien ce 1995,
267(5203):1456–1462.
15. Thornberry N and Lazebnik Y: Caspases : enemies within. Science
1998, 281(5381):1312–1316.
16. Johnstone RW, Ruefli AA and Lowe SW: Apoptosis: a link
between cancer genetics and chemotherapy. Cell 2002, 108
(2):153–64, [0092-8674 (Print) Journal Article Research Support,
Non-U.S. Gov't Research Support, U.S. Gov't, P. H.S. Review].
17. Budihardjo I, Oliver H, Lutter M, Luo X and Wang X: Biochemical
pathways of caspase ac tivation during apoptosis. Ann Rev Cell
Dev Biol 1999, 15:269–290.
18. Cain K, Brown D, Langlais C and Cohen G: Caspase activation
involes the formation of the apoptsome, a large (~700 kDa)
caspase-activating complex. J Biol Chem 1999, 274
(32):22686–22692.
19. Cain K, Bratton S, Langlais C, Walker G, Brown D, Sun X and
Cohen G: Apaf-1 oligomerizes i nto biolog ically act ive ~700-
kDa and inactive ~1.4-MDa apoptosome complexes. JBiol
Chem 2000, 275(9):6067–6070.
20. Cain K, Bratton S and Cohen G: The Apaf-1 apoptosome: a
large caspase-activating complex. Bi ochimie 2002, 84(2–
3):203–214.
21. Ashkenazi A and Dixit V: Death receptors: signaling and
modulation. Science 1998, 281(5381):1305–1308.
22. Fumarola C and Guidotti G: Stress-in duced apoptosis: Toward
a s ymmetry with recepto r-mediated cell death. Apoptosis
2004, 9:77–82.
23. Jiang X and Wang X: Cyt ochrome c-mediated apopt osis . Ann
Rev Biochem 2004, 73:87–106.
24. Li H, Zhu H, Xu CJ and Yuan J: Cleavage of BID by caspase 8
mediates the mitochondrial damage in t he Fas pathway of
apoptosis. Cell 1998,
94(4):491–501.
25. Arends M and Wyllie A: Apoptosis: mechanisms and roles in
pathology. Int Rev Exp Pathol 19 91, 32:223–254.
26. Nunez G, Benedict M, Hu Y and Inohara N: Caspases: the
proteases of the apoptotic pathway. Oncogene 1998, 17
(25):3237–3245.
27. Takahashi A and Earnshaw W: ICE-related proteases in
apoptosis. Curr Opin Genet Dev 1996, 6:50–55.
28. Zimmerm ann K, Bonzon C and Green D: The machinery of
programm ed cell death . Phar macol Ther 2001, 92:57–70.
29. Strasse r A, Harris A, Huang D, Krammer P and Cory S: Bcl-2 and
Fas/APO-1 regulate distinct pathways to lymphocyte apop-
tosis. EMBO J 1995, 14(24):6136–3147.
30. Marsden V and Strasser A: Control of apoptosis in the immune
system: Bcl-2, BH3-only proteins and more. Annu Rev Immunol
2003, 21:71–105.
31. Gruss H and Dower S: Tumor necrosis factor ligand super-
family: involvement in the pat hology of malignant lympho-
mas. Blood 1995, 85(12):3378–3404.
32. Nagata S: Apoptosis by de ath factor. Cell 1997, 88(3):355–365.
33. Smith C, Farrah T and Goodwin R: The TNF receptor super-
family of cellular and viral proteins: Activation, costimula-
tion, and death. Cell 1994, 76:959–962.
34. Tartaglia L, Ayres T, Wong G and Goe ddel D: A novel domain
within the 55 kd TNF receptor signals cell death. Cell 1993,
74:845–853.
35. Boldin M, Mett I, Varfolomeev E, Chumakov I, Shemer-Avni Y and
Camonis J: Self-association of th e "death domains" of the p55
tumor necrosis factor (TNF) receptor and Fas/APO1
prompts signaling for TNF and Fas/APO1 effects. JBiol
Chem 1995, 270:387–391.
36. Chinnaiyan A, O'Rourke K, Tewari M and Dixit V: FADD, a novel
death domain-containing protein, interacts with the death
domain of fas and initiates apoptosis. Cell 1995, 81:505–512.
37. Boldin M, Goncharov T, Goltseve Y and Wallach D: Involvemen t
of MACH, a novel MORT1/FADD-interacting protease, in
Fas/APO-1- and TNF receptor-induced cell death. Cell 1996,
85(6):803–815.
38. Muzio M, Chinnaiyan A, Kischkel F, O 'Rourke K, Shevchenko A, Ni J,
Scaffid i C, Bretz J, Zhang M, Gentz R, Mann M, Krammer P, Peter M
and Dixit V: FLICE, a novel FA DD-homologous ICE/CED-3-
like protease, is recruited to the CD95 (Fas/APO-1) death-
inducing signaling complex. Cell 1996, 85(6):817–827.
39. Muzio M, Stockwell B, Stennicke H, Salvesen G and Dixi t V: An
induced proximit y model for caspase-8 activation. J Biol Chem
1998, 273(5):2926– 2930.
40. Eskes R, Desagher S, Antonsson B and Martinou J: Bid induces the
oligomerization and insertion of Bax into the outer
mitochondrial membrane. Mol Cell Biol 2000, 20(3):929–935.
41. Green D: Apoptotic pathways: p aper wraps stone blunts
scissors. Cell 2000, 102:1–4.
42. Jiang X and Wang X: Cytochrome c promotes caspase-9
activation by inducing nucleotide binding to Apa f-1. JBiol
Chem 2000, 275(40):31199–31203.
43. Kim H, Du F, Fang M and Wang X: Formation of apoptosome is
initiated by cytochrome c-induced dATP hydrolysis and
subsequent nucleotide exchange on Apaf-1. Proc Natl Acad Sci
USA 2005, 102(49):17545–17550.
44. Acehan D, Jiang X, Morgan DG, Heuser JE, Wang X and Akey CW:
Three-Dimensiona l Structure of the Apoptosome: Imp lica -
tions for Assembly, Procaspase-0 Binding, and Activation.
Molecular Cell 2002, 9:423–432.
45. Li P, Nijhawan D, Budihardjo I, Srinivasula S, Ahmad M, Alnemri E
and Wang X: Cytochrome
c and dATP-dependent formation
of Apaf-1/caspase-9 complex init iates an apoptotic protease
cascade. Cell 1997, 91:479–489.
46. Rodriguez J and Lazebnik Y: Caspase-9 and APAF-1 form an
active holoenzyme. Genes Dev 1999, 13:3179– 3184.
47. Srinivasula SM, Datta P, Fan XJ, Fernandes-Alnemri T, Huang Z and
Alnemri ES: Molecular determinants of the caspase-promot-
ing activity of Smac/DI ABLO and its role in the death
receptor pathway. J Biol Chem 2000, 275(46):36152–36157.
48. Du C, Fang M, Li Y, Li L and Wang X: Smac, a mitochondrial
protein that promotes cytochrome c-dependent caspase
activation by eliminating IAP inhibition. Cel l 2000, 102
(6):33–42.
49. M adesh M, Antonsson B, Srinivasula SM, Alnemr i ES and
Hajnoczky G: Rapid kinetics of tBid-induced cytochrome c
and Smac/DIABLO release and mitochondrial depolariza-
tion. J Biol Chem 2002, 277(7):5651–5659.
50. Li L, Thomas R, Suzuki H, De Brabander J, Wang X and Harran P: A
small molecule Smac mimic potentiates TRAIL- and
TNFalpha-mediated cell death. Science 2004, 305
(5689):1471–14 74.
51. Adams JM and Cory S: The Bc l-2 protein family: arbiters of cell
survival. Science 1998, 281(5381):1322–6, [ 0036-8075 (Print)
Jou rnal Article Research Support, Non-U. S. Gov't Research Support,
U.S . Gov't, P.H.S. Review].
52. Danial N and Korsmeyer S: Cell Death Critical Control Points.
Cell 2004, 116(1):205–219.
53. Sprick M and Walcz ak H: The interplay between the Bcl-2
family an d death receptor-mediated apoptosis. Biochim
Biophys Acta 2004, 1644(2– 3):125–132.
54. Werner A, de Vries E, Tait S, Bontjer I and Borst J: TRAIL
receptor and CD95 signal to mitochondria via FADD,
caspase-8/10 , Bid and Bax but differentially regulat e events
downstream from truncated Bid. JBiolChem2002, 277
(43):
40760–20767.
55. Werner A, de Vries E, Tait S, Bontjer I and Borst J: Bcl-2 family
member Bfl- 1/A1 sequesters truncated bid to inhibit is
Theoretical Biology and Medical Modelling 2008, 5:26 />Page 14 of 15
(page number n ot for citation purposes)
collaboration with pro-apoptotic Bak or Bax. J Biol Chem 2002,
277(25):22781–22788.
56. Antonsson B, Montessuit S, Lauper S, Eskes R and Martinou J: Bax
oligomerization is required f or channel-forming activity in
liposomes and to trigger cytochrome c release from
mitochondria. Biochem J 2000, 345:271–278.
57. Bagci E Z, Vodovotz Y, Bi lliar T, E rmentrout G and Bahar I:
Bistability in apopto sis: roles of bax, bcl-2, and mitochon-
drial permeability transition pores. Biophys J 2006, 90
(5):1546–59.
58. Suzuki M, Youle RJ and Tjandra N: Structure of Bax: coregula-
tion of d imer formation and intracellular localizatio n. Cell
2000, 103(4):645–54.
59. S c h l e s i n g e r P and Sait o M: The Bax pore in liposomes,
Biophysics. Cell Death Differ 2006, 13:1403–1408.
60. Barnhart B, Alappat E a nd ME P: TheCD95TypeI/TypeII
model. Semin Immunol 2003, 15:185– 193.
61. Schmitz I, Walczak H, Krammer PH and Peter ME: The two CD95
apoptosis signa ling pathways may be a way of cells to
respond to different amounts and/or forms of CD95 ligand
produced in different tissues. Cell Death Differ 2000, 7
(8):756–758, [338KP T imes Cited: 6 Cited References Count:21].
62. ScaffidiC,FuldaS,SrinivasanA,FriesenC,LiF,TomaselliK,
Deb atin K, Krammer P and Peter M: Two CD95 (APO-1/Fas)
signali ng pathways. EMBO J 1998, 17(6):1675– 1687.
63. Fulda S, Meyer E, Friesen C, Susin S, Kroemer G and Debatin K: Cell
type specific involveme nt of death receptor and mitochon-
drial pathways in drug-induced apopt osis. Oncogene 2001,
20:1063–1075.
64. Zheng TS and Flave ll RA: Death by nu mbers. Nat Biotechnol 2000,
18(7):717–8, [1087-0156 (Print) Comment News] .
65. Eissing T, Conzelmann H, Gilles ED, Allgöwer F, Bullinger E and
Sch eurich P: Bistability analyses of a caspase activatio n model
for receptor-induced apoptosis. JBiolChem2004,
279
(35):36892–7.
66. Legewie S, Blúthgen N and Herzel H: Mathematical modeling
identifies inhibitors of apoptosis as mediators of positive
feedback and bistability. PLoS Comput Biol 2006, 2(9):e120.
67. Fussene gger M, Bailey J and Varner J: A mathem atical model of
caspase function in apoptosis. Nat Biotechnol 2000, 18:768–774.
68. Stu cki J and Sim on HU: Mathematical modeling of the
regulat ion of c aspase-3 activation and degradation. JTheor
Biol 2005, 234(1):123–131.
69. Hua F, Ha utaniemi S, Yokoo R and Lauffenbu rger DA: Integrated
mechanistic and data-driven modelling for multivariate
analysis of sig nalling pathways. J R Soc Interface 3(9):515 – 526,
2006 Aug 22.
70. Hua F, Cornejo MG, Cardone MH , Stokes CL and Lauffenburger DA:
Effects of Bcl-2 levels on Fas signaling-ind uced caspase-3
activation: molecular genetic tests of computational model
predictions. J Immunol 175(2):985–995, 2005 Jul 15.
71. Okazaki N, Asano R, Kinoshita T and Chuman H: Simple
computational models of type I/type II cells in Fas signal-
ing-induced apoptosis. JTheorBiol2008, 250(4):621–633.
72. Albeck JG, Burke JM, Aldridge BB, Zhang M, La uffenburger DA and
Sorger PK: Quantitative analysis of pathway s control ling
extrinsic apoptosis in single cells. Mo l Cell 2008, 30:11–25.
73. Cui J, Chen C, Lu H, Sun T and Shen P: Two independent positive
feedbacks and bistability in the Bcl-2 apoptotic switch. PLoS
ONE 2008, 3:e1469.
74. Lai R and Jackson T: A Mathematical Model of Receptor –
Mediated Apoptosis: Dying to Know Why FASL Is a Trimer.
Math Biosci Eng 2004, 1(2):325– 338.
75. Nakabayashi J and Sasaki A: Amathematicalmodelfor
apoptosome assembly: the optimal cytochrome c/Apaf-1
ratio. JTheorBiol2006, 242(2):280–287.
76. Hartwell LH, Hopfield JJ, Leibler S and Murray AW:
From
mol ecular to modular cell biology. Nature 1999, 402(6761
Suppl):C47–52.
77. Ortega F, Sameith K, Turan N, Compton R, Trevino V, Vannucci M
and Falciani F: Models and computational strategies linking
physiological response to molecular networks from large-
scale data. Philos Transact A Math Phys Eng Sci 200 8, 366
(1878):3067–3089.
78. Klipp E, Nordlander B, Kruger R, G ennemark P and Hohmann S:
Integrative model of the response of yeast to osmotic shock.
Nat Biotechnol 2005, 23(8):975–982.
79. Watson RA and Pollack JB: Modular Interdependency in
Complex Dynamical Systems. Artificial Life 2005, 11:445–457.
80. DeLisi C: The biophysics of ligand-receptor interactions.
Q Rev Biophys 1980, 13(2):201–230.
81. Perelson AS: Receptor clustering on a cell surface. III. Theory
of receptor cross-linking by multivalent ligands: description
by ligand states. Math Bi osci 1981, 53:1–39.
82. Perelson A: Some mathematical models of receptor cluster-
ing by multivalent ligands. Cell Surface Dynamics: Concepts and
Models Marcel Dekker: Delisi C, Wiegel F, Perelson A 1984,
223–225.
83. Svingen PA, Loegering D, Rodriquez J, Meng XW, Mesner PWJ,
Holbeck S, Monks A, Krajewski S, Scudiero DA, Sausville EA,
Reed JC, Lazebnik YA and Kaufmann SH: Components of the cell
dea th machine and drug sensitivity of the Nationa l Cancer
Institute Cell Line Panel. Clin Cancer Res 2004, 10
(20):6807–6820.
84. Chauhan D, Hideshima T, Rosen S, Reed J, Kharbanda S and
Anderson K: Apaf-1/cytochrome c-independent and Smac-
dependent induction of apoptosis in multiple myeloma
(MM) cells. JBiolChem2001, 276(27):24453–24456.
85. Deveraux Q, Roy N, Stennicke H, Van Arsdale T, Zhou Q,
Srinivasula SM, Alnemri ES, S alvesen GS and Reed JC: IAPs block
apoptotic events indu ced by caspase-8 and cytochrome c by
direct inhibition of distinct caspases. EMBO J 1998, 17
(8):2215
–2223.
86. McNeish I, Bell S, McKay T, Te nev T, Marani M and Lemoine N:
Expression of Smac/DIABLO in ovarian carcinoma cells
induces apoptosis via a caspase-9-mediated pathway. Exp Cell
Res 2003, 286(2):186– 198.
87. Oost T, Sun C, Armstrong R, Al-Assaad A, Betz S, Deckwerth T,
Ding H, Elmore S, Meadows R, Olejniczak E, Oleksijew A,
Olt ersdorf T, Rosenberg S, Shoemaker A, Tomaselli K, Zou H and
Fesik S: Discovery of potent antagonis ts of the antiapopto tic
protein XIAP for the treatment of cancer. JMedChem2004,
47(18):4417–4426.
88. Wright KM, Linhoff MW, Potts PR and Deshmukh M: Decreased
apoptosome act ivity with neuronal differentiation sets the
threshold for strict IAP regulation of apoptosis. JCellBiol
2004, 167(2):303–313.
89. Yakovlev A G, Ota K, Wang G, Movsesyan V, Bao WL, Yos hihara K
and Faden AI: Differential Expression of Apoptotic Protease-
Activating Factor-1 and Caspase-3 Genes and Susceptibility
to Apoptosis during Brain Development and after Trau-
matic Brain Injury. J Neurosc i 2001, 21(19):7439–7446.
Publish with BioMed Central and every
scientist can read your work free of charge
"BioMed Central will be the most significant development for
disseminating the results of biomedical research in our lifetime."
Sir Paul Nurse, Cancer Research UK
Your research papers will be:
available free of charge to the entire biomedical community
peer reviewed and published immediately upon acceptance
cited in PubMed and archived on PubMed Central
yours — you keep the copyright
Submit your manuscript here:
/>BioMedcentral
Theoretical Biology and Medical Modelling 2008, 5:26 />Page 15 of 15
(page number n ot for citation purposes)