Rules of Thumb for Mechanical Engineers Episode 11 docx
Bạn đang xem bản rút gọn của tài liệu. Xem và tải ngay bản đầy đủ của tài liệu tại đây (2.05 MB, 30 trang )
290
Rules
of
Thumb for Mechanical Engineers
the mold, and the molten metal poured into the mold. The
metal solidifies and the shell is broken
off.
Internal passages and other product features can be in-
corporated into the casting using cores. Excellent surface
finish and dimensional control can be obtained. Complex
turbine blades can be manufactured with this method. It is
more expensive than other casting technologies.
A
specialized form of investment casting is used to
make single crystal and directionally solidified pieces.
With these technologies, which are very important for ma-
terials that require long stress rupture and creep properties,
the heat is preferentially extracted in a single direction. This
promotes the growth of a single grain or a single grain ori-
entation. The grain orientation selected depends on the
crystal anisotropy and the property most important for the
application.
Information about the castability of the various alloys can
be found in
Principles
of
Metal Casting
[27] and the
ASM
Metals Handbook,
Vol. 15,9th Ed.
CASE
STUDIES
Failure Analysis
Failure analysis entails the systematic investigation of
why or how a component fails. Despite the best design, an
improper material selection or a processing sequence can
lead to a premature failure of said component. A detailed
history is generally established. Temperature, expected en-
vironment, stresses, and strains are all important variables
for the failure analyst to know.
As
one investigates various
failures, documentation of the salient features is required.
The methods used include photography, notetaking, videog-
raphy, and the like. The examination of the fracture surfaces
optically and electron optically are useful in determining the
type of failure, e.g., brittle or ductile fracture, high or low
cycle fatigue, environmentally assisted fracture, or wear.
Two
operational failures and fixes will be discussed.
Wear is one
of
the most important causes of failure, although
many factors are usually involved. Piston rings, gears, and
bearings are a few of the many parts where resistance to
wear
is
required. Wear is probably the most easily recog-
nized failure mode, as shown in Figure 25. Although wear
may not be prevented, steps can be taken to reduce the rate
and yield a long service life by the proper application of ma-
terials, lubrication, and design.
Often, improper application of steels, load distribution,
heat treatment, and inadequate or faulty lubrication result
in excessive wear and poor service life. High loads and
speeds are capable of producing very high temperatures
under which metal surfaces may actually melt. Friction is
Figure
25.
Excessive wear
of
gear teeth. (Reprinted
by
permission
of
Republic Steel.)
an important factor in producing temperatures that may
cause the breakdown of hardened surfaces, such as those
produced by carburizing. Therefore, special lubricants for
specific applications involving very high unit pressures
may be required.
The gear wear shown in Figure 25 was corrected by se-
lecting a new material that was significantly harder than the
1020 rimmed steel with a Brinell hardness of 116. The
worn teeth were driven by rollers in a chain link with a
Brinell hardness of
401.
An alloy steel with higher hardness
was substituted, and the new sprocket was still in service
after seven years
[33].
Materials
291
Corrosion
The diagram in Figure 26 is a schematic of
the
lower
end of a tube-and-shell heat exhanger made from mild
steel. The unit was designed to heat oil in a chemical
process plant. The
oil
was passed through the small tubes
and the heat was supplied from steam which was inject-
ed into the shell. The unit had been in operation for only
2.5
years when one of the
tubes
perforated. When the tubes
were extracted from the shell, it was found that they all
had corroded
on
the outside over a distance of about 160
mm from the lower tube plate. On the worst-affected
areas,
attack
had
occurred to a depth of about 1.5
mm
over
regions measuring typically 10 mm by
20
111111.
The cor-
roded areas were light brown in color.
The heat exchanger was operated
on
a cyclic basis
as
fol-
lows.
First, saturated steam was admitted to the shell at
180°C
to heat a new batch of oil. The steam condensed on
the surfaces of the tubes and the condensed water trickled
down to the bottom of the shell, where it was drawn
off
via
the condensate drain. When the oil was up to temperature,
the steam supply was cut
off
and the pressure in the shell
160
m
I
34
nm
with
3
m
wall
t
Figure
26.
Schematic view
of
the lower end
of
a tube-
and-shell heat exchanger made
from
mild steel.
was dropped to atmospheric. The cycle was repeated when
it was time to heat up a new batch of
oil.
Based
on
the above observations and operating cycle, it
is apparent
that
the carrosion product is
red
rust, i.e., hydrated
Fe203. Of the three forms of iron oxide (FeO, Fe304), and
F@O3), the latter
has
the highest ratio of oxygen to
iron.
It
is the favored oxide in an oxygen-rich environment. When
the oxygen concentration is low, the corrosion product con-
sists of hydrated
Fq04
(magnetite), which is black But
thm
was no evidence that this was present
as
a corrosion prod-
uct. There is evidence, however, of oxygen in the conden-
sate which presumably came from air dissolved in the
make-up feed water to the boiler. This would have provid-
ed the oxygen needed for the cathodic reaction.
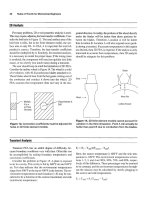
The design of the
unit
allows
condensate
to
build up
to
the level of the drain. It is interesting that corrosion
has
only
occurred in, or just above, the pool of condensate; it has not
taken place farther up the
tubes
even though they would have
been dripping with condensed steam.
A
likely
scenario
is
that
when the shell was let down
to
atmosphere, the water at the
bottom of the shell was
boiled
off
by the residual heat
in
the
tube plate. This would have left either a concentrated solu-
tion or a solid residue containing most of the impurities that
were originally dissolved in the condensate pool. With each
cycle of operation, the cotlcentration of impurities in the pool
would have increased.
A
prime suspect is the carbonic acid,
derived hm
carbon
dioxide dissolved
in
the feed water.
This
would have
made
the liquid
in
the pool very acidic and given
it a high ionic conductivity,
both
of which would have re-
sulted in rapid attack. It can be seen from the electrochem-
ical equilibrium diagram for iron
[39],
iron does not form
a surface
film
in acid waters. Finally, the temperature is el-
evated
so
the
rates of thermally activated corrosion process-
es should be high as well.
A
simple design modification of moving the condensate
drain from the side to the lowest point of the shell would
prevent water from accumulating
in
the bottom of the
shell
[34].
292
Rules
of
Thumb
for
Mechanical Engineers
1. Bolz, R. E. and Tuve, G.
L.
(Eds.),
Handbook
of
Tables
for Applied Engineering Science,
2nd Ed. Boca Raton:
CRC Press, 1984.
2.
ASM Metals Handbook: Properties and Selection-
Irons
and
Steels,
Vol.
1,
9th
Ed.,
ASM International,
Ma-
terials Park, OH, 1978.
3.
Callister, W. D., Jr.,
Materials Science
and
Engineer-
ing, An Introduction.
New York: John Wiley
&
Sons,
Inc., 1985.
4. Dieter, G. E.,
Mechanical Metallurm.
New York Mc-
Graw-Hill, 1986.
5.
Hertzberg, R. W.,
Deformation and Fracture Mechan-
ics
of
Engineering Materials,
2nd
Ed.
New York: John
Wiley
&
Sons, 1983.
6. Schackelford, J.
F.,
Introduction
to
Materials Science
for Engineers,
2nd
Ed.
New York Macmillan
Pub-
lishing, 1988.
7.
Askeland,
D.
R.,
The Science and Engineering
of
Ma-
terials.
Belmont, CA Wadsworth, 1984.
8. Van Vlack,
L.
H.,
Materials Science for Engineers.
Redding,
MA:
Addison Wesley, 1970.
9. Uhlig, H.
H.
and Revie,
R.
W.,
Corrosion and Corro-
sion Control and Introduction
to
Comsion Science
and Engineering,
3rd
Ed.
New York John Wiley
&
Sons, Inc., 1985.
10.
Fontana, M. G.,
Corrosion Engineering.
New York Mc-
Graw-Hill, 1986.
11. McCrum, N.
G.,
Buckley, C. P., and Bucknall, C. B.,
Principles
of
Polymer Engineering.
New York
Ox-
ford University Press, 1988.
12.
Powder Metallurgy Design Solutions.
Metal Powder In-
dustries Federation, Princeton, NJ, 1993.
13. German, R. M.,
Powder Metallurgy Science.
Metal
Powder Industries Federation, Princeton, NJ, 1984.
14.
“Amdry
MCrAlY Thermal Spray Powders Specially
Formulated and Customized Alloys Provide Oxida-
tion and Corrosion Resistance at Elevated Tempera-
tures,,, Amdry Product Bulletin 961,970,995, Alloy
Metals, Inc., 1984.
15.
Engineered Materials Handbook,
Vol.
4:
Ceramics and
Glasses.
S.
J.
Schneider, Jr., Volume Chairman, ASM
International, Materials Park,
OH,
1991.
16. Davis, J. R.
(Ed.),
ASM Materials Engineering Dic-
tionary.
ASM International, Metals Park, OH, 1992.
17.
Craig,
B.
D.
(Ed.),
Handbook
of
Corrosion Data
ASM
International, Materials Park,
OH,
1989,
18.
McEvily, A. J. (Ed.),
Atlas
of
Stress-Corrosion and
Corrosion Fatigue Curves.
ASM International, Mate-
rials Park, OH, 1990
19. Coburn,
S.
K.
(Ed.),
Corrosion Source Book
ASM
In-
ternational, Materials Park, OH, 1984.
20.
Sedriks,
A.
J.
(Ed.),
corrosion
of
Stainless Steels.
New
York John Wiley
&
Sons, Inc., 1979.
21. Uhlig,
H. H.,
Corrosion Handbook
New York John
Wiley
&
Sons,
Inc., 1948.
22.
ASM Metals Handbook: Properties and Selection-
Nonferrous Alloys
and
Pure Metals,
Vol. 2, 9th Ed.,
ASM International, Materials Park,
OH,
1979.
23.
Massalski,
T.
B.,
Okamoto,
H.,
Subramanian
,
P. R., and
Kacprzak,
L.
(Eds.),
Binary Alloy Phase Diagrams,
2nd
Ed.,
ASM International, Materials Park,
OH,
1990.
24. Haynes International,
Product
Bulletin H-1064Dy 1993.
25. Inco Alloys International, Product Handbook, 1988.
26.
Sims,
C.
T.,
Stoloff,
N.
S.,
and Hagel,
W.
C.
(Eds.),
Su-
peralloys
IZ
High Temperature Materials for Aero-
space and Industrial Powel:
New York
John
Wiley
&
Sons,
Inc., 1987.
27. Heine,
R.
W., Loper, C. R., and Rosenthal, P. C.,
Prin-
ciples
of
Metal Casting,
2nd
Ed.
St.
Louis:
McGraw-
Hill, 1967.
28. Birks, N. and Meier, G.
H.,
Introduction to High Tem-
perature Oxidation
of
Metals.
Great Britain: Edward
Arnold, 1983.
29.
ASTM E112, Standard Method for Average Grain Size
of
Metallic Materials,
Volume
03.01
,
Metals-Mechan-
ical Testing; Elevated and Low Temperature Test; Met-
allography, ASTM, 1992.
30.
ASM
E18,
Standard Test Methods for Rockwell Hard-
ness
and
Rockwell Superjkial Harrbzess
of
Metallic Ma-
terials,
Volume 03.01
,
Metals-Mechanical Testing; El-
evated and Low Temperature Test; Metallography,
ASTM, 1992.
3
1.
ASTM El
0,
Standard Test
Method
for Brinell Hardness
of
Metallic Materials,
Volume
03.01,
Metals-Mechan-
ical Testing; Elevated and Low Tempera- Test; Met-
allography, ASTM, 1992.
32.
ASTM
E92
Standard Test Method for vickers Hardness
of
Metallic Materials,
Volume 03.01, Metals-Me-
chanical Testing; Elevated and Low Temperature Test;
Metallography, ASTM, 1992.
Materials
293
33. “Analysis
of
Service Failures,” Republic Alloy Steels
Handbook Adv. 1099R, Republic Steel Corporation,
1974.
34.
Jones,
D.
R. H.,
Engineering Materials
3,
Materials
Failure Analysis, Case Studies
and
Design Implications.
New
York
Pergamon
Press,
1993.
35.
Aurrecoechea,
J.
M.,
“Gas
Turbine Hot Section Coat-
ing Technology,” Solar Turbines Incorporated, 1995.
36.
ASM Metals Handbook: Welding, Brazing, and Sol-
dering,
Vol.
6.,
9th
Ed.
ASM International, Materials
Park, OH.
37. Harper, C. A.
(Ed.),
Handbook
of
Plastics and
Elas-
tomers.
New
York:
McGraw-Hill, Inc., 1975.
38.
ASM Metals Handbook,
Vol. 15,9th
Ed.,
ASM Inter-
national, Materials Park, OH, 1988.
39. Pourbaix, M.,
Atlas
of
Electrochemical Equilibria in
Aqueous Solutions,
National Association
of
Corrosion
Engineers (NACE), Houston,
TX,
1974.
40.
ASM
Metals Handbook: Properties and Selection-
Stainless Steels, Tool Materials, and Special Purpose
Metals,
Vol.
3,%
Ed.,
ASM
International, Materials
Park, OH, 1980.
41.
ASM Met& Handbook:
Corrosion, Vol. 13,
9th Ed.,
ASM International, Materials Park, OH, 1987.
13
Stress and Strain
Marlin
W
.
Reimer.
Development Engineer. Structural Mechanics Dept., Allison Engine Company
Fundamentals
of
Stress and Strain
295
Introduction
295
Definitions-Stress and Strain
295
Equilibrium
297
Compatibility
297
Saint-Venant’s Principle
297
Superposition
298
Plane StressPlane Strain
298
Thermal Stresses
298
Stress Concentrations
299
Determination
of
Stress Concentration Factors
300
Design Criteria for Structural Analysis
305
General Guidelines for Effective Criteria
305
Strength Design Factors
305
Beam Analysis
306
Limitations
of
General Beam Bending Equations
307
Short Beams
307
Plastic Bending
307
Torsion
308
Pressure Vessels
309
Thick-walled Cylinders
309
Press Fits Between Cylinders
310
Thin-walled Cylinders
309
Rotating Equipment
310
Rotating Disks
310
Rotating Shafts
313
Flange Analysis
315
Flush Flanges
315
Undercut Flanges
316
Mechanical Fasteners
316
Threaded Fasteners
317
Pins
318
Rivets
318
Welded and Brazed Joints
319
Creep Rupture
320
Finite Element Analysis
320
Overview
321
The Elements
321
Modeling Techniques
322
Advantages and Limitations
of
FEM
323
Centroids and Moments of Inertia for Common
Shapes
324
Beams: Shear, Moment, and Deflection Formulas
for Common End Conditions
325
References
328
294
SiressandStrain
295
~~~ ~
Introduction
Stress
is a defined quantity that cannot be directly ob-
served or measured, but
it
is the cause of most failures in
manufactured products. Stress is defined as the force per
unit area
(0)
with English units of pounds
per
square inch
(psi) or metric units
of
megapascals (mpa). The type of load,
Le., duration of load application, coupled with thermal
conditions affects the ability of a structural component to
resist failure at a particular magnitude of stress.
Gas
turbine
airfoils under sustained rotating loads at high temperature
may fail in creep rupture. Components subjected to cyclic
loading may fail in fatigue. High speed rotating disks al-
lowed to overspeed will burst when the average stress ex-
ceeds the rupture strength which is a function of the duc-
tility and the ultimate strength of the material.
Conversely,
strain
is a measurable
quantity.
When the size
or shape
of
a component is altered, the deformation in any
dimension can be characterized by the deformation per
unit length
or
strain
(E).
Strain is proportional to
stress
at
or
below the proportional lit
of
the material.
Hook's
law
in one dimension relates
stress
to
strain
by the modulus of
elasticity
(E).
Typical values for
E
at
70°F
are
listed in Table
1.
At elevated temperatures, the modulus will decrease for
the materials listed. Note that the ratio of modulus to den-
sity for the selected materials is relatively constant, i.e.,
E/(p/g)
=
lo8:
Q=EE
where
0
=
stress
E
=
modulus of elasticity
E
=
strain
Table
1
Range
of
Elastic
Modulus
for
Common
Alloys
Material
Modulus
(E)
psi
Density
(p/g)
Ib/h2
Aluminum
alloys
10.0
-
11.2
x
108
0.1 0
cobalt
alloys
32.6
-
35.0
x
108
0.33
Magnesium
alloys
6.4
-
6.5
x
10'
0.065
Nickel
alloys
28.0
-
31.5
x
10' 0.30
Steel-cahon
and
low
alloy
0.28
Steel-stainless
28.5
-
31.8
x
1
0'
0.28
Titanium
alloys
15.5
-
17.9
x
10'
0.1 6
30.7
-
31
.O
x
10'
Sources:
Mil-Hdbk-5D
fl],
Aerospace
Structural
Metals
Handbook
p].
DefinitionMress
and
Strain
The following basic
stress
quantities
am
useful
in the eval-
uation of many simple structures. They are depicted in
Figures
1
through
4.
Today, complex components with
rapid changes in cross-section, multiple load paths, and
stress
concentrations are analyzed using finite element
models. However, the basic equations supplemented by
handbook solutions should
be
employed for
prelhinary
cal-
culations and to check finite element model results.
Basic
Stress
Quantfties
where P=load
A
=
area.
Bending
Stress:
<r
=
Mc/I
where
M
=
moment
I
=
area moment
of
inertia
c
=
distance from neutral surface
Ttansverse
Shear
Stress:
z
=
VQ/It
where V
=
shear force
Q
=
first moment of the area
I
=
area moment of inertia
t
=
thickness of cross-section
Torsional
Shear
Stress:
T
=
TfIJ
where T
=
torque
r'
=
distance from axis of shaft,
J
=
polar moment
of
inertia
296
Rules
of
Thumb
for
Mechanical
Engineers
other.
For
an incompressible
material,
v
=
0.5.
Since actu-
al materials
are
compressible, Poisson’s
ratio
must be less
than OS-typically
0.25
I
v
50.30
for most metals.
Hooke’s Law in
three
dimensions for normal
stresses
[3]:
P
Figure
1.
Direct
stress.
M
M
1
E
E,
=-[ox
-V(Q,
+a,)]
1
E,
=&
-V(Q,
+Qd]
E,
=-[a,
-V(Q,
+Qy)]
1
V
cmi
E
Hooke’s Law for shear stresses:
Lbd
2.y
=
Gyxy
-El
Figure
2.
Bending
stress.
Gz
=
Gvxz
where
G
is the modulus of elasticity in shear.
The relationship between the shearing and tensile mod-
uli
of elasticity for an elastic material:
Figure
5.
Transverse shear
stress.
E
2(l+v)
G=
Von
Mi-
Equivalent
Stress
Most material strength
data
is
based
on uniaxial testing.
However,
structures
are
usually subjected
to
more
than
a
uniaxial
stress
field. The Von
Mises
equivalent
stress
is
gen-
Figure
4.
Torsional
shear
stress
erally used to evaluate yielding in a multiaxial
stress
field,
allowing
the
comparison of a multiaxial stress state with the
Hooke’s
Law
Equatlons
0
+pa*
z)l=x
The
proportionality
of
load
to
deflection in one dimen-
sion is written as:
OX
Q
=
E&
(for normal stress
Q
and strain
E)
dz
z
=
Gy
(for shearing stress
z
and strain
y)
az
&
a
J
Poisson’s ratio
(v)
is
the
constant for
stresses
below the
proportional limit that
relates
strain in one dimension
to
an-
Figure
5.
Three-dimensional normal
stresses.
Stress
and
Strain
297
uniaxial material data. If the nominal equivalent
stress
is
less than the yield strength, no gross yielding will occur.
Oequivaknr
-
Note that equivalent stresses are always positive.
If
the sum
of the principal stresses
ox,
oy,
and
o,
is positive, the
equivalent stress is considered tensile in
nature.
A
negative
sum denotes a compressive
stress.
-
[(a,
-
o~)~
+
(oY
-
6,)’
+
(a,
-
0,)’
+
6
(~f
+
T$
+
T:~)
2
Equilibrium
EM=O
To
successfully analyze a structural component, it is
necessary to defme the force balance on the part.
A
free
body diagram of the
part
will assist
in
determining the
path which various
loads
take through a structure. For ex-
ample, in a gas turbine engine it
is
necessary to determine
the separating force at axial splitline flanges between the
engine cases to ensure the proper number of bolts and size
the flange thicknesses.
A
free
body diagram helps to iso-
late the various loads on the static structure connected to
the case. The compressor case drawing in Figure
6
shows
the
axial
vane and flange loads on the case. The pressure
differential across the
case
wall would
also
contribute
to
the
axial force balance
if
the case was conical in shape.
The
internal
pressure
inaeases
from
the
F1
totheF9vanes.
at flange mating
Axial gas
loads
on vanes
Figure
0.
Free
body
diagram
of
a
compressor case
from
a gas turbine engine.
Compatibility
Compatibility refers to
the
concept that strains must be
100
lb
compatible
within
a continuum,
i.e.,
the
adjacent
deformed
elements must fit together (see Figure
7).
Boundary equa-
tions, strain-displacement, and
stress
equilibrium equa-
tions must
be
defined for the complete solution of a gen-
eral
stress
problem.
&=%
Figure
7.
Compatibility.
Saint-Venant’s Principle
Saint-Venant’s principle
states
that if the
forces
acting
on
a local section of an elastic body
are
replaced by a statical-
ly equivalent system
of
forces
on
the
same
section
of
the
body,
the effect upon the stresses in the body is negligible except
in
the immediate area affected by the applied forces. The
stress field remains unchanged in areas of the body which
are
relatively distant from the
surfaces
upon which the farces
are changed. “Statically equivalent systems” implies that
the two distributions of forces have the same resultant force
and moment. Saint-Venant’s principle allows simplification
of boundary condition application to many problems
as
long
as
the
system of applied forces is statically equivalent.
298
Rules
of
Thumb
for
Mechanical Engineers
Superposition
The principle of superposition states that the stresses at
a point
in
a body that are caused by different loads may be
calculated independently and then added together,
as
long
as the
sum
of the stresses remains below the proportional
limit and remains stable. Application of this principle al-
lows the engineer to break a more complex problem down
into a number of fundamental load conditions, the solutions
of which can be found in many engineering handbooks.
Plane stiss/Plane Strain
Often, for many problems of practical interest,
it
is possi-
ble to
make
simplifying assumptions with respect to the
stress or strain distributions.
For
example, a spinning disk
which is relatively thin
(see
Figure
8)
is in a state of plane
stress.
The
centrifugal body force is large with respect
to
grav-
ity.
No
normal or tangential loads
act
on either
the
top or bot-
tom
of
the disk.
4,
T~,
and
2eZ
are
zero
on
these
surfaces.
Since
the disk is thin, these
stresses
do not build
up
to significant
values in the interior
of
the disk. Plane
stress
assumptions
are
valid for thin plates and disks that
are
loaded parallel to their
long dimension. Thin plates containing holes, notches, and
other
stress
concentrations,
as
well as deep beams subject to
bending, can be analyzed as plane stress problems.
Another simplification can be made for long cylinders
or pipes of any uniform cross-section which are loaded lat-
erally by forces that do not
vary
appreciably in the longi-
tudinal direction. If a long cylinder
(see
Figure
9)
is sub-
jected to a uniformly applied lateral load along its length
and is constrained axially at both ends, the axial deflection
(6,)
at both ends is zero. By symmetry, the axial deflection
at
the center of the
cylinder
is
also zero and the approximate
assumption that
S,
is
zero
along the entire length of the cylin-
der can be made. The deformation of a large portion of the
body away from the ends is independent of the axial coor-
dinate
z.
The lateral and vertical displacements are a func-
tion of the
x
and
y
coordinates only. The strain components
E,,
'yxz,
and
y
are
equal
to
zero and the cylinder is in a state
Y?
of plane strain. A pipe carrying fluid under pressure is an
example of plane
strain.
Figure
8.
Thin spinning disk-an example
of
plane
dress.
Figure
9.
Pipe 1in-n example
of
plane strain.
Thermal Stresses
Thermal
stresses
are
induced
in a body when it is subjected
to heating or cooling and is
restrained
such that it cannot ex-
pand or contract. The body
may
be
restrained by external
forces, or different parts of the body
may
expand or contract
in an incompatible fashion due to temperature gradients
within the body.
A
straight bar
of
uniform
cross-section,
re
strained at each end and subjected to a temperature change
AT, will experience
an
axial compressive
stress
per unit
length of EaAT.
a
is the coefficient
of
thermal expansion.
A
flat
plate of
uniform
section that is restrained at the edges
Stress
and
Strain
299
and subjected to a uniform temperature increase AT
will
de-
velop a compressive
stress
qual
to
WT/(
l
-
v). Additional
miscellaneous cases for thermally induced
stresses
in plates,
disks,
and cylinders,
are
listed
in
Young
[4]
and Hsu
[5].
Typ-
ical values for the coefficient of thermal expansion
(a)
for
several common materials are listed in Table
2.
Design
Hints
If thermally induced stresses in a member exceed the
capability of the material, increasing the cross-sec-
tional area of the member will generally not solve the
problem. Additional cross-section will increase the
stiffness, and the thermally induced loads will increase
almost as rapidly
as
the section properties. Often, the
flexibility of the structure must be increased such that
the thermal deflections can be accommodated without
building up large stresses.
Thermal stress problems can be
minimized
by match-
ing
the
thermal growths
of
mating components through
appropriate material selection.
In situations where transient thermal gradients cause
peak stresses, changes in the
mass
of the component,
changes in the conduction path, addition of cooling flow,
and shielding from the heat source may reduce the
transient thermal gradients.
Table
2
Range
of
Coefficient
of
Thermal
Expansion
for
Common
Alloys
Max.
Recommended
a@
1200°F
Material Temp.
(OF)
CL
0
600°F
@nAn.PF)
@n./inPF)
Cobalt
alloys
1,900-2,000 7.0-7.7
x
1
O4
7.8-8.7
x
10‘
Nickel alloys
1.400-2,000 6.6-8.0
x
10-6 7.3-8.8
x
1
O4
Steel-carbon
Seekstainless
600-1,500 6.0-9.7
x
1
@
6.7-1
0.3
x
1
0‘
Titanium alloys
400-1,OOO
5.05.4
x
1
@
5.5-5.6
x
10-8
Aluminum alloys
300-600
13.0-1 4.2
x
1
p6
-
Magnesium alloys
300-600 15.5-1 5.7
x
1
0-8
-
and
IOW
alloy
45&1,000 7.1-7.3
x
10-6 7.7-8.3
X
1
W6
Sources:
Mil-Hdbk-5D
[l],
Aerospace
Structural Metals Handbook
p].
STRESS CONCENTRATIONS
The basic stress quantities
used
in design assume a con-
stant or gradual change in cross-section. The presence of
holes, shoulder fillets, notches, grooves, keyways, splines,
threads, and other discontinuities cause locally high stress-
es in structural members. Stress concentration factors
as-
sociated with the aforementioned changes in geometry
have been evaluated mathematically and experimentally
with tools such as finite element models and photoelastic
studies, respectively.
The ratio
of
true maximum stress to the stress calculat-
ed
by the basic formulas of mechanics, using the net sec-
tion but ignoring the changed distribution of stress, is the
factor of stress concentration
(KJ.
A
concentrated stress is
not significant for cases involving static loading (steady
stress) of a ductile material, as the material will yield in-
elastically in
the
local region
of
high stress and redistrib-
ute. However, a concentrated stress is important in cases
where the load is repeated,
as
it
may
lead to the fatigue fail-
ure of the component. Often components are subject to a
combination of a steady stress
(0,)
due to a constant load
and an alternating
stress
(GJ
due to a fluctuating load such
that the
stresses
cycle up and down without passing through
zero
(see
Figure 10). Note that the steady
stress
and the
mean
stress
(om)
may not have the same value. The steady stress
can have any value between the maximum and minimum
stress
values. The damaging effect of a stress concentration
is only associated with the alternating portion of the stress
cycle. Hence,
it
is common practice to apply only any ex-
isting stress concentration to the alternating stress
[6].
A
good example of this situation is a shaft transmitting a
steady state torque that is also subject
to
a vibratory torsional
Figure
IO.
Fluctuating
stress.
300
Rules
of
Thumb
for
Mechanical Engineers
load which may
be
6%
of the steady
state
torque. For
stress
concentration features such
as
shoulder fillets, the
&
would
be applied to the vibratory or alternating stress.
Design Hint
Eliminate unnecessary stress concentrations. Avoid
abrupt changes in section where stress concentrations
cannot be relieved by a tolerable degree of local plas-
tic deformation. All fillet radii should be made as gen-
erous as is practicable.
When possible, keep hole locations away from areas
of
high nominal stress. For example, in high speed rotat-
ing disks such as turbine wheels
(see
Figure Il), holes
near the bore will
be
in a region of
high
hoop
stress.
Peak stresses at holes in the web
of
a rotating disk
may
also be affected by the radial stresses due to ther-
mal gradients, rotational speed, and bending in the
web due
to
eccentric loads
on
the
rim
of
the disk.
If
web
holes are unavoidable,
try
to locate the holes in the most
biaxial
stress
field in the web, i.e., where the tensile hoop
stress
and the tensile radial
stress
are
nearly equal. It
may
also be necessary to increase the thickness
of
the
section around the holes to compensate for the
stress
concentration.
The use
of
corrosion-resistant materials helps prevent
stress
concentrations caused by the pitting that may
ac-
company typical corrosive attack.
In certain situations, the clever removal of material
reduces the effect
of
stress concentrations such as
flange bolt holes. Scalloping flanges as shown
in
Fig-
ure 12 cut the hoop stress path, thus decreasing the ef-
fect of the holes on the peak
stress.
Figure
11.
Axisymmetric cross-section
of
a
turbine
wheel.
f
17
Section"-"
Figure
12.
Scalloped flange.
Determination
of
Stress Concentration Factors
A first approximation for the stress concentration due to
a single
small
hole
in
a plate (Figure
13)
subjected to a uni-
axial
stress field is
J$
=
3.
In a biaxial stress field with equal
stresses
(oo)
of
the same sign, the same hole (Figure
14)
would cause a maximum stress equal to twice
the
nominal
stress
(%
=
2). Conversely,
for
a biaxial
stress
field with
equal stresses of opposite sign,
Kt
=
4.
This latter situation
would occur at a small hole
in
a
thin cylinder subjected to
pure torsion where
o,,
equals four times the nominal tor-
sional shear stress
(2).
Stress
Concentration
Factors
by
R.
E.
Peterson
[7]
is the best source of numerical values of
&
for grooves, notches, shoulder filets, holes,
and
certain
other
miscellaneous design elements.
Stress and Strain
301
Figure
13.
Small hole in a plate subject to a uniaxial
stress
field.
Figure
14.
Small hole in a plate subject to a biaxial
stress field.
Example:
For the hollow
shaft
in Figure 15, determine the
maximum equivalent
stress
at the shoulder fillet. The shaft
is subjected to
an
axial tensile load and torque.
T
=
1,600
in.
lb
r
=
0.07 in.
D
=
1.50
in.
dl
=
0.45
in.
d
=
0.70
in.
P
=
-5,000
Ib.
Determine the torsional
Kf
from Figures 16 and 17:
r/d
=
0.10
D/d
=
2.14
dlld
=
0.643
thus from Figure 16:
&,lid
=
1.41
From Figure 17:
thus
Khollow
=
1.53
Determine the axial
K,
from
Figure 18:
rld
=
0.07
Dld
=
2.14
thus
Kl
=
2.22
Determine the nonconcentrated axial and torsional
shear stresses:
-5000
=
-
11,072
psi
-
P
A
n/2
(0.702
-
0.452)
.70
1600
-
z=
=28,65Opsi
-(.704
-
.454)
32
Assuming full notch sensitivity, calculate the peak
equivalent
stress:
oequivalent
=
[2 (2.22
(-11,072))'
+
6 (1.53 (28,650))2
-Os
[
2
1
=
79,803
psi
Figure
15.
Hollow
shaft subject to axial load and toque.
(text
coiitinued
on
page
305)
302
Rules of Thumb for Mechanical Engineers
Figure
16.
Stress concentration factor for torsion
of
a
shaft with
a
shoulder fillet.
(From
Stress Concentration Factors
by
R.
E.
Peterson
m.
Reprinted by permission
of
John Wiley
&
Sons, Inc.)
Stress
and
Strain
303
Figure
17.
Effect of axial hole on stress concentration factor of a torsion shaft with a shoulder fillet. (From
Stress
Concentration Factors
by
R.
E.
Peterson
m.
Reprinted
by
permission of John Wiley
&
Sons, Inc.)
Fig
Fac
Urn
:ton
304
Rules
of
Thumb
for
Mechanical Engineers
1
s
7
StressandStrain
305
(text
contiplued
from
page
301)
DESIGN CRITERIA FOR STRUCTURAL ANALYSIS
Comprehensive
design
criteria
should always
be
developed
early
in
the design process to ensure that the component or
system will meet the functional requirements. The lack of a
published design criteria leads to a lack of communication
between the design functions and will contribute to a situa-
tion in which the design goals become a moving target.
This often leads to slipped schedules due to the redesign ef-
forts needed to correct the functional deficiencies.
General Guidelines
for
Effective Criteria
An effective structural design criteria must address the
functional requirements as they relate to
cyclic,
time de-
pendent,
and
time independent
load conditions.
In applications where cyclic loading is expected, the
low cycle fatigue life
(crack
initiation life} requirement must
be specified. The requirement should not only
define
the
total number of cycles but also the nature
of
the cycle or
mission,
i.e.,
the
operating points within the mission.
If
sig-
nificant vibratory loads
are
present, the high cycle fatigue
life must
be
considered
as
well.
The
endurance strena Le.,
the alternating stress below which the cyclic life exceeds
lo7
cycles, is usually used to
define
a Goodman diagram.
Depending upon the application, fatigue crack
growth
re-
quirements may need to be included. These requirements
would specify the minimum flaw or crack size that can be
detected by
the
inspection technique employed and the in-
spection interval
in
terms
of number of cycles andor hours.
Time dependent criteria generally include creep and
stress rupture, although fatigue crack
growth
can have time
dependence. Creep requirements should spec@ an allowed
growth over the life of the component based
on
the dimen-
sional tolerances between mating parts.
Stress rupture is
usu-
ally only
a
problem for high-temperature applications where
temperatures exceed
50%
of
the melting temperature of
the
material.
In such cases a combination of temperature and
stress over a period of time
will
lead
to
failure.
Time independent
load
criteria include limit
and
ulrimate
loads. Limit loads are defined as the maximum expected
operational loads. The average cross-sectional stresses
imposed by limit loads are compared to the yield strength
of
the
material.
Under normal operating conditions,
this
pro-
tects the design from gross yielding. Local yielding in an
area of stress concentration is permissible. Ultimate loads
are
defined as any load conditions in which the structure
should tolerate
a
single application without catastrophic fail-
ure, i.e., the load path remains effective after one appli-
cation, but the part will be inspected and probably re-
placed after such an event.
The average material strength properties are seldom
used to define allowable
stresses.
Usually, the
properties
are
degraded on a statistical basis to account for scatter.
Air-
craft applications usually degrade the creep, yield, and ul-
timate strengths by
three
standard deviations
(-3
o).
As-
suming
a
normal distribution of properties, "three standard
deviations"
is
equivalent to saying that only 1 out of
741
parts could possess lower strength properties. Frequently,
a more stringent requirement is placed on
the
low cycle fa-
tigue properties,
Le.,
-3.720
or
1
out of
10,000.
In addition to scatter
in
material properties, it is some-
times prudent to factor in
the
scatter associated with
di-
mensional tolerances if the fit between mating compo-
nents has a large effect on the stress levels.
A
factor
of
safety
(FA)
is defined as the allowable
strength divided by the calculated or measured stress,
whereas the
margin
ofsafety
(M.S.)
equals
the factor of safe-
ty
minus one.
F-S-
=
Fdlowable/Fcalculatedcalculated
M-S-
=
(Fallowable
1
Fcalculated
-
1
Required factors of safety may
vary
widely between in-
dustries and applications.
For
example, if weight
is
not a
306
Rules
of
Thumb
for
Mechanical Engineers
consideration and material cost is low, large factors of
safety can
be
employed to reduce the risk of failure and
avoid costly test
programs.
Factors of safety based on yield
criteria range between 1.5 and
4.0
depending upon the un-
certainty associated with the materials and load condi-
tions. Test rig hardware should be designed with larger fac-
tors of safety to reduce the risk of rig failure prior to fail-
ure
of
the tested components. However, overdesign of
products is not a luxury permitted in industries where
weight is minimized to provide improved energy and ma-
terial costs, as in the automotive and aircraft industries.
BEAM
ANALYSIS
A
beam is commonly regarded as a structural member
which is much longer than
its
cross-sectional dimensions
and is subjected to loads applied transverse to
its
longitu-
dinal
axis.
Beams are classified with respect to the type of
support applied to the beam, as shown in Figure
19.
Some
examples include:
Simple beam with pinned ends-rotation of the ends
is allowed but translation is restrained such that verti-
cal and horizontal reactions
are
developed.
Simple beam with rollers-rotation of ends is allowed
and only vertical reactions are developed.
Simple beam with overhg-beam overhangs supports
either at one or both ends.
Cantilever beam-one end is built into a wall pre-
venting rotation and transverse motion such that a mo-
ment and reactions are developed.
simple supports.
Continuous beam-a beam that has more
t t
01
10
(a) simple beam: pinned ends
I
(b) simple beam: rollers
P
(c) simple beam with overhang
Figure
19.
than two
Beams are said to be statically determinant when the
re
actions at the supports can
be
determined by
use
of
the
equa-
tions of static equilibrium.
If
the number of reactions ex-
ceeds the number of equations of static equilibrium, the
beam
is statically indeterminate and additional equations
based upon the deformations of the beam must be
used
to
solve for the reactions.
In general, the maximum fiber stress occurs at the point
farthest from the neutral axis at the beam section possess-
ing the largest bending moment. The
maximum
shear
stress
is usually at the neutral axis of the section subject to the
greatest shear load. This may not be true if the width of the
section at the neutral axis is wider than other points in the
section. For a
rectangular
section the
maximum
shear
stress
is 1.5 times the average
(V/A),
while for a solid circular
EO
tion it is 1.33 times the average.
Extensive tables for calculating shear forces, moments,
reactions, slopes, and deflections for straight beams are
found in Young
[4]
and
Hsu
[8].
A
few of the most com-
mon beam end conditions are found in the section on
Beams at the end of this chapter.
P
I
(d) cantilever beam
P
1
I
(e) continuous beam
Examples
of
beam
classifications.
Stress
and
Strain
307
limitations
of
General Beam Bending Equations
Often, practicing engineers neglect consideration of the
assumptions associated with the flexural formula
<r
=
Mc/I
and the transverse shearing stress equation
z
=
VQLt and
will use these equations indiscriminately. A review of the
assumptions behind these equations is helpful.
.
The
beam
is
made
of an isotropic and homogeneous
m-
terial
with
the same modulus of elasticity in tension and
compression.
The beam is straight or has at least a radius of curva-
ture that is more than 10 times the depth. Depending
upon the beam cross-section, a radius of curvature
equal to
10
introduces emr
in
bending
stress
(MdI)
cal-
culations of roughly 5% to
12%
[6].
The inside fiber
will
error
on the low side while the outside fiber will
error on the high
side.
Tables providing bending stress
correction factors for curved beams are found in Young
[4], and Seely and Smith
[6].
The beam has a uniform cross-section and
an
axis of
symmetry in the plane of bending. If the beam cross-
section changes gradually and is statically determi-
nant, the flexural formula is adequate for approximate
stress calculations. Abrupt changes
in
cross-section
create
stress
concentrations with high local stresses.
Young [4] provides a table for reaction and deflection
coefficients for tapered beams.
All loads and reactions are perpendicular to the
axis of
the beam and lie in the same plane.
length/depth
>
8
for compact sections of
metal
beams
[4]
lengthldepth
>
15
for beams with thin webs [4]
. The beam is not disproportionately wide. Since the
formula VQDt averages the shear stress across the
thickness t, it is accurate only if the thickness is not
too
great
as
compared to its depth. For a rectangular beam
where the depth is two times the thickness, the error is
only
3%.
For a square
beam,
the error climbs to
12%.
For a beam with a thickness-@depth ratio
of
4, the error
is
100%
[9]!
The maximum stress does not exceed the proportion-
al limit, i.e., Hooke’s Law applies.
The loads on the beam must be static loads, i.e., impact
loads accelerate the beam, thus the stresses and strains
would not be predicted by the flexural formula.
The beam must be free
of
residual stresses due to ther-
mal gradients, heat treatment, cold working, etc.
The
beam
is long as compared to its depth:
~~
Short
Beams
The deflection
due
to shearing stresses is neglected for
a beam that
is
long compared to its depth. However, for a
short, heavily loaded
beam,
the deflection due to shear
loads can be si@icant. The shear
stress
contribution to de-
flection is
a
function of
the
modulus of rigidity
G.
In short
beams where the material has a small value of
G
as
com-
pared
to
E, such as wood, the shear contribution
to
deflection
is much more significant. For metal beams, the deflection
due to shear stress can still be neglected unless the
lengthldepth (Vd) ratio is very small.
The
stress
distribution for short, deep beams is no longer
linear. However, for a Vd ratio above
3,
the flexural formula
provides a reasonable approximation of the maximum
bending stress [4].
Plastic Bending
For a beam made of
a
ductile material such as structur-
al
steel or wrought aluminum, the beam’s resistance to
failure under static ultimate loads
is
determined by calcu-
lating
the
fully plastic moment
(MJ.
The moment neces-
sary
to produce yielding in
the
outermost fibers
only
is
known as the elastic moment
(&).
As additional moment
is applied
to
the beam, more of the cross-section becomes
inelastically strained. At the point where the entire cross-
section
is
inelastically strained, the
section
is
said
to
be
fully
plastic. The plastic moment is determined by multiplying
the yield shrength by the plastic section modulus. Young [4],
provides a table with the plastic moduli for a number of
cross-sections. For the rectangular section of Figure
20,
the
plastic moment is equal to
Gvi&
x
(bh2/4), or 1.5
x
h&.
308
Rules
of
Thumb for Mechanical Engineers
Table
3
Plastic Moments for Common Beam Cross-sections
Cross-section
Plastic
Moment
solid
rectangle
1.5
x
Me
solid
circle
1.698
x
Me
I-section
1.15
x
Me
diamond
2.0
x
Me
hourglass
1.333xM,
Torsion
The torsional
stress
and angular twist calculations for a
beam with a circular cross-section and length
(L)
are
stmghtforward
applications
of
Tf/J
and
WJG,
respectively.
For noncircular cross-sections, the torsional shear stress and
twist cannot
be
obtained from a simple equation. The
max-
imum torsional shear stress for rectangular sections occurs
at the center of each side.
A
rectangular cross-section
where the length exceeds the thickness, has a rnaximum
shear
stress
of
3T/b$.
As
the dimensions b and t approach
the same
magnitude,
the following expressions apply
if
end
effects
are
small (see also Figure
21).
Figure
21.
Rectangular cross-section under torsional
load.
z
=
T/abt2
$
=
TUPbGG
where
a
and
p
are
obtained
from
Table
4.
Table
4
Constants for Torsional Shear
Stress
and Angular
Deflection Equations for Nondrcular Cross-sections
~
M1.OO
1.50 1.75
2.00
2.50
3.0
4.0
6.0
8.0
10.0
-
a
0.208
0.m
0.239
0.246
0.258
0.267
0.282 0.299
0.307
0.313
0.333
B
0.141 0.196
0.214
0228
0.249
0.289
0.281
0.299
0.307
0.313
0.333
If
a cross-section is composed of several rectangular
elements such as shown in
Figure
22,
the shear constant
K
=
pbt3 for each element can
be
calculated The torque ap
plied to the overall cross-section can then
be
distributed over
each
rectangular
element based on the
ratio
of
Kl to
b.
The
maximum
shear
stress
for section
1
becomes
Figure
22.
Cross-section consisting
of
multiple
rectan-
gular areas.
Stressandstrain
309
PRESSURE
VESSELS
Cylindrical
pressure
vessels can be classified as either
“thin-walled” or “thick-walled.”
If
the wall thickness-to-ra-
dius ratio
of
a cylinder is
1/10
or less, it is considered to
be
thin-walled.
Thin-walled Cylinders
For thin-walled cylinders (Figure 23), the tangential
stress due to
an
internal
pressure
can be assumed to
be
uni-
formly distributed across the wall thickness. The hoop
stress equals pD/2t where p
=
internal
pressure,
D
=
di-
ameter,
and
t
=wall
thickness.
For
a
closed
cyhk,
an
axial
stress
6,
=
pD/4t
will
also
be
induced because of the
pres-
sure acting on the ends
of
the cylinder.
Figure
25.
Thin-walled cylinder.
Thick-walled Cylinders
For a thick-walled cylinder (Figure
24),
the
radial
and
tangential stresses
are
a function of the radius. The radial
and hoop stresses can be obtained
from
the equations list-
ed in Table
5
for a disk of
uniform
thickness under inter-
nal and/or external pressures. The
sum
of
a,
and
ar
at all
points through the wall is constant.
or
+
o,
=
2(pi r:
+
po ro2)/(r,,2
-
r:)
For a closed cylinder the axial stress equals:
o,
=
(pi
rz
+
po
ro2)/(ro2
-
r?)
or
o,
=
(or
+
o,)/2
The
maximum
tangential stress will occur at the inner
di-
meter of the cylinder.
o,,
=
(pi
r:
-
po r,2
+
r2(p,- po))/(r2
-
ri2)
/
I
\
Figure
24.
Thick-walled cylinder.
310
Rules
of
Thumb
for
Mechanical Engineers
In
the detail design of high speed rotating disks, such as
those found in the compressor and turbine sections of gas
turbine engines for aircraft, finite element models
are
em-
ployed to analyze the sometimes rather complex shape of
the disks. However, hand calculation of mechanical stress-
es is important for preliminary sizing and for checking the
validity
of
a finite element model. The average hoop stress
in the disk is evaluated against yield, creep, and ultimate
axial
PRESS FITS BETWEEN CYLINDERS
Dmk
web
)I’
e
ing race on a shaft (Figure
25),
the pressure force p devel-
oped between the
two
cylinders
equals:
P=
Es
which simplifies to the following if the bearing race and
shaft
are
made of the same material and the shaft is solid.
If
one cylinder is shrink-fit onto another, such as a bear-
Ar
=
Shrink
ffi
radial
interference
E
(r:
-
ri)
Ar
2r2r:
P=
Figure
25.
Press
fit
between cylinders.
ROTATING EQUIPMEHT
The design
of
rotating disks and shafts can present a
de-
sign challenge, particularly when
high
rotational
speeds
are
coupled with significant transmitted torque, large number
of start-stop cycles, desire
for
lightweight design, and el-
evated temperature operation. The mechanical stresses in
the hoop and radial directions
are
a function
of
the square
of the angular velocity
(a).
A
10% increase in the rotational
speed will increase the stress level by
2
1%. Thermal gra-
dients in turbine disks have a significant impact on the total
stress range experienced in the disk and
will
have a big ef-
fect on the low cycle fatigue life of the disk. Where inter-
ference fits known as radial pilots
are
required between
shaftmg
components, the internal
or
external pressure
loads
should be included in the calculation of peak stresses.
Rotatina
Disks
StressandStrain
311
LOAD
SOLID
DISK
Mechanical
Stresses
RADIALSTRESS
TANGENTIAL
STRESS
AVERAGE
RADIALDEFLamToN
TAN-
STRESS
Table
5
presents the equations for calculating the radial
and tangential
stresses
and
radial
deflections
for
disks
of
uni-
form
thickness under internal/external pressure loads and
rotation. If a disk is under a combination
of
these load
conditions, the equations can
be
superimposed on one
an-
other. The following points
are
noted for the rotating rings
and
disks
in Figure
27:
EXTERNAL
PRESSURE
Po)
+
1.
A
relatively thin ring (thickness t is
small
compared
to the mean radius r) with a
mass
density
of
p
and ro-
tating at
o
radiandsecond will have an average hoop
stress of
G
=
p9d.
2.
For a rotating solid circular disk
of
uniform thickness,
the maximum hoop and radial stresses
are
equal and
occw at the center
of
the disk
G,,
=
o,,
=
pdr2(3
+
v)/8
3. For a rotating circular disk with a center hole of ra-
dius
q,
the
maximum
radial
stress
occurs
at r
=
(q
r0)0.5
and the
maximum
tangential stress occurs at the inner
radius ri.
-P,+Tpa,
3+v
2
(r2-r')
-po+ypa,z(r2
1+3v
)
pr
a'
I-v
1-v
-p.
+
-par
-+-
pm2r[(3+ v)ro2
-(I+
v)r
E
8E
3
r2
3+
v
(a)
Thin
ring.
(b) SolM
circular
disk.
@
(c)
Circular
disk
with
center
hole.
Figure
27.
Rotating
rings
and disks.
G,,
=
(3
+
v)
pd(r,
-
q)*/S
a,,
=
pd[(3
+
v)r:
+
(1
-
v)
$114
Thermal
Stresses
in
Disks
Tensile and compressive hoop stresses are induced in
disks with radial thermal gradients.
If
the outer diameter
of the
disk
is hotter than the inner diameter, then the outer
Table
5
Stress
Equations
for
Disks
of
Uniform
Thickness
ROTATION
DISK
WITH
CENTER
HOLE
r,
=
outer
radius,
rj
=
inner
radius,
r
I
radius
for
calculation,
p
=
mess
den*,
m
=
rotational
velom,
v
= Poisson3
ratio.
312
Rules
of
Thumb
for
Mechanical
Engineers
fibers will be in compression while the inner fibers are in
tension. A reverse gradient will have the opposite effect
on
the sign of the hoop stresses in the disk. The radial ther-
mal
gradient also increases the radial stresses in the web
of the disk.
In
high temperature applications, the tran-
sient thermal gradients may
be
sevm
and affect the fatigue
life of the component.
Yield
Stress
Criteria
A
yield stress criteria for a rotating disk ensures that
no
gross
deformation
will
occur
under
the
limits of
normal
op
eration. Under the combined effects of rotation and ther-
mal
gmhents, the disk average tangential
stress
and the
maximum web average equivalent stress,
i.e.,
averaged
through the thickness of the
disk
web, must
remain
under
the yield strength of the material.
In
aircraft engine struc-
tures,
it is typical practice to use the
-3
sigma yield
strength
of
the material.
UltimaWBurst Stress Criteria
An
ultimate
stress
criteria far a rotating
disk
prevents the
disk from bursting below a predetermined rotational ve-
locity. A disk allowed to burst will cause tremendous
dam-
age
to
surrounding structure and present a safety
hazard
for
any nearby personnel. Usually, a burst disk
will
rupture
into
several large chunks and numerous small fragments. If
tangential stresses cause the burst, the disk will
rupture
through the bore or center of the disk Figure 28a).
A
ra-
dial burst would leave the center of the
disk
intact and the
disk would rupture circumfemtially through the web of
the
disk (Figure 28b).
The rupture stress at which a disk bursts is a function of
the ultimate tensile
strength
and the ductility of the mater-
ial.
Ductility is measured by the percentage elongation pre
sent
in
the
material
specimen
at
fracture.
A
material
with less
(a)
Disk
tangential burst.
@)
Disk radial
burst.
Figure
28.
Rotating
disk
burst
failure
modes.
than
5%
elongation is usually designated as brittle, while a
material with more
than
5%
elongation is ductile. Cast
ma-
terials,
as
a
rule,
have much lower ductility
than
forged
materials.
As noted
in
the following procedure, ductile cast-
ings with greater than
5%
elongation actually exhibit a
higher percentage of utilizable
ultimate
strength
than
very
ductile forged
materials
as long
as
the peak tangential
stress
is
not more than twice the average tangential stress of the
disk
However, a forged
mated
has
higher ultimate
strength,
thus providmg higher rupture
strength.
The
ultimate
strength
used in the burst calculation should
be
degraded by the
scatter
(three
standard deviations are often used for
aircraft
components) associated with
the
material data.
Tangential
Burst
Calculation:
1.
Calculate average tangential
stress
for the disk.
2. Calculate maximum tangential stress for the disk.
3.
Determine average rupture
strength,
Le., average stress
at which disk burst occurs.
For a typical cast material:
Avg.
Tangential
Stresal
Elongation
Max
Tangential
Stress
Rupture
Stmngth
5to8%
20.7
0.95
x
Ult
=l
%
0.7
0.80
x
Ult
-1
%
0.2
0.45
x
Ult
4%
0.2
0.80
x
Ult
For high ductility
materials,
such
as
forgings, the rup-
ture
strength is estimated to be 85% to
90%
of the
ultimate
strength.
4.
Tangential Burst Speed
=
(Rupture StrengtWAvg.
Tangential
Stres~)O.~
(100)
(Rotational
Speed).
The average tangential stress in a turbine disk does not
change
appreciably
when
thermal gradients
are
applied
to
the disk. Thus, even
with
thermal effects the average tan-
gential stress is approximately proportional
to
the square
of the rotational
speed.
Radial
Burst
Calculatlon:
1.
Calculatethemaximumaverageradialstressthroughthe
thickness of the disk web
for
rotation
only
(odd.
Stress
and Strain
313
2.
If
thermal gradients
are
present in the disk, calculate
the
maximum
average radial stress through the thick-
ness of the disk web
due
to temperature
(o-,).
3.
Typically, a factor of
.95
is applied to the ultimate
strength regardless of ductility for a radial burst cal-
culation. Since thermal stresses do not ratio with
speed,
the allowable rupture strength is degraded by
the magnitude of the radial stress due to temperature.
4.
Radial Bust Speed
=
([0.95
Ultimate Strength
-
o~&/omb~0,,)0-5
(100) (Rotational Speed).
Stresses
Due
to
Torsion,
Thrust,
and Bending loads
Rotating
shafts
may
be
subjected to a combination of tor-
sion,-,
and
axial
thrust
loads.
Since
these
loads
are
&n
a combination of static and
alternahg loads,
both
fatigue and
static strength criteria
are
considered in shafting design.
Select sections
as
illustrated in Figure
29
that include
holes, shoulder
fillets,
splines,
minimum
section
properties,
and other sources of stress concentration for
stress
and
life analysis. Calculate the maximum operating torque,
bending moment, and axial load at each section.
A gyroscopic moment
will cause an alternating bending
stress in the
shaft.
The torsional stress will remain steady.
Experimental results
[
1
11
indicate that the bending fatigue
strength is not sensitive to the torsional mean stress until
it exceeds the torsional yield strength by
as
much as
50%.
Bearings should be located near the largest masses con-
nected
to
the
shafting
to
minimize
the bending moments
as-
sociated with rectilinear accelerations and gyroscopic ef-
fects. Nonconcentrated loads should
be
limited to
85%
of
the yield strength.
Mechanical Couplings
T
=
63,025(HP}/N
where T =torque (in. lb)
N=rpm
HP
=
horsepower
Gearteeth
\
Minimum
c-
Figure
29.
Shafting features requiring
stress
analysis.
Moments may
be
imparted to the
shaft
by gear
loads,
reo
tilinear accelerations normal to the shaft or gyroscopic
loads. Gyroscopic loads
are
always considered for aircraft
applications of rotating shafting.
M,
=
I&
where
I
=
polar moment
of
inertia of
the
shaft
compo-
nents (in. lb
s=*)
o
=
angular velocity of
shaft
(radiandsec)
n=precession speed (radiandsec) or angular ve
locity of the shaft spin
axis
about an axis nor-
mal
to
the spin
axis
Flanged.
This
type
of coupling is used to transmit torque
through shear in the attaching bolts or by friction between
the adjacent flanges.
Figure
30
depicts two mating shaft flanges connected
with “body bound” bolts such that the torque is trans-
mitted solely
through
the bolts. The bolts themselves
pilot the radial position of the flange. With
this
type
of
assembly, it is necessary
to
ream the bolt holes on as-
sembly or use the same fixture for both parts. The bolt
shear stress is:
z
=
TNAR
where T
=
torque (in. lb)
N
=
number of bolts
A
=
bolt shear
area
(in.2)
R
=
bolt circle radius
(in.)
Figure
31
shows a rotating flanged joint where a cir-
cumferential flange pilot is used to control alignment
and the torque is transmitted by friction between the
bolted flange
surfaces.
The
bolt tensile
stress
required
to drive the torque by friction is:
6,
=
T/NARp
where
p
=
coefficient
of
friction (assume
0.1
for
metal
on metal contact)
314
Rules
of
Thumb
for
Mechanical Engineers
Figure
30.
Bolts transmit toque.
Circu&ce
of
mating
flanges
is radially piloted.
Figure
31
I
Friction between mating surfaces transmits
toque.
Splined.
The splined coupling in Figure
32
is a torque-
carrying connection with
axial
or
helical teeth on the outer
diameter and inner diameter of the male and female mem-
bers,
respectively. The involute spline profile is common and
similar
to
gear teeth. Splines differ from gears in that there
is
no rohg action andall teeth may contact
at
the
same
time.
When
fail=
occurs,
splines
usually
fail
by fretting
ur
fatigue.
The
two
basic
types
of
splines with
respect
to
fit
are
fixed
(nonworking) and flexible or floating (working) splines.
Fixed splines do not allow relative motion between the in-
ternal
and external teeth.
A
radial
press
fit
between the
in-
ternal
and external
teeth
ur
on aradial pdot
surface
of
the
shaft
adjacent to the spline prevents relative motion. Flexible
splines permit some
degree
of
rocking motion and can ac-
commodate axial movement between the mating shafts.
Case-hardened
surfaces
should be used with this spline type.
Positive lubrication
is
required
at all
times
for flexible splines
to
minimize
wear
and fretting. The
rim
or supporting ring
of
material beneath the spline teeth should have a minimum
thickness of
1.25
times the total tooth height.
Internal
spline
I
spline Pitch
dlameter
Highly
loaded aircraft splines will have spline lengths
ranging from
50%
to
100%
of
the pitch diameter. For flex-
ible splines, a wide face
width
has
limited
value
in
extendjng
the load-carrying capacity. Generally flexible splines
are
misaligned (since accommodation of misalignment is one
of its
main
functions),
thus the
contact
load between the
teeth
tends to load the ends
of
the spline. Increased length does
not relieve the intensity
of
the loading but will increase
the
time required
for
the wear in the center of
the
spline
to
catch
up with the wear at the ends. The number of spline teeth is
governed by cost and manufacturing considerations be-
cause doubling the number
of
teeth does not have a large
effect on the tooth
stresses,
i.e., the teeth become half as big
when doubled, but there
are
twice
as many teeth to carry
the load-the two effects tend to cancel each other.
A
complete evaluation of a splined coupling should in-
clude the tooth shear
stress,
torsional shear stress, tangen-
tial
or
bursting
stress
due to the
radial
load between the mt-
ing spline teeth and rpm, and the bearing
or
contact stresses
between the teeth. Allowable spline stresses depend upon
the material, severity of loading, number of torque cycles,
and whether the spline is
fxed
or
flexible. Fixed splines have
a greater ability to carry the contact stress because there is
no relative motion between
the
mating teeth.
Curvic@.
A
fixed curvic@ (a registered name by Gleason
Works in Rochester, New York) is a face spline with teeth
which
are
spaced circumferentially about the face and pos-
sess a characteristic curved shape when viewed in a plane
perpendicular to the coupling
axis
(Figure
33).
A
curvic@
Convex member
Concave member
Note
CUlVBture
on
teeth
Figure
33.
Curvic@ coupling.
Figure
52.
Splined coupling.