Báo cáo y học: " Is there a protective effect of normal to high intellectual function on mental health in children with chronic illness" docx
Bạn đang xem bản rút gọn của tài liệu. Xem và tải ngay bản đầy đủ của tài liệu tại đây (319.16 KB, 8 trang )
RESEARC H Open Access
Is there a protective effect of normal to high
intellectual function on mental health in children
with chronic illness?
Hilde K Ryland
1*
, Astri J Lundervold
1,2†
, Irene Elgen
3†
, Mari Hysing
2†
Abstract
Background: High intellectual function is considered as a protective factor for children’s mental health. Few
studies have investigated the effect of intellectual function on mental health in children with chronic illness (CI).
The aim of the present study was twofold: First, we asked if normal to high intellectual function (IQ) has a
protective effect on mental health in children with CI, and secondly, if this effect is more substantial than in their
peers (NCI).
Methods: The participants were selected among children who participated in the Bergen Child Study (BCS): 96
children with CI (the CI-group) and 96 children without CI (the NCI-group). The groups were matched on
intellectual function as measured by the WISC-III by selecting the same number of children from three levels of the
Full Scale IQ Score (FSIQ): “very low” (<70),"low” (70 to 84), or “normal to high” (>84). CI was reported by parents as
part of a diagnostic interview (Kiddie-SADS-PL) that also generated the mental heal th measures used in the present
study: the presence of a DSM-IV psychiatric diagnosis and the score on the Children’s Glo bal Assessment Scale.
Results: The risk of a psychi atric diagnosis was significantly lower for children with a normal to high FSIQ-level
than for children with a very low and low FSIQ-level in the CI-group as well as in the NCI-group. The group
differences were statistically non-significant for all three FSIQ-levels, and the effect of the interaction between the
group-variable (CI/NCI) and the FSIQ-level was non-significant on both measures of mental health.
Conclusion: The present study showed a protective effect of normal to high intellectual function on children’s
mental health. This protective effect was not more substantial in children with CI than in children without CI.
Background
Children with chroni c illness (CI) have an increased ris k
of mental health prob lems [1]. This was confirmed in a
population based study, the Bergen Child Study, show-
ing that children with CI had a higher risk of emotional
and behavioural problems a nd obtained a psychiatric
diagnosis more frequently than children without CI [2].
Mental healt h in children with CI is affected by a range
of factors, such as socioeconomic status (SES) [3], con-
dition severity, functional status, the child’s coping skills,
as well as intellectual function [4]. The identification of
risk and protective factors is important to improve treat-
ment and preventive efforts.
Intellectual function (IQ) is a factor that is known to
haveaconsiderableeffectonachild’smentalhealth.
First of all, it is well known that children with an IQ-
level below 70 have an increased risk of mental health
problems [5]. This increased risk is also shown in chil-
dren with what is often referred to as a borderline intel-
lectual disability [6-10]. On the other hand, high IQ is
considered as a protective factor for children’smental
health [5].
The association between IQ and mental health has
also been studied in children with CI. This was demon-
strated in a study by Howe and collaborators, showing
that the higher risk of behavioural problems in children
with neurological disorders compared to children w ith
other chronic illnesses was partly mediated by decre-
ments in IQ [11]. In a study by Goodman a nd Graham,
children with hemiplegia with below average IQ (70-99)
* Correspondence:
† Contributed equally
1
Centre for Child and Adolescent Mental Health, Uni Health, University of
Bergen, John Lunds plass 3, 5020 Bergen, Norway
Ryland et al . Child and Adolescent Psychiatry and Mental Health 2010, 4:3
/>© 2010 Ryland et al; licensee BioMed Central Ltd. This is an Open Access article distributed under the terms of the Creative Commons
Attribution License (http:// creativecommons.org/licenses/by/2.0), which permits unrestricted use, distribution, and reproduction in
any medium, provided the original work is properly cited.
had a 57 % rat e of mental health problems, compared to
28% in children with above average IQ [12]. In children
with sickle cell disease, the risk o f behaviour problems
has been shown to decrease with higher levels of intel-
lectual functioning [13].
Living with a CI commo nly implies that a child ha s to
cope with a higher level of stress than his o r her physi-
cally healthy peers, due to stressors originating from the
physical condition and its consequences [14]. Accord-
ingly, one should expect that a p rotective effect of nor-
mal to high IQ is even more substantial in children with
CI than in their peers. This was shown in a study by
Perrin and collaborators, including 96 healthy children
and 91 children with different chronic conditions, aged
7 to 18 years. All children obtained a score above 80 on
the Peabody Picture Vocabulary Test (PPVT), and men-
tal health was assessed by the ASEBA screening ques-
tionnaires (CBCL, TRF and YSR) [15]. As far as w e
know, the work by Thompson et al. [13] and Perrin et
al. [15] are the only studies focusing on the protective
effect of IQ in children with CI.
This motivated the present study to further explore the
protective effect of normal to high IQ (>85) in a case-
control selected sample from a population based study of
primary school children aged 7-11 years, including a sub-
sample of children with CI. The present study improves
on previous studies by including a measure of intellectual
function from a standardized test (WISC-III) [16] and
measures of mental health from a validated clinical inter-
view generating DSM-IV diagnoses (Kiddie-SADS-PL)
[17] and a general function score (the Children’s Global
Assessment Scale) [18]. The aim of the study was two-
fold: First, we asked if normal to high IQ had a protective
effect in children with CI, and secondly, if this effect was
more substantial than in their peers (NCI).
Methods
The Bergen Child Study
The Bergen Child Study (BCS) is an ongoing longitudi-
nal population -based study of children born in the yea rs
1993-1995 in the Bergen and Sund municipalities in
Norway. The protocol and population of the BCS is
described in detail elsewhere [19,20], and only a brief
summary will be given here.
The BCS included all children in the two municipali-
ties attending the 2
nd
to 4
th
primary school grades in
October 2002, when the children were 7 to 9 years old.
The total number of children attending these grades
was9430inBergenand222inSund.Thefirstwave
had a three-stage design. In the first screening stage,a
four-page questionnaire, including the Strengths and
Difficulties Questionnaire (SDQ) [21,22] and a question
about chronic illness or disability, was sent to all parents
and teachers. Parents of 74% of the children gave their
consent to participate. A child was defined as screen
positive if: (1) the SDQ total difficulties score exceeded
the 90
th
percentile cutoff according to parents or tea-
chers, (2) there was a severe impairment according to
parents or teachers on t he SDQ impact section, or (3)
the score on one of the other sc ales included in the
questionnaire exceeded the 98
th
percentile cutoff. The
families of children defined as screen positives in the
first stage and a random sample of screen negative chil-
dren were invited to participate in the second stage of
the BCS, with a participation rate of 44%. In t his second
stage, the parents were interviewed with the Develop-
ment and Well-Being Assessment (DAWBA) [23]. In
the third stage, an extensive clinical examination of a
case-control sample was performed (N = 329). The sam-
ple included 97 children who obtained a psychiatric
diagnosis accord ing to the DAWBA, 207 children with-
out any DAWBA diagnosis, and 25 children invited
directly from the first screening stage.
The study was approved by the Regional Committee
for Medical an d Health Research Ethics Western Nor-
way, and by the Data Inspectorate.
Instruments
The procedure of the third stage included a test of intel-
lectual f unction (Wechsler’s Intelligence Scale f or Chil-
dren, 3
rd
ed., WISC-III) [16] and a psychiatric diagnostic
interview (Schedule for Affective Disorders and Schizo-
phrenia for School-Age Children: Present and Lifetime
Version, Kidd ie-SADS-PL) [17], including an evaluation
of the child’ s general level of functioning (The Chil-
dren’s Global Assessment Scale, CGAS) [18].
Wechsler’ s Intelligence Scale for Children, 3
rd
ed
(WISC-III) is designed to assess intellectual func tion in
children and adolescents aged 6-16. The scale contains
13 subtests which generate scores of Verbal IQ, Perfor-
mance IQ, and Full Scale IQ, as well as four factor
scores [16]. WISC-III is a widely used test of intelle ctual
function, with strong criteri on validity [24]. In the pre-
sent study, the WISC-III was administered and scored
by well-trained and experienced test-technicians
employed at a Neuropsychological Outpatient Clinic.
Intellectual level was defined by the Full Scale IQ-score
(FSIQ) according to Swedish norms [25]. The FSIQ was
categorized into a very low level (FSIQ below 70), a low
level (FSIQ ranging from 70 to 84), and a normal to
high level (FSIQ equal to or above 85). The last category
included both children with a FSIQ-level within the nor-
mal range (i. e. 85 to 115) and 15 children with a higher
IQ-score (3 in the CI-group and 12 in the NCI-group).
The Schedule for Affective Disorders and Schizophrenia
for School Aged Children (6-18 years): Pre sent and Life-
time Version ( Kiddie-SADS-PL) is a semistructured
interview designed to evaluate current and past episodes
Ryland et al . Child and Adolescent Psychiatry and Mental Health 2010, 4:3
/>Page 2 of 8
of psychopathology in children (6-18 years old) accord-
ing to the criteria of DSM-IV [17]. Research has shown
that this version of the Kiddie-SADS gives an a ppropri-
ate schedule to assess current, past, and lifetime diag-
nostic status in children [26],andthatitgenerates32
reliable and valid DSM-III-R and DSM-IV Axis I child
psychiatric diagnoses [17]. In the present study, clinical
psychologists and MDs trained by a n experienced child
psychiatrist in using the instrument conducted the inter-
view, first with the parent(s) and l ater on the same day
with the child. Immediately after the assessment of both
info rmants the interviewer scored the diagnoses as defi-
nite, probable, in remission, or not present acco rding to
the Kiddie-SADS-PL schedule. When in doubt, cases
were discussed with the psychiatrist in charge of the
training procedure. In the present study we defined a
psychiatric disorder as any definite diagnosis. As part of
the Kiddie-SAD S-PL-interview the parents were asked if
the child had any physical illnesses or disabilities for
which ( s)he received or should receive regular care (for
example asthma, epilepsy, diabetes).
The Children’s Global Assessment Scale (CGAS) is a
100-point rating scale measuring the child’ s general
level of functioning. Scores above 70 indicate normal
function. The CGAS is considered a valid and reliable
tool for rating a child’s general level of functioning on a
health-illne ss continuum, and is recommended as a sup-
plement to syndrome-specific scales [18]. The CGAS is
part of the Kiddie-SADS-PL interview.
Participants in the present study
CI was defined as reported by parents on the question-
naire in the first stage of the BCS and confirmed by par-
ents in the clini cal interview in the third stage (i.e. still
present), and only physical conditions were included. An
experienced paediatrician categorized the reported ill-
nesses (Table 1). Children who no longer met the cri-
teria of a CI in the third stage (n = 12) were excluded
from the present study. Another five children were
excluded because of missing data (WISC-III and/or Kid-
die-SADS). The FSIQ-levels of the remaining 96 chil-
dren in the CI-group were used to se lect a matched
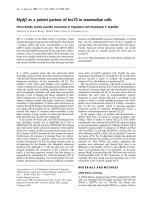
group of children without CI (the NCI-group). Using
the select random sam ple command in SP SS, an equal
number of children with a very low, low, and a normal
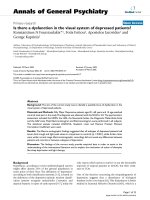
to high FSIQ-level were generated in both g roups (Fig-
ure 1). The percentage of screen positive and screen
negative children from the first stage of the BCS was
64.6% and 35.4%, respectively, in the CI-group, and
63.5% and 36.5% in the NCI-group.
Statistical analyses
For statistical analyses we used the SPSS version 15.0.
Descriptive statistics were used to explore characteristics
of the sample concerning gender, age, FSIQ and psy-
chiatric disorders. Chi square tests were used to detect
statistically significant differences in psychiatric disor-
ders according to group (CI/NCI) and FSIQ-level.
Binary logistic regression analyses were conducted to
further explore the impact of normal to high intellectual
function on mental health, using group (CI/NCI) and
FSIQ-level (very low, low, and normal to high) as pre-
dictors and any Kiddie-SADS diagnosis as the dependent
variable. T he analyses were conducted in the following
way: First, the main effect of each predictor was
explored (Model A). As the FSIQ-level variable had
three categories and our focus was on the impact of a
normal to high FSIQ-level, separate analyses we re con-
ducted with the very low and the low FSIQ-level as the
reference group. Secondly, the interaction was explored
(Model B). Main effects are presented as odds ratios
(OR) with 95 percent confidence intervals and the inter-
action effect as chi square (x
2
).
A two-way between-groups analysis of variance
(ANOVA) was performed to explore simultaneously the
impact of group (CI/NCI) and FSIQ-level on the general
level of functioning, as measured by the CGAS. Further-
more, one-way ANOVA was performed for the CI- and
NCI-group separately to explore within-group differ-
ences between the three FSIQ-levels on the CGAS.
Finally, an independent samples t-test was performed
for the three FSIQ-levels sepa rately to explore differ-
ences between the CI- and NCI-group on the CGAS.
Results
Characteristics of the sample
Boys constituted 64.6% of the sample in both groups,
with an even distribution of age across the CI- (M = 9.7
years, SD = .95) and the NCI-group (M = 9.5 years, SD
= .99). In the CI-group, mean FSIQ was 56.83 (SD =
12.28, r ange = 37-69), 79.00 (SD = 3.83, range = 72- 84),
and 97.73 (SD = 9.21, range = 8 5-128) within th e three
FSIQ-levels. The corresponding numbers in the NCI-
group were 56.50 (SD = 9.02, range = 41-69), 77.95 (SD
= 4.92, range = 71-84), and 101.91 (SD = 11.60, range =
85-126).
Psychiatric disorders according to group (CI/NCI) and
FSIQ-level
In this case-control selected sample matched on FSIQ-
level, the overall percentage of psychiatric disorders was
51% in the CI-group and 35.4% in the NCI-group. This
difference was statistically significant (x
2
(1) = 4.16, p =
.04). Within the CI-group, the percentage of psychiatric
disorders fo r children with a normal to high FSIQ-level
(37.5%) was significantly lower than the percentage for
children with a very low (72.2%) (x
2
(1) = 5.29, p =.02)
and low FSIQ-level (68.2%) (x
2
(1) = 4.81, p = .03), while
Ryland et al . Child and Adolescent Psychiatry and Mental Health 2010, 4:3
/>Page 3 of 8
BCS 3.stage
n=329
CI
n=118
Excluded:
No longer CI (12)
Missing data (5)
Very low FSIQ-level (5)
CI
n=96
DAWBA any diagnosis (27)
DAWBA no diagnosis (51)
Invited directly from stage 1 (18)
Very low FSIQ-level
n=18
Low FSIQ-level
n=22
Normal to high
FSIQ-level
n=56
NCI
n=211
Excluded:
Not matched on
FSIQ-level (115)
NCI
n=96
DAWBA any diagnosis (34)
DAWBA no diagnosis (62)
Very low FSIQ-level
n=18
Low FSIQ-level
n=22
Normal to high
FSIQ-level
n=56
Figure 1 Flow chart visualizing the selection procedure. BCS = Bergen Child Study; CI = Chronic Illness; NCI = No Chronic Illness; FSIQ-level
= Full Scale IQ-level; DAWBA = Development and Well-Being Assessment.
Table 1 Reported chronic illnesses and disabilities (n = 96)
Neurological (n = 22)* Atopic (n = 50)* Somatic (n = 24)*
Epilepsy (8) Allergies (41) Skeletal disorders (11)
Migraine (6) Allergy not specified (17) Deformations of the foot (3)
Learning disabilities (6) Pollen (15) Cheilognathopalatochisis (2)
Cerebral palsy (4) Animals (8) Malformations (2)
Hydrocephalus (2) Food (7) Hypermobility of the joints (1)
Down syndrome (1) Dust mite (4) Disease in the hip (1)
William syndrome (1) House dust (5) Perthes disease (1)
Frontal lobe damage (1) Nickel (1) Scoliosis (1)
Sequela meningitis (1) Vaccines (1) Gastro-intestinal disorders
Brain tumour (1) Asthma (37) Reflux (4)
Eczema (8) Coeliac disease (3)
Disease in the gallbladder (1)
Disease in the liver (1)
Sensory impairments (3)
Visual deficit (2)
Hearing deficit (1)
Endocrine disorders (2)
Hypothyreosis (2)
Kidney disorder (1)
Haemophiliac (1)
Juvenile Rheumatoid Arthritis (1)
Other (1)
Malaria (1)
*Numbers add up to more than 22, 50 and 24 because some children had multiple diagnoses.
Ryland et al . Child and Adolescent Psychiatry and Mental Health 2010, 4:3
/>Page 4 of 8
the difference between children with very low and low
FSIQ-levels was non-significant. In the NCI-group, the
percentage of psychiatric disorders for children with a
normal to high FSIQ-level (23.2% ) was significantly
lower than the percentage for children with a very low
(55.6%) (x
2
(1) = 5.23, p =.02)andlowFSIQ-level
(50.0%) (x
2
(1) = 4.14, p = . 04), while the difference
between the very low and low FSIQ-level was non-sig-
nificant. The differences in percentages of psychiatric
disorders between the CI- and the NCI-group were
non-significant within each of the three FSIQ-levels
(Table 2).
Thelogisticregressionanalyses showed that children
with CI had a twofold increased risk of psychiatric dis-
order compared to children without CI (OR = 2.04, 95%
CI: 1.11-3.77). Children with a normal to high FSIQ-
level had a significantly lower risk of psychiatric disorder
compared to children with a very low (OR = .236, 95%
CI: .11 53) and low FSIQ-level (OR = .291, 95% CI: .14-
.61) (Table 3). There was no significant interaction
between CI and FSIQ-level with regard to risk of psy-
chiatric disorder (x
2
(2) = .01, p = .99).
General level of functioning according to group (CI/NCI)
and FSIQ-level
The results of the two-way ANOVA showed a signifi-
cant main effect for FSIQ-level regarding the general
level of functioning (F(2, 186) = 30.96, p = .001) (partial
eta squared = .25). Post hoc comparisons using t he
Tukey HSD test indicated that the mean CGAS-scores
for children with a very low (M = 54.28, SD = 14.16),
low (M = 68.95, SD = 15.90), and normal to high FSIQ-
level (M = 77.34, SD = 15.75) were significantly differ-
ent. The main effect for CI and the interaction effect
were not significant.
Within the CI-group, the one-way ANOVA s howed a
significantdifferenceatthep =.05levelontheCGAS-
score for the three FSIQ-levels (F(2, 93) = 9.61 , p =
.001) (eta squared = .17). The post hoc test indicated
that the mean score for children with a very low FSIQ-
level (M = 54.83, SD = 15.63) was signifi cantly different
from the mean score of children with a low (M = 69.73,
SD = 17.06) and normal to high FSIQ-level (M = 74.25,
SD = 16.29). Children with a low and normal to high
FSIQ-level did not differ significantly from each other.
Within t he NCI-group, the one-way ANOVA showed a
significant difference at the p = .05 level on the CGAS-
score for the three FSIQ-levels (F(2, 93) = 24.56, p =
.001) (eta squared = .35). The post hoc test indicated
that the mean scores fo r children with a very low (M =
53.72, SD = 12.97), low (M = 68.18, SD = 15.01), and
normal to high FSIQ-level (M = 80.43, SD = 14.69) were
significantly different.
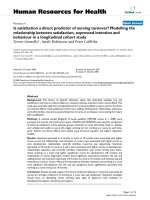
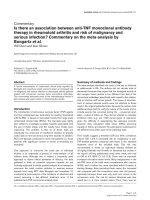
Among children with a normal to high FSIQ-level,
results of the t-test showed a significant difference on
the mean CGAS-score between the CI-group (M =
74.25, SD = 16.29) and the NCI-group (M = 80.43, SD =
14.69; t(110) = 2.11, p = .04, eta squared = .004).
Among children with a very low and low FSIQ-level, the
t-tests showed no significant differences on the mean
CGAS-score between the two groups (Figure 2).
Discussion
In the present case-control study of primary school chil-
dren, having a CI was associated with a higher risk of
psychiatric disorder as asse ssed by the Kiddie-SADS-PL.
The percentage of psychiatric disorders decreased and
Table 2 Number of children with and without any psychiatric diagnosis (Kiddie-SADS-PL) according to FSIQ-level
(n = 192)
CI-group Very low FSIQ-level (<70) Low FSIQ-level (70-84) Normal to high FSIQ-level (>85)
Any psychiatric diagnosis, n (%) 13 (72.2) 15 (68.2) 21 (37.5)*
No psychiatric diagnosis, n (%) 5 (27.8) 7 (31.8) 35 (62.5)
Total, n (%) 18 (100) 22 (100) 56 (100)
NCI-group
Any psychiatric diagnosis (%) 10 (55.6) 11 (50.0) 13 (23.2)*
No psychiatric diagnosis (%) 8 (44.4) 11 (50.0) 43 (76.8)
Total (%) 18 (100) 22 (100) 56 (100)
*The frequency of psychiatric disorders in children with a normal to high FSIQ-level was significantly lower than in children with a very low and low FSIQ-level.
Kiddie-SADS-PL = The Schedule for Affective Disorders and Schizophrenia for School Aged Children (6-18 years): Present and Lifetime Version; FSIQ-level = Full
Scale IQ-level; CI-group = Children with chronic illness; NCI-group = Children without chronic illness.
Table 3 Risk of psychiatric disorder (any Kiddie-SADS-PL
diagnosis) by group (CI/NCI) and FSIQ-level (n = 192)
Predictor OR 95% CI p-value
Chronic illness 2.04 (1.11-3.77) .02
Normal to high FSIQ-level versus very low
FSIQ-level
.236 (.11 53) .0005
Normal to high FSIQ-level versus low FSIQ-
level
.291 (.14 61) .001
Kiddie-SADS-PL = The Schedule for Affective Disorders and Schizophrenia for
School Aged Children (6-18 years): Present and Lifetime Version; FSIQ-level =
Full Scale IQ-level; CI = Chronic Illness; NCI = No Chronic Illness.
Ryland et al . Child and Adolescent Psychiatry and Mental Health 2010, 4:3
/>Page 5 of 8
the general level of functioning increased as a function
of higher FSIQ -level both in the CI-and the NCI-group.
The protective effect of a normal to high FSIQ-level was
not more substantial in children with CI, supporting an
overall protective effect of normal to high intel lectual
function on children’s mental health.
More than half of the children in the CI-group met
the criteria of a psychi atric disorder, compared to a
third of the children in the NCI-group. Thus, even
when the two groups were matched on FSIQ-level, the
overall percentage of psychiatric disorders was still sig-
nificantl y higher in children with CI. The estimated risk
of psychiatric disorder in this case-control sample o f
children with CI is in accordance with the twofold
increased risk of mental health problems in children
with CI shown in a study of the whole population of the
BCS [2]. Although the risk is similar, the overall percen-
tage of psychiatric disorders is higher, as expected due
to the selection of participants to this stage of the BCS.
The present study showed that children with a FSIQ-
level b etween 70 and 84 had a similar risk estimate of
psychiatric disorders as children with a FSIQ-level
below 70 - a risk that was significantly higher than for
children with a FSIQ-level of 85 or above. This finding
is in accordance with the results of Goodman and colla-
borators, showing that healthy children with low IQ
within the normal range (defined as WISC-R FSIQ in
the range 70-89) had more behavioural problems com-
pared to those with higher IQ-scores [10]. It is also con-
sistent with the findings of Dekker and collaborators,
showing that children with borderline intellectual dis-
ability (IQ-range 60-80) and those with moderate intel-
lectual disability (IQ-range 30-60) had a similar rate and
estimated risk of mental health problems that was sig-
nificantly higher than for childre n with a higher level of
intellectual function [7].
A protective effect of normal to high intellectual func-
tion was found both in the CI- and the NCI-group.
Such an overal l effect was contrary to what we expected
from the stressors associated with CI and from the find-
ings of Perrin et al. [15]. The differences between the
results in Perrin and collaborators’ and the present
study may partly be ascribed to methodological factors.
First o f all, Perrin et al. had the focus on children with
an IQ-score above 80, as it was measured by an unstan-
dardized test of intellectual function (the PPVT). Sec-
ondly, the measures of mental health, the recruitment
procedures and characteristics of the samples are quite
different i n the two studies. In Perrin et al.’s study, the
healthy childr en were recruited from public and priv ate
schools, while the children with CI were recruited
through generalist and specialist pediatric offices. The
children participating in the present study were part of
the same case-control sample selected from the BCS-
population, with the same percentage of screen positive
and screen negative children in the CI- and the NCI-
group. Furthermore, the two groups in our study were
matched on FSIQ-level. Consequently, the CI- and the
NCI-group in the present study were probably more
similar on critical variables than the corresponding
groups in Perrin and collaborators’ study.
Strengths and limitations
The main strength of the study was the use of a stan-
dardized test of intellectual function (WISC-III) and a
validated clinical interview generating DSM-IV diag-
noses (Kiddie-SADS-PL ). Moreover, the study sample
was drawn from a population of children from the sec-
ond largest city of Norway and included both screen
positive and screen negative children. An additional
strength was the use of a comparison group matched on
FSIQ-level.
Figure 2 Line graph showing mean CGAS-score for group (CI/NCI) and FSIQ-level (n = 192). CGAS = Children’s Global Assessment Scale;
CI = Chronic Illness; NCI = No Chronic Illness; FSIQ-level = Full Scale IQ-level.
Ryland et al . Child and Adolescent Psychiatry and Mental Health 2010, 4:3
/>Page 6 of 8
Some limitations should be mentioned. First of all, the
use of categorical IQ measures reduced the statistical
power of our analyses. The categorical levels were
included due to our focus on children with an IQ-level
within the normal range and higher, and it should be
mentioned that an analysis o f the full range of FSIQ-
scores did not change the results concerning the impact
of IQ on mental health problems. Secondly, the IQ-dis-
tribution of the CI-group wasskewed.Only3children
had an IQ-level above the normal range (>115), com-
pared to 12 children in the NCI-group. This skewness
probably reflects what the case is for children with CI as
a group: compared to their peers, they have a higher fre-
quency of general and specific learning disabilities,
which in turn is associated with lower mean IQ [5].
Finally, although the protective effect of normal to high
IQ was not more substantial i n children with CI in the
present study, it is still an important protective factor in
relation to risk of mental health problems in this group
of children. However, IQ only explained some of the
association between CI and mental health. In future stu-
dies we will include other factors considered important
for the mental health of children with CI.
Clinical implications
The present study showed that children with a normal
to high FSIQ-level had bette r mental health than chil-
dren with a very low and low FSIQ-level. The frequen-
cies of psychiatric disorders were somewhat higher in
the CI-group compared to the NCI-group within all
three FSIQ-levels. Paediatricians and others working
with children with CI should be aware of this increased
risk of mental health problems and the need of psycho-
logical support not only for children with low IQs, but
alsoforchildrenwithanIQ-scorewithinthenormal
range of intellectual function.
Conclusion
The present study showed a protective effect of normal
to high intellectual function on children’s mental health.
This pro tective effect was not more substantial in chil-
dren with CI than in children without CI. Future studies
should validate the clinical significance of the present
findings and include other potential protective factors in
children with CI.
Abbreviations
BCS: Bergen Child Study; CGAS: Children’s Global Assessment Scale; CI:
Chronic Illness; CI-group: Children with chronic illness; FSIQ: Full Scale IQ; IQ:
Intellectual function; Kiddie-SADS-PL: Schedule for Affective Disorders and
Schizophrenia for School Aged Children (6-18 years): Present and Lifetime
Version; NCI-group: Children without chronic illness; WISC-III: Wec hsler
Intelligence Scale for Children, 3
rd
Ed.
Acknowledgements
The present study was supported by the University of Bergen, the
Norwegian Directorate for Health and Social Affairs, and the Western Norway
Regional Health Authority. We are grateful to the children, parents, and
teachers who participated in the BCS, and to the BCS project group for
making the study possible.
Author details
1
Centre for Child and Adolescent Mental Health, Uni Health, University of
Bergen, John Lunds plass 3, 5020 Bergen, Norway.
2
Department of Biological
and Medical Psychology, University of Bergen, Jonas Lies vei 91, 5009
Bergen, Norway.
3
Department of Pediatrics, Haukeland University Hospital,
5021 Bergen, Norway.
Authors’ contributions
HKR has been responsible for the data analysis and the writing of the
manuscript. AJL designed and coordinated the study, supervised the data
analysis and the writing process. MH has been responsible for creating data
files, has supervised the data analyses and commented on the written drafts
of the manuscript. IE was responsible for defining and categorizing the
chronic illnesses reported in the study, and commented on written drafts of
the manuscript. All authors have read and approved the final manuscript.
Competing interests
The authors declare that they have no competing interests.
Received: 25 August 2009
Accepted: 20 January 2010 Published: 20 January 2010
References
1. Lavigne JV, Faier-Routman J: Psychological adjustment to pediatric
physical disorders: a meta-analytic review. J Pediatr Psychol 1992,
17(2):133-157.
2. Hysing M, Elgen I, Gillberg C, Lie SA, Lundervold AJ: Chronic physical
illness and mental health in children. Results from a large-scale
population study. J Child Psychol Psychiatry 2007, 48(8):785-792.
3. Cadman D, Rosenbaum P, Boyle M, Offord DR: Children with chronic
illness: family and parent demographic characteristics and psychosocial
adjustment. Pediatrics 1991, 87(6):884-889.
4. Lavigne JV, Faier-Routman J: Correlates of psychological adjustment to
pediatric physical disorders: a meta-analytic review and comparison
with existing models. J Dev Behav Pediatr 1993, 14(2):117-123.
5. Goodman R, Scott S: Child psychiatry. Oxford: Blakwell 2005.
6. Dekker MC, Koot HM: DSM-IV disorders in children with borderline to
moderate intellectual disability. I: prevalence and impact. J Am Acad
Child Adolesc Psychiatry 2003, 42(8):915-922.
7. Dekker MC, Koot HM, Ende van der J, Verhulst FC: Emotional and
behavioral problems in children and adolescents with and without
intellectual disability. J Child Psychol Psychiatry 2002, 43(8):1087-1098.
8. Gillberg C, Soderstrom H: Learning disability. Lancet 2003,
362(9386):811-821.
9. Goodman R: The relationship between normal variation in IQ and
common childhood psychopathology: a clinical study. Eur Child Adolesc
Psychiatry 1995, 4(3):187-196.
10. Goodman R, Simonoff E, Stevenson J: The impact of child IQ, parent IQ
and sibling IQ on child behavioural deviance scores. J Child Psychol
Psychiatry 1995, 36(3):409-425.
11. Howe GW, Feinstein C, Reiss D, Molock S, Berger K: Adolescent adjustment
to chronic physical disorders–I. Comparing neurological and non-
neurological conditions. J Child Psychol Psychiatry 1993, 34(7):1153-1171.
12. Goodman R, Graham P: Psychiatric problems in children with hemiplegia:
cross sectional epidemiological survey. BMJ 1996, 312(7038):1065-1069.
13. Thompson RJ Jr, Armstrong FD, Link CL, Pegelow CH, Moser F, Wang WC: A
prospective study of the relationship over time of behavior problems,
intellectual functioning, and family functioning in children with sickle
cell disease: a report from the Cooperative Study of Sickle Cell Disease. J
Pediatr Psychol 2003, 28(1):59-65.
14. Wallander JL, Varni JW, Babani L, Banis HT, Wilcox KT: Family resources as
resistance factors for psychological maladjustment in chronically ill and
handicapped children. J Pediatr Psychol 1989,
14(2):157-173.
Ryland et al . Child and Adolescent Psychiatry and Mental Health 2010, 4:3
/>Page 7 of 8
15. Perrin EC, Ayoub CC, Willett JB: In the eyes of the beholder: family and
maternal influences on perceptions of adjustment of children with a
chronic illness. J Dev Behav Pediatr 1993, 14(2):94-105.
16. Wechsler D: Wechsler Intelligence Scale for Children. San Antonio, TX:
Psychological Corp, Third 1991.
17. Kaufman J, Birmaher B, Brent D, Rao U, Flynn C, Moreci P, Williamson D,
Ryan N: Schedule for Affective Disorders and Schizophrenia for School-
Age Children-Present and Lifetime Version (K-SADS-PL): initial reliability
and validity data. J Am Acad Child Adolesc Psychiatry 1997, 36(7):980-988.
18. Shaffer D, Gould MS, Brasic J, Ambrosini P, Fisher P, Bird H, Aluwahlia S: A
children’s global assessment scale (CGAS). Arch Gen Psychiatry 1983,
40(11):1228-1231.
19. Heiervang E, Stormark KM, Lundervold AJ, Heimann M, Goodman R,
Posserud MB, Ullebo AK, Plessen KJ, Bjelland I, Lie SA, et al: Psychiatric
disorders in Norwegian 8- to 10-year-olds: an epidemiological survey of
prevalence, risk factors, and service use. J Am Acad Child Adolesc
Psychiatry 2007, 46(4):438-447.
20. Stormark KM, Heiervang E, Heimann M, Lundervold A, Gillberg C: Predicting
nonresponse bias from teacher ratings of mental health problems in
primary school children. J Abnorm Child Psychol 2008, 36(3):411-419.
21. Goodman R: The extended version of the Strengths and Difficulties
Questionnaire as a guide to child psychiatric caseness and consequent
burden. J Child Psychol Psychiatry 1999, 40(5):791-799.
22. Goodman R: Psychometric properties of the strengths and difficulties
questionnaire. J Am Acad Child Adolesc Psychiatry 2001, 40(11):1337-1345.
23. Goodman R, Ford T, Richards H, Gatward R, Meltzer H: The Development
and Well-Being Assessment: description and initial validation of an
integrated assessment of child and adolescent psychopathology. J Child
Psychol Psychiatry 2000, 41(5):645-655.
24. Zimmerman IL, Woo-Sam JM: Review of the criterion-related validity of
the WISC-III: the first five years. Percept Mot Skills 1997, 85(2):531-546.
25. Sonnander S, Ramund B, Smedler A-C: WISC-III Manual. Svenske
Psykologforlaget 1998.
26. Ambrosini PJ: Historical development and present status of the schedule
for affective disorders and schizophrenia for school-age children (K-
SADS). J Am Acad Child Adolesc Psychiatry 2000, 39(1):49-58.
doi:10.1186/1753-2000-4-3
Cite this article as: Ryland et al.: Is there a protective effect of normal to
high intellectual function on mental health in children with chronic
illness?. Child and Adolescent Psychiatry and Mental Health 2010 4:3.
Submit your next manuscript to BioMed Central
and take full advantage of:
• Convenient online submission
• Thorough peer review
• No space constraints or color figure charges
• Immediate publication on acceptance
• Inclusion in PubMed, CAS, Scopus and Google Scholar
• Research which is freely available for redistribution
Submit your manuscript at
www.biomedcentral.com/submit
Ryland et al . Child and Adolescent Psychiatry and Mental Health 2010, 4:3
/>Page 8 of 8