Báo cáo y học: "Comparison of monitoring performance of Bioreactance vs. pulse contour during lung recruitment maneuvers" pdf
Bạn đang xem bản rút gọn của tài liệu. Xem và tải ngay bản đầy đủ của tài liệu tại đây (397.42 KB, 6 trang )
Open Access
Available online />Page 1 of 6
(page number not for citation purposes)
Vol 13 No 4
Research
Comparison of monitoring performance of Bioreactance vs. pulse
contour during lung recruitment maneuvers
Pierre Squara, Dominique Rotcajg, Dominique Denjean, Philippe Estagnasie and Alain Brusset
ICU, Clinique Ambroise Paré, 27 bd Victor Hugo, 92200 Neuiily-sur-Seine, France
Corresponding author: Pierre Squara,
Received: 18 May 2009 Revisions requested: 22 Jun 2009 Revisions received: 30 Jun 2009 Accepted: 28 Jul 2009 Published: 28 Jul 2009
Critical Care 2009, 13:R125 (doi:10.1186/cc7981)
This article is online at: />© 2009 Squara et al.; licensee BioMed Central Ltd.
This is an open access article distributed under the terms of the Creative Commons Attribution License ( />),
which permits unrestricted use, distribution, and reproduction in any medium, provided the original work is properly cited.
Abstract
Introduction This study was designed to test the hypothesis of
equivalence in cardiac output (CO) and stroke volume (SV)
monitoring capabilities of two devices: non invasive
transthoracic bioreactance (NICOM), and a pulse contour
analysis (PICCO PC) coupled to transpulmonary thermodilution
(PICCO TD).
Methods We included consecutive patients of a single ICU
following cardiac surgery. Continuous minute-by-minute
hemodynamic variables obtained from NICOM and PICCO PC
were recorded and compared in 20 patients at baseline, during
a lung recruitment maneuver (20 cmH
2
O of PEEP) and following
withdrawal of PEEP. PICCO TD measurements were also
determined. We evaluated the accuracy of these two
technologies at baseline using PICCO TD as reference and we
estimated the precision by the fluctuation around the mean value
(2SD/mean). Then, we assessed time response, amplitude
response and reliability for detecting expected decreases when
PEEP was applied. Type I and type II errors were analyzed.
Results CO values (PICCO TD) ranged from 1.6 to 8.0 L.min
-1
.
At baseline, CO values were comparable for NICOM, PICCO
PC and PICCO TD: 5.0 ± 1.2, 4.7 ± 1.4 and 4.6 ± 1.3 L.min.
-1
,
respectively (NS). Limits of agreements with PICCO TD were
1.52 L.min.
-1
for NICOM and 1.77 L.min.
-1
for PICCO PC, NS.
The 95% statistical power gives an equivalence with a threshold
of 0.52 L.min.
-1
for NICOM vs. PICCO PC. The CO precision
was 6 ± 3% and 6 ± 5% for NICOM and PICCO PC,
respectively, NS. When PEEP was applied, CO was reduced by
33 ± 12%, 31 ± 14% and 32 ± 13%, for NICOM, PICCO PC
and PICCO TD, respectively (NS). Time response was 3.2 ± 0.7
minute for NICOM vs. 2 ± 0.5 minute for PICCO PC (NS). SV
results were comparable to those for CO.
Conclusions Although limited to 20 patients, this study has
enough power to show comparable CO and SV monitoring
capabilities of Bioreactance and pulse contour analysis
calibrated by transpulmonary thermodilution.
Introduction
Cardiac output (CO) and stroke volume (SV) are fundamental
physiologic variables used for diagnosis and guiding therapy
in many clinical settings. The most widely trusted technology
for measuring these variables is still bolus thermodilution [1,2].
However, this technology only allows for measurements at dis-
crete moments in time and measurements are usually obtained
only a few times per day. In addition, bolus thermodilution is
invasive, costly and significantly time consuming for highly
trained medical personnel when placing a pulmonary artery
catheter and for its subsequent care. Increasingly, it has been
recognized that monitoring and treatment protocols should be
based on frequent customization of fluid and drug treatment,
relying on continuous monitoring and measurement of
dynamic hemodynamic responses vs. snapshots of CO or fill-
ing pressures [3-5]. This has led to the emergence of several
continuous, less invasive and easier to use modalities.
Clearly, the information and clinical utility of technologies that
provide discrete measurements of CO obtained from bolus
thermodilution and those that offer continuous CO monitoring
capabilities are different [6]. The criterion by which a CO
measurement device is evaluated is primarily the accuracy of
measurements quantified by the averaged bias and the inter-
patient variability of bias versus a reference method [7]. How-
ever, for continuous monitoring devices, time-dependent
CO: cardiac output; HR: heart rate; NS: not significant; PC: pulse contour; PEEP: positive end expiratory pressure; SD: standard deviation; SV: stroke
volume; TD: thermodilution.
Critical Care Vol 13 No 4 Squara et al.
Page 2 of 6
(page number not for citation purposes)
criteria such as precision (variability over time due to random
error of measurements), time response, amplitude response,
and ability to detect clinically meaningful changes are of pri-
mary importance [8].
A new, continuous, noninvasive CO monitoring (NICOM
®
)
device based on analysis of transthoracic Bioreactance
®
has
been introduced recently [9]. Bioreactance is the analysis of
the variation in the frequency spectra of a delivered oscillating
current that occurs when the current traverses the thoracic
cavity, as opposed to the traditional bioimpedance, which
relies only on analysis of changes in signal amplitude. Three
prior validation studies comparing bioreactance to bolus ther-
modilution (PAC) [10], continuous thermodilution (PAC CCO)
[8], and arterial pulse wave analysis (VIGILEO) [11] showed
that bioreactance was comparable with these other methods
based on the criteria noted above. The aim of the present
study was to compare the CO monitoring capabilities of the
bioreactance technology with those of a pulse contour (PC)
based technology coupled with transpulmonary thermodilution
(TD) during a hemodynamic challenge, namely lung recruit-
ment maneuvers, in post-cardiac surgery patients.
Materials and methods
The protocol was approved by our institutional review board.
Informed consent was obtained from each patient. A
PICCO+
®
system (Pulsion Medical System, Munich, Ger-
many) was inserted to determine CO from both TD and PC in
patients in whom hemodynamic monitoring was indicated
according to our standard clinical practice. The arterial line
was inserted in the radial artery [12]. Noninvasive bioreac-
tance CO monitoring was obtained using the NICOM
®
system
(Cheetah Medical Inc., Portland, OR, USA) described previ-
ously [13]. All PICCO+ and NICOM continuous variables
were recorded simultaneously using a computer data logger
that recorded data at one minute intervals.
Data were obtained from 20 post-cardiac surgery, intubated
and mechanically ventilated patients at a single center.
Patients were studied during a period of hemodynamic stabil-
ity just prior to weaning off mechanical ventilation [14] and
there were no changes in therapy during the protocol. All
patients had post-operative echocardiography to check the
absence of tricuspid, mitral or aortic valve insufficiency. The
PICCO+ and NICOM devices were calibrated as recom-
mended by the manufacturers. For PICCO+ this consisted of
obtaining three concordant (<20% differences) bolus TDs,
automatically used by the system to calibrate the PC analysis.
The NICOM device was calibrated during a five-minute auto-
calibration cycle. In each patient, a lung recruitment maneuver,
consisting of applying 20 cmH
2
O positive end expiratory pres-
sure (PEEP) for 10 minutes, was introduced. PEEP was
reduced to 15 cmH
2
O when poorly tolerated. For both PICCO
PC and NICOM, CO, SV and heart rate (HR) trends were
recorded minute by minute for 10 minutes prior to PEEP
(baseline), during a 10-minute period of PEEP application, and
for 10 minutes following withdrawal of the PEEP, so that the
total number of measurements for inter device comparison
was 30. The reference CO values were obtained by three con-
cordant bolus PICCO TDs after the initial calibration just
before PEEP during the baseline period, during the application
of PEEP, and after withdrawal of PEEP. This automatically led
to recalibrate the PICCO PC signal three times during the 30-
minute period of the protocol.
Accuracy (i.e., bias) was quantified by the difference between
values assessed by the two monitoring devices and PICCO
TD. We compared CO, SV and HR values at the following
three time periods: the average values during the three min-
utes immediately before PEEP (baseline, protocol minutes 8,
9 and 10); during the three-minute period of lowest CO values
during PEEP (between protocol minutes 10 and 20); and dur-
ing the final three minutes following withdrawal of PEEP (pro-
tocol minute 28, 29 and 30).
Precision (the variability due to random error of measure-
ments) is most easily quantified during periods of stable CO,
such as the 10 minute baseline period of the protocol. During
this period, we obtain 10 CO measurements. From these 10
measurements, we determined the mean and standard devia-
tion (SD) of the measurement. Precision is then determined as
two × SD/mean.
Time response was quantified as the delay between the PEEP
application and the point when the minimum CO was
obtained. Amplitude response was assessed as the difference
between the average baseline CO and the minimum CO
recorded during PEEP.
To test globally the ability to detect significant CO changes
and the equivalence of monitoring capabilities of NICOM and
PICCO PC we calculated the cross correlations between the
two technologies, including the 30 recorded minutes of the
protocol.
Data analysis
Studied values were different according to the studied criteria
(see above). For accuracy of continuous monitoring technolo-
gies (NICOM and PICCO PC), average baseline values from
three minutes were compared with the reference (PICCO TD)
using linear regressions analysis with coefficient of determina-
tion (R) derivation and comparison with identity line. Bias was
calculated as the difference in mean values (reported as inter
patient mean ± SD). Relative error (absolute value of bias/
mean) and limits of agreements (± 2 × SD about the differ-
ences of mean values between two modalities) were deter-
mined [15]. The proportion of patients for which the bias was
acceptable according to the criteria determined by Critchley
and Critchley [16] was also reported. Student t-tests were
used to reject the null hypothesis. However, absence of
Available online />Page 3 of 6
(page number not for citation purposes)
evidence is not evidence of absence [17,18]. A non-significant
difference between two devices does not take into considera-
tion type II errors. To test equivalence of bias, we compared
the confidence interval of the differences and estimated the
threshold of difference in means that gives a statistical power
of 95% (for t-test).
Results
The study participants included 14 men and 6 women, age 69
± 13 years. Nine patients received coronary grafts, seven
patients underwent valve replacements (including two mitral
valve repairs) and four patients had mixed interventions. Left
ventricular ejection fraction was 52 ± 9%. At the time of the
protocol, none of the patients had circulatory failure or acute
pulmonary edema (partial pressure of arterial oxygen/fraction
of inspired oxygen = 281 ± 58 mmHg). Seven patients were
receiving a moderate degree of inotropic support (five patients
were receiving dobutamine 5 g/kg/min, two patients were
receiving adrenaline 0.25 mg/h, no patient received noradren-
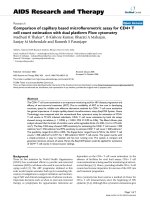
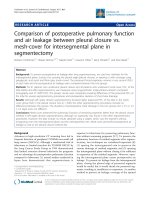
aline). Figure 1 shows a typical example of the minute-by-
minute CO values from NICOM and PICCO PC during the 30-
minute protocol. As seen, CO values are comparable at base-
line, decrease rapidly with the introduction of PEEP, reaching
similar minimum values within three to four minutes, and
rebound to a plateau after another two to three minutes. Fol-
lowing withdrawal of PEEP, at protocol minute 20, CO returns
to near the original baseline value. During the protocol (base-
line, PEEP and return to baseline), the HR was quite stable: 93
± 22, 95 ± 24, and 92 ± 19 beats/min, respectively (not sig-
nificant (NS)); the corresponding mean systemic pressure was
78 ± 13, 63 ± 18, and 79 ± 14 mmHg, respectively (P < 0.01
for pressure during PEEP application vs. baseline and return
to baseline).
For the data as a whole, CO values were comparable for
NICOM, PICCO PC, and PICCO TD at baseline (5.03 ± 1.16,
4.73 ± 1.44, and 4.61 ± 1.26 L/min, respectively; NS), at their
nadir following introduction of PEEP (3.34 ± 0.83, 3.23 ±
0.91, and 3.22 ± 0.89 L/min, respectively), and following
recovery from PEEP (4.98 ± 1.11, 4.88 ± 1.50, and 4.87 ±
1.03 L/min, respectively). When the 60 CO values (pre-PEEP,
PEEP, and post-PEEP) were included, confidence interval of
the difference was -1.5 to 1.9 for NICOM – PICCO TD, -1.9
to 1.9 for PICCO PC – PICCO TD, and -2.2 to 2.5 for NICOM
– PICCO PC. The 95% statistical power gives a mean CO dif-
ference threshold of 0.77, 0.29, and 0.52 L/min for NICOM vs.
PICCO TD, PICCO PC vs. PICCO TD and NICOM vs. PICCO
PC, respectively, corresponding approximately to 0.44, 0.16,
and 0.25 L/min/m
2
. Table 1 summarizes additional statistics
comparing PICCO-PC and NICOM with PICCO-TD during
the two stable hemodynamic periods (i.e., the baseline period
and the post-PEEP period). The different criteria of CO accu-
racy were comparable.
In all patients, the three technologies detected a decrease in
CO when PEEP was applied. CO was reduced by 33 ± 13%,
31 ± 15%, and 35 ± 13%, for NICOM, PICCO PC, and
PICCO TD, respectively (NS). The changes in CO noted
between different periods of the protocol were mainly due to
changes in SV with minimal changes in HR (see below). A
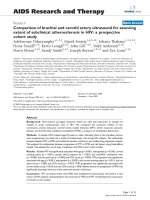
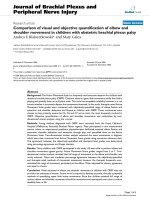
detailed accounting of the comparisons are shown in Figure 2
(comparing NICOM and PICCO PC with PICCO TD, with fur-
ther statistical details provided in the figure legend) and in the
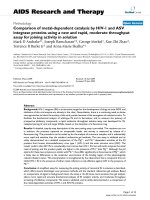
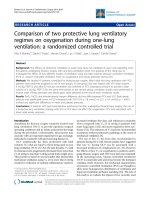
respective Bland-Altman graphs in Figure 3. As shown, the
bias was negligible and the limits of agreement to PICCO TD
were comparable for NICOM and PICCO PC, amounting to
about ± 2 L/min.
Precision of the NICOM and PICCO-PC CO were compara-
ble: 5.6 ± 2.9% and 6.1 ± 4.5% for NICOM and PICCO PC,
respectively. Time to minimum CO value following introduction
of PEEP (our measure of time responsiveness) was 2.6 ± 0.5
minute for PICCO PC and 3.2 ± 0.7 minute for NICOM (NS)
and a reduction of CO was detected by both methods within
one minute.
The cross correlations between PICCO PC and NICOM was
r = 0.62 ± 0.15 (extremes 0.22 to 0.86). In six patients it was
<0.5. In four of these six patients, the PEEP-induced CO
change was small (<20%).
SV were very close at baseline for NICOM, PICCO PC, and
PICCO TD: 53 ± 21, 50 ± 26, 49 ± 27 mL/beat, respectively
(NS). Precision of the devices to measure SV was identical to
that noted above for CO: 8 ± 7% and 9 ± 5% for NICOM and
PICCO PC SV, respectively. During PEEP, SV was reduced
similarly to CO in all patients and all technologies: 31 ± 13%,
31 ± 19%, 32 ± 17% for NICOM, PICCO PC, and PICCO
TD, respectively (NS). There was complete inter-technology
Figure 1
Typical original recordings of PICCO PC, PICCO TD and NICOM dur-ing the 30-minute study protocolTypical original recordings of PICCO PC, PICCO TD and NICOM dur-
ing the 30-minute study protocol. Recordings included the baseline
period (minutes 0 to 10), during positive end expiratory pressure
(PEEP; minutes 10 to 20), and following PEEP removal (minutes 20 to
30). CO = cardiac output.
Critical Care Vol 13 No 4 Squara et al.
Page 4 of 6
(page number not for citation purposes)
agreement in HR detection: 94 ± 29 vs. 95 ± 29 beats/min at
baseline (NS). HR increased in eight patients, was unchanged
in three patients, and decreased in nine patients. The average
change in HR was a small decline: 0.4 ± 11 vs. 1.1 ± 12
beats/min for NICOM and PICCO, respectively (NS).
Discussion
CO and SV are fundamental variables for assessing circula-
tory disorders and their response to therapeutic interventions.
The ability to continuously monitor these variables improves
our capabilities of tracking diseases and optimizing therapy.
Using a standardized intervention (i.e., PEEP challenge)
known to result in a rapid reversible reduction of CO [19,20],
we have demonstrated that PICCO PC and NICOM have
equivalent CO monitoring capabilities, including the ability to
detect directional changes in CO.
We used PICCO TD as the reference for comparisons of
absolute CO values and changes in CO detected by NICOM
and PICCO PC. Although transpulmonary TD provided by
PICCO TD has received significant interest [21], it is not
widely accepted as a reference technology for CO measure-
ment [22,23]. Nevertheless, this technique allowing periodic
recalibrations to increase the accuracy of the continuous mon-
Table 1
Inter technology agreements based on 20 values for each technology
NICOM vs. PICCO TD PICCO PC vs. PICCO TD NICOM vs. PICCO PC
Bias 0,26 0,04 0,22
R 0,76 0,77 0,55
RE 0,12 0,11 0,18
LOA 1,52 1,77 2,41
CV 0,31 0,38 0,49
C&C 0,93 0,93 0,80
Values of cardiac output obtained during positive end expiratory pressure were excluded from this analysis to minimize the impact of differences in
time responsiveness between the devices.
R = coefficient of determination for inter-technologies comparisons; RE = averaged value of relative error (absolute bias/mean); LOA = limits of
agreements of the Bland and Altman representation (two × standard deviations of the difference) in L/min; CV = coefficient of variation (two ×
standard deviation/mean); C&C = percentage of the differences inside the 30% limit of acceptability as suggested by Critchley and Critchley
[16].
Figure 2
Comparison of cardiac output measured by NICOM and PICCO PC in comparison of PICCO TDComparison of cardiac output measured by NICOM and PICCO PC in comparison of PICCO TD. The three different colours represent baseline,
positive end expiratory pressure (PEEP) application, and return to baseline. The regression lines did not differ significantly from the line of identity
(PICCO TD vs. NICOM: y = 1.2 + 0.77x, r = 0.77; PICCO TD vs. PICCO PC: y = -0.5 + 0.9x, r = 0.79).
Available online />Page 5 of 6
(page number not for citation purposes)
itoring is widely used and the results of the present study
therefore assessed performance of the NICOM relative to
PICCO TD, not necessary to a universally accepted gold
standard.
When compared with PICCO TD, the averaged bias and the
coefficient of variation of NICOM and PICCO PC were com-
parable. According to the criteria of Critchley and Critchley
[16], the bias was acceptable in 93% of the cases. Despite a
relatively small number of patients, this study was adequate to
show a practical equivalence in accuracy between the three
technologies. The threshold for a statistical power of 95% is
always less than 0.5 L/min/m
2
. The threshold between PICCO
PC and PICCO TD was necessarily the smallest because
PICCO PC was automatically recalibrated directly against
PICCO TD just prior to starting the protocol, then at baseline,
during PEEP, and after withdrawal of PEEP. In comparison,
the NICOM device is completely noninvasive, self-calibrating
and utilizes calibration factors determined in prior studies as
detailed previously [13].
As noted above, devices intended for continuous hemody-
namic monitoring are required not only to provide acceptable
estimates of CO and SV, but are also expected to manifest
appropriate precision and responsiveness during times of
changing hemodynamic performance. Good precision and
responsiveness are thus essential in order to quickly detect
any directional change and provide reliable and rapid indica-
tions of clinically meaningful changes that would require med-
ical intervention. Within the limits of the present study, it can
be concluded that NICOM and PICCO PC fulfill this criterion.
When discrete measurements are compared with a gold
standard giving the true value, precision, namely the variability
of measurements due to random error of measurement can be
assessed by the variability of bias. However, when comparing
monitoring tools when none of them can be considered as a
gold standard, precision is better estimated as the variability
around a stable trend line slope [6,8]. That is why we chose to
compare PICCO PC and NICOM precision during the base-
line period of our study.
Although restricted to a unique hemodynamic test, our study
employed a challenging intervention for any CO monitoring
system because it imposes sudden, relatively complex
changes in right and left ventricular afterloads and preloads
due to impact on venous return and extracardiac pressures.
When PEEP is applied, it results in a sudden decrease in CO
then a sudden increase when PEEP is removed. Despite these
opposite and challenging conditions, our results are consist-
ent with previous studies [8,11], so it is reasonable to gener-
alize the findings to other hemodynamic challenges. PICCO
PC technology is based on a peripheral PC analysis technol-
ogy, therefore in a theoretical aortic flow-impedance model
and in a transfer function deriving this proximal aortic flow-
impedance relation from a peripheral arterial wave signal.
NICOM technology is based on the relation between changes
in chest bioreactance and changes in aortic volume from
which SV is extrapolated [13]. A sudden increase in intra-tho-
racic pressure such as high PEEP application decreases the
aortic compliance and may change both the transfer function
of the PICCO PC and the SV/aortic volume relation of the
NICOM. In addition, very high pulmonary pressure may lead
the NICOM to overestimated the CO [8]. In this limited
number of patients, it does not appear that these changes may
have strong consequences on the CO accuracy.
Conclusions
Although occasional discordances may occur in CO values
assessed by transthoracic bioreactance and PC arterial wave
analysis, precision, time, and amplitude responsive, and the
Figure 3
Bland-Altman plots comparing NICOM and PICCO PC to PICCO TDBland-Altman plots comparing NICOM and PICCO PC to PICCO TD. The three different colours represent baseline, positive end expiratory pres-
sure application, and return to baseline. Mean bias and limits of agreements are given in Table 1. Mean bias and limits of agreements are 0.22 ±
1.67 L/min/m for NICOM and 0.01 ± 1.86 L/min/m for PICCO PC.
Critical Care Vol 13 No 4 Squara et al.
Page 6 of 6
(page number not for citation purposes)
ability to detect significant CO changes were equivalent and
acceptable for both technologies. Because NICOM is totally
noninvasive, it can markedly expand the number of patients in
which accurate continuous CO monitoring is possible.
Competing interests
PS is a consultant for Cheetah med. All other authors declare
that they have no competing interests.
Authors' contributions
PS, AB, and PE designed the study. DR and DD collected the
data. PS made the statistical analysis and wrote the draft of
the manuscript. All authors finalized and approved the
manuscript.
Acknowledgements
We thank Steve Novak for outstanding assistance in collecting data.
This study was funded by Pulsion Medical Systems who loaned the
PICCO+ system and Cheetah Medical who loaned the NICOM system.
These companies made no other contribution.
References
1. Swan HJ, Ganz W, Forrester J, Marcus H, Diamond G, Chonette
D: Catheterization of the heart in man with used of a flow
directed balloon-tipped catheter. N Engl J Med 1970,
283:447-451.
2. Ganz W, Donoso R, Marcus H, Forrester J, Swan H: A new tech-
nique for measurement of cardiac output by thermodilution in
man. Am J Cardiol 1971, 27:392-396.
3. Biais M, Nouette-Gaulain K, Cottenceau V, Revel P, Sztark F:
Uncalibrated pulse contour-derived stroke volume variation
predicts fluid responsiveness in mechanically ventilated
patients undergoing liver transplantation. Br J Anaesth 2008,
101:761-768.
4. Lamia B, Ochagavia A, Monnet X, Chemla D, Richard C, Teboul JL:
Echocardiographic prediction of volume responsiveness in
critically ill patients with spontaneously breathing activity.
Intensive Care Med 2007, 33:1125-1132.
5. Hofer C, Senn A, Weibel L, Zollinger A: Assessment of stroke
volume variation for prediction of fluid responsiveness using
the modified FloTrac and PiCCO plus system. Crit Care 2008,
12:R82.
6. Squara P, Cecconi C, Singer M, Rhodes A, Chiche J: Tracking
changes in cardiac output; Methodological considerations for
the validation of monitoring devices. Intensive Care Med 2009
in press.
7. Cecconi M, Rhodes A, Poloniecki J, Della Rocca G, Grounds R:
Bench-to-bedside review: The importance of the precision of
the reference technique in method comparison studies – with
specific reference to the measurement of cardiac output. Crit
Care 2009, 13:201.
8. Squara P, Denjean D, Estagnasie P, Brusset A, Dib JC, Dubois C:
Noninvasive cardiac output monitoring (NICOM): a clinical
validation. Intensive Care Med 2007, 33:1191-1194.
9. Keren H, Burkhoff D, Squara P: Evaluation of a noninvasive con-
tinuous cardiac output monitoring system based on thoracic
bioreactance. Am J Physiol Heart Circ Physiol 2007,
293:H583-589.
10. Raval N, Squara P, Cleman M, Yalamanchili K, Winklmaier M, Bur-
khoff D: Multicenter evaluation of noninvasive cardiac output
measurement by bioreactance technique. J Clin Monit Comput
2008, 22:113-119.
11. Marqué S, Cariou A, Chiche J, Squara P: Non Invasive Cardiac
Output Monitoring (NICOM) Compared to Minimally Invasive
Monitoring (VIGILEO).
Crit Care 2009, 13:R73.
12. de Wilde R, Breukers R, Berg P van den, Jansen J: Monitoring car-
diac output using the femoral and radial arterial pressure
waveform. Anaesthesia 2006, 61:743-746.
13. Squara P: Bioreactance, A new method for non invasive car-
diac output monitoring. In Year book of Intensive Care And
Emergency Medicine Edited by: Vincent J. Paris: Springer;
2008:619-630.
14. Claxton B, Morgan P, McKeague H, Mulpur A, Berridge J: Alveolar
recruitment strategy improves arterial oxygenation after cardi-
opulmonary bypass. Anaesthesia 2003, 58:111-116.
15. Bland JM, Altman DG: Statistical methods for assessing agree-
ment between two methods of clinical measurement. Lancet
1986, 1:307-310.
16. Critchley LA, Critchley JA: A meta-analysis of studies using bias
and precision statistics to compare cardiac output measure-
ment techniques. J Clin Monit Comput 1999, 15:85-91.
17. Altman D, Bland J: Absence of evidence is not evidence of
absence. Aust Vet J 1996, 74:311.
18. Sagan C: The Demon-Haunted World: Science as a Candle in
the Dark. New York: Random House Publishing Group; 1995.
19. Henning R: Effects of positive end-expiratory pressure on the
right ventricle. J Appl Physiol 1986, 61:819-826.
20. Lim S, Adams A, Simonson D, Dries D, Broccard A, Hotchkiss J,
Marini J: Transient hemodynamic effects of recruitment
maneuvers in three experimental models of acute lung injury.
Crit Care Med 2004, 32:2378-2384.
21. Della Rocca G, Costa MG, Coccia C, Pompei L, Di Marco P,
Vilardi V, Pietropaoli P: Cardiac output monitoring: aortic
transpulmonary thermodilution and pulse contour analysis
agree with standard thermodilution methods in patients
undergoing lung transplantation. Can J Anaesth 2003,
50:707-711.
22. Combes A, Berneau JB, Luyt CE, Trouillet JL: Estimation of left
ventricular systolic function by single transpulmonary
thermodilution. Intensive Care Med 2004, 30:1377-1383.
23. Hüter L, Schwarzkopf K, Preussler N, Schubert H, Schreiber T:
The level of cardiac output affects the relationship and agree-
ment between pulmonary artery and transpulmonary aortic
thermodilution measurements in an animal model. J Cardiot-
horac Vasc Anesth 2007, 21:659-663.
Key messages
• Chest bioreactance is equivalent to PICCO PC in terms
of precision, time, and amplitude response.
• The threshold for bias equivalence in this study was
0.52 L/min.