Báo cáo y học: "Optimal nutrition during the period of mechanical ventilation decreases mortality in critically ill, long-term acute female patients: a prospective observational cohort study" pptx
Bạn đang xem bản rút gọn của tài liệu. Xem và tải ngay bản đầy đủ của tài liệu tại đây (162.2 KB, 11 trang )
Available online />
Research
Vol 13 No 4
Open Access
Optimal nutrition during the period of mechanical ventilation
decreases mortality in critically ill, long-term acute female
patients: a prospective observational cohort study
Rob JM Strack van Schijndel1, Peter JM Weijs2, Rixt H Koopmans1, Hans P Sauerwein3,
Albertus Beishuizen1 and Armand RJ Girbes1
1Department
of Intensive Care Medicine, VU University Medical Centre, PO Box 7057, 1007 MB Amsterdam, the Netherlands
of Nutrition and Dietetics, VU University Medical Centre, PO Box 7057, 1007 MB Amsterdam, the Netherlands
3Palmgracht 44 B, 1015 HN Amsterdam, the Netherlands
2Department
Corresponding author: Peter JM Weijs,
Received: 16 Mar 2009 Revisions requested: 27 Apr 2009 Revisions received: 9 Jul 2009 Accepted: 11 Aug 2009 Published: 11 Aug 2009
Critical Care 2009, 13:R132 (doi:10.1186/cc7993)
This article is online at: />© 2009 Strack van Schijndel et al.; licensee BioMed Central Ltd.
This is an open access article distributed under the terms of the Creative Commons Attribution License ( />which permits unrestricted use, distribution, and reproduction in any medium, provided the original work is properly cited.
Abstract
Introduction Optimal nutrition for intensive care patients has
been proposed to be the provision of energy as determined by
indirect calorimetry, and protein provision of at least 1.2 g/kg
pre-admission weight per day. The evidence supporting these
nutritional goals is based on surrogate outcomes and is not yet
substantiated by patient oriented, clinically meaningful
endpoints. In the present study we evaluated the effects of
achieving optimal nutrition in ICU patients during their period of
mechanical ventilation on mortality.
Methods This was a prospective observational cohort study in
a mixed medical-surgical, 28-bed ICU in an academic hospital.
243 sequential mixed medical-surgical patients were enrolled
on day 3–5 after admission if they had an expected stay of at
least another 5–7 days. They underwent indirect calorimetry as
part of routine care. Nutrition was guided by the result of indirect
calorimetry and we aimed to provide at least 1.2 g of protein/kg/
day. Cumulative balances were calculated for the period of
mechanical ventilation. Outcome parameters were ICU, 28-day
and hospital mortality.
Introduction
Nutrition is an integral and important part of therapy in the ICU.
Nutritional therapy aims at conservation or restoration of the
body protein mass and of provision of adequate amounts of
energy. On a hypothetical basis, surrogate markers for optimal
nutrition with regard to energy and protein provision have proposed to be the delivery of energy as measured by indirect
calorimetry, and provision of 1.2 to 1.5 g of protein per kg of
Results In women, when corrected for weight, height, Apache II
score, diagnosis category, and hyperglycaemic index, patients
who reached their nutritional goals compared to those who did
not, showed a hazard ratio (HR) of 0.199 for ICU mortality (CI
0.048–0.831; P = 0.027), a HR of 0.079 for 28 day mortality
(CI 0.013–0.467; P = 0.005) and a HR of 0.328 for hospital
mortality (CI 0.113–0.952; P = 0.04). Achievement of energy
goals whilst not reaching protein goals, did not affect ICU
mortality; the HR for 28 day mortality was 0.120 (CI 0.027–
0.528; P = 0.005) and 0.318 for hospital mortality (CI 0.107–
0.945; P = 0.039). No difference in outcome related to optimal
feeding was found for men.
Conclusions Optimal nutritional therapy improves ICU, 28-day
and hospital survival in female ICU patients. Female patients
reaching both energy and protein goals have better outcomes
than those reaching only the energy goal. In the present study
men did not benefit from optimal nutrition.
pre-admission weight for critically ill patients [1]. It has been
shown that inadequate provision of energy correlates with the
occurrence of complications, such as adult respiratory distress syndrome, infections, renal failure, pressure sores and
need for surgery [2,3]. Recently, Anbar and colleagues [4]
have provided preliminary evidence in a group of 50 patients
with an expected ICU stay of more than three days, that provision of energy according to indirect calorimetry led to
AARC: American Association for Respiratory Care; APACHE: acute physiology and chronic health evaluation; CI: confidence interval; HGI: hyperglycemic index; HR: hazard ratio; LOS: length of stay; LOV: length of ventilation; REE: resting energy expenditure; TEE: total energy expenditure.
Page 1 of 11
(page number not for citation purposes)
Critical Care
Vol 13 No 4
Strack van Schijndel et al.
cumulative positive energy balances whereas the control
group (targeted at 25 kcal/kg) had negative cumulative energy
balances; hospital morbidity and hospital mortality decreased
in the intervention group.
for activity originates from a study by van Lanschot and colleagues [10] where 24 hour indirect calorimetric measurements were performed to determine total energy expenditure
(TEE).
Studies aimed at improving nutritional support by implementing evidence-based algorithms have failed to demonstrate significant positive effects on survival, but the nutritional goals as
proposed for the surrogate markers for optimal nutrition were
not achieved [5-7]. The lack of findings of clinically relevant
effects of nutritional therapy in earlier studies might thus be
explained by not attaining adequate provision of energy and
protein.
Thus, the energy target is determined by the Harris-Benedict
1984 equation plus 30%, until indirect calorimetry is performed [11]. Indirect calorimetric measurements are performed as part of routine care, usually between day three and
five after admission, according to the AARC guidelines [8].
In the present study we analyze the effects of reaching energy
provision guided by indirect calorimetry and provision of at
least 1.2 g/kg pre-admission body weight. We sought for an
effect of optimal nutrition on mortality as outcome parameter.
Materials and methods
The study was prospectively undertaken in a group of mixed
medical-surgical patients in a tertiary university hospital.
According to the American Association for Respiratory Care
(AARC) guidelines [8], we selected patients who require longterm acute care, patients with a known or suspected nutritional
deficit, and subgroups with a nutritional and stress factors that
may considerably skew prediction by Harris-Benedict equation. The long-term acute care patients were included if on
days three to five (timing of indirect calorimetry) the foreseeable period of artificial nutrition was another five to seven days
at least; if age was over 18 years and if it was a first admission
to the ICU during the hospital stay. Limiting factors for inclusion were: fraction of inspired oxygen of more than 0.6, air
leaks through cuffs and or chest drains, limited availability due
to usage of the metabolic monitor or of the two intensivists
who performed the measurements, service/repair of defects of
the only metabolic monitor available, and withdrawal of treatment because of poor prognosis.
The study was approved by the ethics committee of the VU
University Medical Center. The need for informed consent was
waived because no additional procedures apart from usual
intensive care practice were involved and the data used in this
study needed to be collected for clinical purposes. The Dutch
legislation does not require informed consent for such clinical
protocol-based treatment and data collection, provided that
the results are anonymous.
Our nutritional protocol is aimed at early enteral feeding, starting within 24 hours after admission [see Additional data file 1].
The choice for calculating resting energy expenditure (REE) as
Harris-Benedict times 1.2 originates from the recommendation by Alexander and colleagues [9] where actual REE are
compared with formulas used in the ICU. Also the AARC
guidelines uses the Harris-Benedict equation. The 10% extra
Page 2 of 11
(page number not for citation purposes)
After the measurement, the caloric goal was set at the measured REE plus 10% for activity, and nutrition was adjusted to
meet the new caloric goal. Repeated measurements were performed when clinically indicated, according to the AARC
guidelines. Caloric provision was tailored towards the latest
calorimetric measurement. Protein was provided with a target
of 1.2 to 1.5 g/kg pre-admission body weight. According to
Dutch guidelines on protein provision, patients with a BMI of
more than 30 kg/m2 are corrected for overweight to calculate
their protein need; a BMI of 27.5 kg/m2 was used to compute
the corresponding weight and required amount of protein/kg/
day [12].
To achieve both energy and protein goals we used an algorithm for enteral nutrition that determines the nutritional formula and amount to be given to meet both requirements [13].
The enteral nutritional formulas used are: Nutrison standard®
(1000 kcal and 40 g of protein per 1000 ml); Nutrison protein
plus® (1250 kcal and 63 g of protein per 1000 ml; both from
Numico, Zoetermeer, The Netherlands); and Promote® (1000
kcal and 63 g of protein per 1000 ml; from Abbott Nutrition,
Hoofddorp, The Netherlands). Parenteral nutrition during the
study period was initially provided by our pharmacy as an allin-one solution containing 1000 kcal and 47 g of protein per
litre, and later a commercially available product was used
(Struktokabiven, Fresenius-Kabi A.G., Bad Homburg v.d. H,
Germany) containing 1050 kcal and 50 g of protein per litre.
Data from indirect calorimetric measurements have been
entered in our data-management system (Metavision®, IMDsoft, Tel-Aviv, Israel) since August 2004 and inclusion started
from this date. Data retrieval was performed in March 2006.
The REE was measured with a calorimeter (Deltatrac™ MBM100 Metabolic Monitor, Datex-Engstrom Division, Instrumentation Corp. Helsinki, Finland) connected to the ventilator in
mechanically ventilated patients. Measurements were performed over a period of 1 to 1.5 hours in resting conditions,
after calibration of the device.
For every patient age (years), gender, weight (kg) and height
(cm), BMI (kg/m2), acute physiology and chronic health evaluation (APACHE) II score, diagnosis group, length of stay in the
ICU (ICU-LOS), length of ventilation (LOV), estimated TEE
(Harris-Benedict 1984 plus 30%), measured REE from which
Available online />
the TEE was calculated as REE plus 10%, daily energy and
protein intake from all sources but oral intake during the period
of mechanical ventilation and all blood glucose values during
the ICU admission period were recorded. Data for ICU-LOS
and data on mortality that could not be extracted from the local
ICU database were retrieved from the hospital information system. For every individual patient the probability of death was
calculated from the APACHE score, from which the Standardized Mortality Ratio for groups was calculated [14].
For weight and height of the patients we used pre-admission
data, retrieved from the pre-assessment outpatient clinic, from
earlier measurements taken during admission or from data
obtained in other health care settings. Otherwise, the relatives
or if possible the patient was asked to provide these data. If
these data could not be retrieved, weight was estimated and
height was either measured or estimated by one of the two
experienced intensivists who performed the indirect calorimetric measurements.
Nutritional data and calculations
The energy target was set at 90% of the TEE value. Until indirect calorimetry was performed, the daily energy target was
calculated with the Harris-Benedict 1984 equation plus 30%.
From the day that calorimetric data were available, TEE was
defined as measured REE plus 10%, which was then used as
energy target. If indirect calorimetry was performed more than
once, the new TEE value was used to define the TEE from the
moment of measurement. The protein target was defined as
1.2 to 1.5 g of protein/kg pre-admission bodyweight/day. In
case of obesity, weight was corrected to a BMI of 27.5 kg/m2.
Data on caloric and protein intake from artificial nutrition are
routinely recorded in our patient data-management system. As
our mechanically ventilated patients are fed with artificial nutrition, and oral intake is stimulated after extubation, we used the
LOV period for our calculations of energy and protein balances. Energy balance was calculated as energy intake minus
energy target, on a daily basis. The protein balance was calculated as total daily intake of protein minus 1.2 g times preadmission body weight in kg. From the daily energy and protein balances a cumulative balance was calculated for the LOV
period and compared with the target values for the entire
period of mechanical ventilation. In this way patients could be
categorized into four groups according to whether energy and
protein goals were reached or not reached.
Determination of adequacy of the glycemic control was performed by calculation of the hyperglycemic index (HGI) in
mmol/L per patient during the entire ICU period. The average
number of glucose samples per patient in our unit is 6.2 per
day. The HGI is defined as the area under the curve above the
upper limit of normal (glucose level 6.0 mmol/l) divided by the
total ICU-LOS [15].
The outcome variables were death from any cause in the ICU,
28-day mortality and hospital mortality.
Statistical analysis
Descriptive data are reported as mean and standard deviation,
median and range, or as frequency and percentage.
Cox regression analysis with the hospital LOS as time variable,
ICU, 28-day and hospital mortality as outcome variables and
nutritional goal achieved (yes/no), energy goal achieved (yes/
no), and protein goal achieved (yes/no) as independent variables. As gender was found to be a significant effect modifier,
data were analysed for males and females separately. All presented hazard ratios (HR) were corrected for weight, height,
APACHE II score, diagnosis category, and HGI. SPSS 14
(SPSS Inc., Chicago, IL, USA) was used for statistical analysis. A P < 0.05 was considered statistically significant.
Results
Two hundred and forty-three sequential patients fulfilled the
inclusion criteria. Of these, 184 patients were fed exclusively
with enteral nutrition, four patients were exclusively fed with
parenteral nutrition and 55 patients received enteral and
parenteral nutrition during the period of mechanical ventilation.
The Harris-Benedict formula prior to the indirect calorimetric
measurement underestimated in 13.2% by less than 10%,
70.4% of the estimations was within +/- 10% and in 16.5%
overestimated by more than 10%; a bias of +0.9% makes the
prediction acceptable for a group. However, the prediction
can strongly deviate from the indirect calorimetric value for
individual patients with a maximal negative error of 23.8% and
maximal positive error of 38.8%. The median period between
admission and indirect calorimetry was six days.
According to achievement of the cumulative nutritional goals
the patients were placed into one of four groups. Demographic, clinical and nutritional data are presented in Table 1
and Table 2 for males and females separately. Females
reached nutritional goals more often than men (34/102;
33.3% vs 25/141; 17.7%).
The results of the statistical analysis are presented in Table 3.
Cox regression analysis showed no significant effects of
attaining nutritional goals on mortality in men.
For the female part of the population, the HRs for ICU, 28-day
and hospital mortality were significantly lower for the group
that reached both energy and protein goals compared with the
group that did not reach both goals. The strongest effects
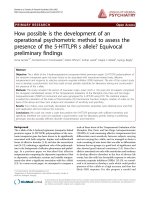
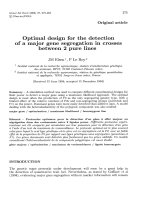
were seen on 28-day mortality (HR = 0.079; confidence interval (CI) = 0.013 to 0.467; P = 0.005). The effects of reaching
both energy and protein goals are more obvious than when
only the energy target is reached (Figure 1). In the latter case,
the HR for ICU mortality did not reach significance. The HRs
Page 3 of 11
(page number not for citation purposes)
Critical Care
Vol 13 No 4
Strack van Schijndel et al.
Table 1
Patients' characteristics by nutritional group (male patients)
E-/P-1
(n = 82)
E+/P-2
(n = 29)
E-/P+3
(n = 5)
E+/P+4
(n = 25)
Total
(n = 141)
Mean (SD)
61.67 (15.63)
62.10 (20.30)
55 (14)
62.28 (19.84)
61.63 (17.28)
Median (range)
65 (24–84)
69 (19–91)
46 (44–74)
65 (20–87)
65 (19–91)
Mean (SD)
178.32 (6.15)
177.38 (7.02)
174.8 (8.30)
175.68 (11.92)
177.53 (7.70)
Median (range)
180 (165–192)
180 (160–190)
176 (165–185)
175 (155–203)
178 (155–203)
Mean (SD)
83.46 (14.74)
72.16 (16.30)
84.8 (38.35)
72.16 (16.30)
80.58 (15.97)
Median(range)
80 (54–130)
70 (45–110)
75 (47–130)
70 (45–110)
80 (45–130)
Mean (SD)
26.20 (4.15)
25.07 (2.91)
27.92(13.44)
23.6 (6.38)
25.57 (5.00)
Median(range)
26.1 (17.8–40.1)
24.7 (18.5–34)
23.1 (15.2–47.8)
23.1(15.5–45.8)
24.9 (15.2–47.8)
Age (years)
Height (cm)
Weight (kg)
BMI (kg/m2)
APACHE
II
Mean (SD)
21.87 (8.64)
21.14 (6.85)
16.2 (12.07)
20.04 (6.51)
21.19 (8.09)
Median(range)
20.5 (4–46)
20 (11–38)
11 (5–32)
19 (8–36)
20 (4–46)
Mean (SD)
1.331 (0.55)
1.097 (0.55)
1.32 (0.78)
1.076 (0.56)
1.237 (0.57)
Median (range)
1.26 (0.35–2.85)
1.04 (0.30–2.55)
1.10 (0.71–2.66)
0.94 (0.43–2.82)
1.18 (0.30–2.85)
Mean (SD)
20.65 (23.54)
24 (20.11)
38.4 (45.20)
20.64 (12.86)
21.96 (22.36)
Median (range)
15 (2–181)
18 (4–83)
18 (14–119)
19 (2–48)
16 (2–181)
Mean (SD)
24.33 (27.65)
26.9 (21.25)
41.6 (46.96)
23.84 (14.74)
25.31 (25.37)
Median (range)
17 (3–209)
21 (4–83)
20 (15–125)
21 (5–64)
19 (3–209)
Mean (SD)
42.15 (32.83)
46.66 (29.23)
103.6 (111.83)
42.72 (26.32)
45.35 (37.41)
Median (range)
33 (4–210)
41 (6–126)
43 (31–297)
40 (6–95)
36 (4–297)
Mean (SD)
1627 (368.47)
1883 (341.75)
1936 (518.85)
1853 (446.25)
1730 (398.85)
Median
1624
1957
1994
1894
1771
Range
558–2620
1284–2543
1267–2545
734–2633
558–2633
HGI (mmol/L)5
LOV6
LOS ICU7
LOS hospital8
Energy intake (kcal/day)
Page 4 of 11
(page number not for citation purposes)
Available online />
Table 1 (Continued)
Patients' characteristics by nutritional group (male patients)
Energy cumulative end balance (kcal)
Mean
-9149.71
-2177.69
-22967
2336.52
-6169.16
SD
7946.35
4447.88
36552.77
5700.77
10758.06
Median
-6637.5
-1270
-8408
86
-4407
Range
-44504 -733
-15615 +3649
-88277 -4597
-4423 +20989
-88277 +20989
Mean (SD)
66.33 (18.74)
82.05 (12.2)
91.84 (28.49)
93.83 (17.03)
75.34 (20.82)
Median (range)
69.48 (12–100)
83.91 (57–111)
100.89 (58–123)
91.75 (66–131)
74.73 (12–131)
Protein intake (g/day)
% days energy goal not reached
Mean (SD)
55.29 (22.64)
19.05 (13.53)
53.38 (19.81)
15.74 (11.19)
40.76 (26.54)
Median(range)
51.19 (18–100)
17.31 (0–61)
52.94 (29–83)
12.50 (0–50)
35.14 (0–100)
% days protein goal not reached
Mean (SD)
74.71 (21.06)
59.56 (23.77)
40.39 (34.04)
20.09 (12.45)
60.69 (29.22)
Median(range)
73.70 (33–100)
50.00 (22–100)
27.78 (18–100)
20.00 (0–50)
61.54 (0–100)
Trauma
7.3%
6.9%
20%
20%
10%
Sepsis
15.9%
17.2%
-
16%
15.6%
Resp. Insuff
19.5%
27.6%
20%
40%
24.8%
Post-surgical
36.6%
37.9%
60%
20%
34.8%
Neurological
8.5%
10.3%
-
4%
7.8%
Post-resuscit
12.2%
-
-
-
7.1%
Total
100%
100%
100%
100%
100%
ICU
15.9%
17.2%
20%
24%
17.7%
28-day
17.1%
13.8%
0%
24%
17%
Hosp
30.5%
27.6%
40%
36%
31%
0.39
0.47
0.80
0.80
0.47
Admission diagnosis (%)
Mortality (%)
SMR9
1E-/P- = energy and protein targets not reached
2E+/P- = energy target reached and protein target not reached
3E-/P+ = energy target not reached and protein target reached
4E+/P+ = energy and protein targets reached
5HGI = hyperglycemic index, see methods
6LOV = length of ventilation
7LOS ICU = length of stay at intensive care unit
8LOS hospital = length of stay in hospital
9SMR = standardized mortality rate; observed mortality/predicted
mortality
APACHE = acute physiology and chronic health evaluation; SD = standard deviation.
Page 5 of 11
(page number not for citation purposes)
Critical Care
Vol 13 No 4
Strack van Schijndel et al.
Table 2
Patients' characteristics by nutritional group (female patients)
E-/P-1
(n = 32)
E+/P-2
(n = 35)
E-/P+3
(n = 1)
E+/P+4
(n = 34)
Total
(n = 102)
Mean (SD)
62.59 (21.90)
67.54 (12.86)
78 (-)
63.47 (16.26)
64.74 (17.20)
Median (range)
72.5 (19–88)
71 (26–84)
78
68 (20–86)
70 (19–88)
Mean (SD)
169 (6.89)
164.8 (6.60)
173 (-)
163.24 (5.73)
165.68 (6.80)
Median (range)
170 (152–180)
165(152–178)
173
163.5 (150–175)
165 (150–180)
Mean (SD)
68.75 (12.88)
68.8 (13.81)
58 (-)
59.47 (9.68)
65.57 (12.87)
Median(range)
67.5 (36–101)
65 (50–112)
58
59.5 (40–78)
65 (36–112)
Mean (SD)
24.08 (4.31)
25.34 (4.85)
19.4(-)
22.28 (3.14)
23.87 (4.32)
Median(range)
23.45(12.5–34.6)
24.7 (17.3–39.7)
19.4
22.25(15.6–30.1)
23.55 (12.5–39.7)
Age (years)
Height (cm)
Weight (kg)
BMI (kg/m2)
APACHE
II
Mean (SD)
19.62 (7.17)
21.31 (7.43)
20 (-)
21.56 (7.32)
20.85 (7.25)
Median(range)
18.5 (7–36)
18 (8–35)
20
21 (9–46)
20 (7–46)
Mean (SD)
1.014 (0.44)
1.259 (0.51)
1.48 (-)
1.048 (0.41)
1.115 (0.46)
Median (range)
0.95 (0.38–2.51)
1.15 (0.55–2.54)
1.48
1.02 (0.45–2.12)
1.07 (0.38–2.54)
Mean (SD)
13.66 (10.66)
28.66 (20.43)
11 (-)
28.82 (21.70)
23.83 (19.50)
Median (range)
12 (3–59)
22 (7–91)
11
22 (3–102)
18 (3–102)
Mean (SD)
15.81 (10.72)
31.31 (20.50)
17 (-)
31.44 (22.72)
26.35 (19.97)
Median (range)
14.5 (3–59)
24 (9–91)
17
25 (4–110)
21 (3–110)
Mean (SD)
37.47 (34.38)
50.83 (36.49)
43 (-)
55.38 (34.70)
48.08 (35.51)
Median (range)
26 (4–176)
43 (10–181)
43
51 (9–162)
40 (4–181)
Mean (SD)
1364 (355.04)
1624 (227.02)
1673 (-)
1603 (269.83)
1536 (298.96)
Median
1413
1601
1673
1592
1547
Range
65–1992
1170–2046
HGI (mmol/L)5
LOV6
LOS ICU7
LOS hospital8
Energy intake (kcal/day)
Page 6 of 11
(page number not for citation purposes)
818–209265-2092
Available online />
Table 2 (Continued)
Patients' characteristics by nutritional group (female patients)
Energy cumulative end balance (kcal)
Mean
-5467.66
-1335.34
-3955
2765.82
-1290.38
SD
3909.27
3189.68
(-)
5349.70
348.33
Median
-5049
-813
-3955
1549
-1212.5
Range
-20533 -836
-10630 +3390
-6057 +18354
-20533 +18354
Mean (SD)
53.79 (18.92)
65.97 (16.33)
75.36 (-)
80.34 (11.83)
67.03 (19.02)
Median (range)
55.82 (0–89)
69.52 (4–84)
75.36
79.79 (56–100)
69.55 (0–100)
Protein intake (g/day)
% days energy goal not reached
Mean (SD)
58.85 (21.61)
21.77 (8.66)
45.45 (-)
17.00 (11.50)
32.05 (23.54)
Median(range)
58.57 (29–100)
21.43 (7–44)
45.45 (45–45)
16.67 (0–44)
25.41 (0–100)
% days protein goal not reached
Mean (SD)
72.42 (25.77)
63.83 (29.05)
45.45 (-)
20.96 (11.60)
52.06 (32.20)
Median(range)
78.18 (22–100)
64.71 (14–100)
45.45 (45–45)
17.31 (0–50)
45.45 (0–100
Admission diagnosis (%)
Trauma
9.4%
5.7%
-
2.9%
5.9%
Sepsis
15.6%
8.6%
-
11.8%
11.8%
Resp. Insuff
25.0%
34.3%
-
41.2%
33.3%
Post-surgical
31.2%
34.3%
-
23.5%
29.4%
Neurological
9.4%
8.6%
100%
14.7%
11.8%
Post-resuscit
9.4%
8.6%
-
5.9%
7.8%
Total
100%
100%
100%
100%
100%
ICU
25%
25.7%
0%
11.8%
20.6%
28-day
28.1%
17.6%
0.%
5.9%
16.7%
Hosp
31.2%
34.3%
0%
26.5%
30.4%
0.74
0.74
-
0.31
0.58
Mortality (%)
SMR
1E-/P- = energy and protein targets not reached
2E+/P- = energy target reached and protein target not reached
3E-/P+ = energy target not reached and protein target reached
4E+/P+ = energy and protein targets reached
5HGI = hyperglycemic index, see methods
6LOV = length of ventilation
7LOS ICU = length of stay at intensive care unit
8LOS hospital = length of stay in hospital
9SMR = standardized mortality rate; observed mortality/predicted
mortality
APACHE = acute physiology and chronic health evaluation; SD = standard deviation.
Page 7 of 11
(page number not for citation purposes)
Critical Care
Vol 13 No 4
Strack van Schijndel et al.
Table 3
Hazard ratios, confidence intervals and P values for mortality in the female part of the population between groups according to
different combinations of energy and protein goals reached.
ICU mortality
28 day mortality
Hospital mortality
E+/P+ versus E-/P-a
(n = 25 vs 82)
1.602; 0.464–5.524; P = 0.456
1.060; 0.320–3.514; P = 0.924
1.106; 0.413–2.961; P = 0.841
E+/P- versus E-/P-b
(n = 29 vs 82)
1.161; 0.402–3.355; P = 0.783
0.721; 0.233–2.231; P = 0.570
0.838; 0.367–1.916; P = 0.676
P+/(E+,E-) versus P-/(E+,E-)c
(n = 30 vs 111)
1.095; 0.384–3.116; P = 0.866
0.821; 0.273–2.469; P = 0.726
0.939; 0.399–2.213; P = 0.886
E+/(P+,P-) versus E-/(P+,P-)d
(n = 54 vs 87)
1.146; 0.478–2.750; P = 0.760
0.966; 0.402–2.320; P = 0.938
1.017; 0.519–1.992; P = 0.960
E+/P+ versus E-/P(n = 34 vs 32)
0.199; 0.048–0.831; P = 0.027
0.079; 0.013–0.467; P = 0.005
0.328; 0.113–0.952; P = 0.04
E+/P- versus E-/P(n = 35 vs 32)
0.341; 0.102–1.141; P = 0.081
0.120; 0.027–0.528; P = 0.005
0.318;0.107–0.945; P = 0.039
P+/(E+,E-) versus P-/(E+,E-)
(n = 35 vs 67)
0.295; 0.090–0.964; P = 0.043
0.176; 0.037–0.838; P = 0.029
0.405; 0.168–0.977; P = 0.044
E+/(P+,P-) versus E-/(P+,P-)
(n = 69 vs 33)
0.332; 0.116–0.949; P = 0.040
0.137; 0.041–0.461; P = 0.001
0.351; 0.145–0.847; P = 0.020
Males
Females
a E+/P+ versus E-/P- = both cumulative energy and protein goal reached versus both energy and protein goal not reached
b E+/P- versus E-/P- = cumulative energy goal reached versus energy goal not reached, for both groups protein goal not reached
c P+/(E+,E-) versus P-/(E+,E-) = cumulative protein goal reached versus protein goal not reached, irrespective of attaining energy
d E+/(P+,P-) versus E-/(P+,P-) = cumulative energy goal reached versus energy goal not reached, irrespective of attaining protein
for hospital mortality, however, are equivalent between these
two groups.
Table 3 also shows the results for comparison of the groups
that reached the protein goal or not, irrespective of the energy
goal, and results of reaching the energy goal or not, irrespective of the protein goal. Analysis of the Standardized Mortality
Ratio per nutritional goals group and per gender showed a low
predicted/observed mortality for women who reached both
the energy and protein goal, but for men this effect was
absent.
Discussion
Reaching nutritional goals, in this study defined as energy
delivery with a minimum of 90% of the measured REE plus
10% and protein provision of at least 1.2 g/kg pre-admission
Figure 1
Hazard ratios for women according to energy goal reached and protein goal reached or not
not.
Page 8 of 11
(page number not for citation purposes)
goal
goal
Available online />
body weight during the period of mechanical ventilation,
results in an 80% decreased chance of dying in the ICU and
a 92% decreased 28-day mortality, while hospital mortality is
67% lower when compared with patients who do not reach
the above mentioned nutritional goals. These effects only
occur in the female part of the ICU population. In men, no statistically significant effects of nutrition on outcome could be
detected.
have, the effects of nutrition will be more obvious. This is in line
with our findings. The beneficial effects of optimal nutrition are
also reflected by the low standardized mortality ratio in females
who reach their nutritional goals, while this effect is not seen
in the male group which can be expected because in the statistical analysis no effect of optimal nutrition could be demonstrated. The standardized mortality ratio rests on an accurate
APACHE score, which can be subject to errors [18]
Reaching only the energy target and not attaining 1.2 g protein/day in females results in less favorable outcomes than
when both energy and protein goals are reached. The chance
of dying in the ICU is not affected by reaching only the energy
target but there is still a decreased chance of dying of 88% at
28 days and a 68% decrease of hospital mortality.
How can we explain that others have not found effects of nutrition on mortality and why has female gender not been recognized as an important factor? Our study included a relatively
large number of patients, of whom 42% (n = 102) were
women. We used the Harris-Benedict equation until indirect
calorimetry was performed and used the measured energy
expenditure as target for energy provision thereafter: adequacy of energy and protein provision was strictly defined and
the entire period of ventilation was taken as the study period.
Furthermore, we calculated a HGI for every patient to assess
glycemic control. In the studies by Villet and colleagues [2]
and Dvir and colleagues [3] the relative small number of
patients (48 and 50, respectively) and the predominance of
males in both studies (30 and 33, respectively) may have
blurred the effects of gender differences. Both studies were
looking for the negative effects of energy deficits during ICU
stay, and did not focus on the effects of adequate nutrition in
terms of both energy and protein delivery. In the study by Villet
and colleagues the energy target was set at measured REE
plus 30% (69% of patients underwent indirect calorimetry) or
calculated as 30 kcal/kg/day. Dvir and colleagues performed
daily indirect calorimetric measurements, and used the measured REE as target for the caloric intake. No data on protein
provision or glycemic control are given for both studies. In a
study by Barr and colleagues, the outcome parameter for adequacy of nutritional support was energy provision on day four
of nutritional support. Caloric target estimates were determined by using the Harris-Benedict equation. Remarkably, the
percentage of the targeted caloric provision on day four
decreased from 73% in the preimplementation group to 67%
after implementation of the protocol, and the lack of effect on
mortality might thus be explained by inadequate provision of
energy. No information on protein provision or glycemic control was provided [5]. In the ACCEPT study, the provision of
energy after implementation of algorithms to improve caloric
intake was most probably insufficient compared with the
energy target used: in the intervention group the provision of
calories was 1264 kcal per patient day, compared with 998
kcal in the control group. The amount of protein delivered was
0.41 g/kg/day, compared with 0.37 g/kg/day in the control
group [6]. In the study by Doig and colleagues [7], also implementing evidence-based feeding guidelines, no statistically
different amounts of energy and protein were delivered to the
intervention group compared with the control group (1241
kcal/day and 1065 kcal/day, respectively; and 50.1 g/day and
44.2 g/day, respectively) and thus much lower than the targets
Women have a lower body weight as a group and thus less
energy expenditure than men. As administration of the volume
of enteral nutrition formulas is a limiting factor early in the
course of nutritional therapy, women are more likely to reach
their nutritional goals.
The energy deficit occurs especially in the first days after
admission, when targeted volume cannot be administered due
to retention, slow increase of nutritional volume towards the
targeted volume, hemodynamic instability and diagnostic and
therapeutic interventions.
Recently, Pichard and colleagues [16] have demonstrated
that provision of more than 1500 kcal/day in the first three
days of admission besides parenteral glucose reduces ICU
mortality and hospital mortality. Early provision of energy diminishes the cumulative caloric deficit.
To our knowledge, our study is the first one in which beneficial
effects of both energy and protein provision on mortality in critically ill patients have been demonstrated.
We can only speculate to explain the differences between
gender that we found. No data on body composition changes
during ICU or hospital stay are available, and we did not perform nitrogen balances and endocrine investigations towards
gender differences. A possible explanation for the difference in
effect of nutritional therapy between men and women might be
that an absolute minimum of protein content in the body is critical for survival. Beyond this hypothesized protein threshold,
loss of organ function and failing immune status will predispose to death. If this was true, males have an advantage in
nutritional reserve, because they are heavier and also have a
more favorable proportionality between fat and protein, with
larger relative protein stores [17]. Thus, females have a disadvantage because they will reach this presumed minimum protein threshold in a shorter period of time during catabolism.
Adequate nutrition aims to protect the body composition and
slows down catabolism. With the smaller reserve that females
Page 9 of 11
(page number not for citation purposes)
Critical Care
Vol 13 No 4
Strack van Schijndel et al.
that we set for energy and protein as considered minimal in our
study [6]. Also in these studies, no data on glycemic control
were provided.
Thus, it is plausible that differences in study designs, numbers
of patients included, different definitions for nutritional goals
and analyses on group level instead of analyses on the level of
individual patients account for finding different effects of nutrition on mortality.
Our study has limitations. It is an observational study. Neither
body composition was established nor were nitrogen balances performed, so that the hypothesized correlation
between net protein loss and mortality could not be substantiated. As in similar studies, the pre-admission weight was not
accurately known for all patients. Although, in the statistical
analysis, we corrected for weight, height, APACHE-II, diagnosis group and glycemic control, it is possible that other factors
may have influenced mortality. Although the hypothesis of optimal nutrition does not take gender into consideration, we
could demonstrate only an effect on mortality in women. Furthermore, the recommendations for the amounts of energy and
protein provision in critically ill patients originate from only a
limited number of studies and might prove to be insufficiently
tailored towards the individual needs in such a diverse population [19-22].
Conclusions
In conclusion, the main finding of our study is that reaching
both an energy goal guided by indirect calorimetry and provision of protein in an amount of at least 1.2 g/kg pre-admission
body weight during the period of artificial nutrition while
mechanically ventilated, reduces ICU, 28-day and hospital
mortality in the female part of the population. The favorable
effect in women on ICU mortality could not be demonstrated
for those who reached the energy goal but failed to attain 1.2
g of protein/kg/day. For males no beneficial effects on mortality could be shown of reaching these nutritional targets during
the period of artificial ventilation.
Although our findings must be confirmed by others, we argue
that the observed beneficial effects of nutrition in females are
so pronounced, that an ultimate effort should be made to
secure adequate provision of both energy and protein. Further
research is needed to elucidate the underlying mechanisms to
explain the relation between nutrition, gender and mortality in
ICU patients.
Key messages
•
Optimal nutrition for intensive care patients can be
defined as provision of energy as actually used and protein in an amount of 1.2 to 1.5 g/kg pre-illness body
weight/day.
•
So far the goals of optimal nutrition were surrogate endpoints; this study shows that for long-term acute care of
female patients, optimal nutrition affects clinically relevant outcomes.
•
Female patients who reach their energy and protein
goals have significantly lower ICU, 28 day- and hospital
mortality compared with those who do not reach these
goals.
•
In the long-term acute care of female patients reaching
both energy and protein goals is more advantageous
than reaching only the energy goal: in the latter case
ICU mortality is not affected and the effect on 28-day
mortality is less obvious, which suggests that the beneficial effect of also reaching the protein goal is especially important in the early phase of critical illness.
•
In the present study, beneficial effects of optimal nutrition could not be demonstrated in the male part of our
population.
Authors' contributions
The study was designed by all authors. Caloric measurements
were performed by RS and AB. Data retrieval and statistical
analyses were performed by RK and PW. HS and RS defined
optimal nutrition. All authors were involved in the several
stages of writing the manuscript. RS and PW had full access
to all of the data in the study and take responsibility for the
integrity of the data and the accuracy of the data analysis.
Additional files
The following Additional files are available online:
Additional file 1
A Word file describing the nutrition, sedation and
weaning protocol of the ICU.
See />supplementary/cc7993-S1.doc
Competing interests
Acknowledgements
The authors declare that they have no competing interests.
The authors wish to thank Ronald Driessen and Jan Peppink for their
work on the database and for the retrieval of data. No compensation was
received by either one.
References
1.
Page 10 of 11
(page number not for citation purposes)
Sauerwein HP, Strack van Schijndel RJ: Perspective: How to
evaluate studies on peri-operative nutrition? Considerations
Available online />
2.
3.
4.
5.
6.
7.
8.
9.
10.
11.
12.
13.
14.
15.
16.
17.
18.
19.
20.
21.
about the definition of optimal nutrition for patients and its key
role in the comparison of the results of studies on nutritional
intervention. Clin Nutr 2007, 26:154-158.
Villet S, Chiolero RL, Bollmann MD, Revelly JP, Cayeux R, N MC,
Delarue J, Berger MM: Negative impact of hypocaloric feeding
and energy balance on clinical outcome in ICU patients. Clin
Nutr 2005, 24:502-509.
Dvir D, Cohen J, Singer P: Computerized energy balance and
complications in critically ill patients: an observational study.
Clin Nutr 2006, 25:37-44.
Anbar R, Theilla M, Fisher H, Madar Z, Cohen J, Singer P:
Decrease in hospital mortality in tight calorie balance control
study: the preliminary results of the TICACOS study. Clin Nutr
Supplements 2008, 3:11.
Barr J, Hecht M, Flavin KE, Khorana A, Gould MK: Outcomes in
critically ill patients before and after the implementation of an
evidence-based nutritional management protocol. Chest
2004, 125:1446-1457.
Martin CM, Doig GS, Heyland DK, Morrison T, Sibbald WJ: Multicentre, cluster-randomized clinical trial of algorithms for critical-care enteral and parenteral therapy (ACCEPT). CMAJ
2004, 170:197-204.
Doig GS, Simpson F, Finfer S, Delaney A, Mitchell I, Gobb G:
Effects of evidence-based feeding guidelines on mortality of
critically ill patients. A cluster randomized controlled trial.
JAMA 2008, 300:2731-2741.
AARC Clinical Practice guideline: Metabolic measurement
using indirect calorimetry during mechanical ventilation-2004
revision & update. Resp Care 2004, 49:1073-1079.
Alexander E, Susla GM, Burstein AH, Brown DT, Ognibene FP:
Retrospective evaluation of commonly used equations to predict energy expenditure in mechanically ventilated, critically ill
patients. Pharmacotherapy 2004, 24:1659-1667.
van Lanschot JJ, Feenstra BW, Vermeij CG, Bruining HA: Calculation versus measurement of total energy expenditure. Crit
Care Med 1986, 14:981-985.
Roza AM, Shizgal HM: The Harris Benedict equation reevaluated: resting energy requirements and the body cell mass. Am
J Clin Nutr 1984, 40:168-182.
Guideline Perioperative Nutrition 2007 [ />product/richtlijnen/folder20021023121843/
rl_periovoed_07.pdf]. Dutch Institute for Healthcare Improvement
CBO, Utrecht
Strack van Schijndel RJM, Weijs PJM, Sauerwein HP, de Groot
SDW, Beishuizen A, Girbes ARJ: An algorithm for balanced protein/energy provision in critically ill mechanically ventilated
patients. E-spen Eur E-J Clin Nutr Metabolism 2007, 2:69-74.
Glance LG, Osler T, Shinozaki T: Effect of varying the case mix
on the standardized mortality ratio and W statistic. Chest
2000, 117:1112-1117.
Vogelzang M, Horst IC van der, Nijsten MW: Hyperglycaemic
index as a tool to assess glucose control: a retrospective
study. Crit Care 2004, 8:R122-127.
Pichard C, Kreymann GK, Weimann A, Herrmann HJ, Schneider H:
Early energy supply decreases ICU and hospital mortality: a
multicentre study in a cohort of 1209 patients. Clin Nutr
Supplements 2008, 3:7.
De Lorenzo A, Andreoli A, Serrano P, D'Orazio N, Cervelli V, Volpe
SL: Body cell mass measured by total body potassium in normal-weight and obese men and women. J Am Coll Nutr 2003,
22:546-549.
Polderman KH, Girbes AR, Thijs LG, Strack van Schijndel RJ:
Accuracy and reliability of APACHE II scoring in two intensive
care units. Problems and pitfalls in the use of APACHE II and
suggestions for improvement. Anaesthesia 2001, 56:47-50.
Ishibashi N, Plank LD, Sando K, Hill GL: Optimal protein requirements during the first 2 weeks after the onset of critical illness.
Crit Care Med 1998, 26:1529-1535.
Sevette A, Smith RC, Aslani A, Kee AJ, Hansen R, Barratt SM, Baxter RC: Does growth hormone allow more efficient nitrogen
sparing in postoperative patients requiring parenteral nutrition? A double-blind, placebo-controlled randomised trial.
Clin Nutr 2005, 24:943-955.
Shaw JH, Wildbore M, Wolfe RR: Whole body protein kinetics in
severely septic patients. The response to glucose infusion and
total parenteral nutrition. Ann Surg 1987, 205:288-294.
22. Stapleton RD, Jones N, Heyland DK: Feeding critically ill
patients: what is the optimal amount of energy? Crit Care Med
2007, 35:S535-540.
Page 11 of 11
(page number not for citation purposes)