Báo cáo y học: "Computerized intensive insulin dosing can mitigate hypoglycemia and achieve tight glycemic control when glucose measurement is performed frequently and on time" pptx
Bạn đang xem bản rút gọn của tài liệu. Xem và tải ngay bản đầy đủ của tài liệu tại đây (756.35 KB, 10 trang )
Open Access
Available online />Page 1 of 10
(page number not for citation purposes)
Vol 13 No 5
Research
Computerized intensive insulin dosing can mitigate hypoglycemia
and achieve tight glycemic control when glucose measurement is
performed frequently and on time
Rattan Juneja
1
, Corbin P Roudebush
2
^, Stanley A Nasraway
3
, Adam A Golas
2
, Judith Jacobi
4
,
Joni Carroll
4
, Deborah Nelson
5
, Victor J Abad
6
and Samuel J Flanders
7
1
Division of Endocrinology, Indiana University School of Medicine, 545 Barnhill Drive, EH 421, Indianapolis, IN 46202, USA
2
Department of Medicine and Clarian Health, Indiana University School of Medicine, 545 Barnhill Drive, EH 421, Indianapolis, IN 46202, USA
3
Department of Surgery, Tufts Medical Center, Tufts University School of Medicine, 750 Washington Street, NEMC Box 4630, Boston, MA 02111,
USA
4
Methodist Hospital/Clarian Health, 1701 N. Senate Blvd., Indianapolis, IN 46202, USA
5
Medical Quality, Clarian Health, ERC 6102, 1701 N. Senate Blvd., Indianapolis, IN 46202, USA
6
The Epsilon Group Virginia LLC, 615 Woodbrook Drive, Charlottesville, VA 22901, USA
7
William Beaumont Hospital, 3601 W 13 Mile Road, Royal Oak, MI 48073-9952, USA
^ Deceased
Corresponding author: Rattan Juneja, Deceased
Received: 16 Jul 2009 Revisions requested: 30 Jul 2009 Revisions received: 17 Aug 2009 Accepted: 12 Oct 2009 Published: 12 Oct 2009
Critical Care 2009, 13:R163 (doi:10.1186/cc8129)
This article is online at: />© 2009 Juneja et al.; licensee BioMed Central Ltd.
This is an open access article distributed under the terms of the Creative Commons Attribution License ( />),
which permits unrestricted use, distribution, and reproduction in any medium, provided the original work is properly cited.
Abstract
Introduction Control of blood glucose (BG) in critically ill
patients is considered important, but is difficult to achieve, and
often associated with increased risk of hypoglycemia. We
examined the use of a computerized insulin dosing algorithm to
manage hyperglycemia with particular attention to frequency
and conditions surrounding hypoglycemic events.
Methods This is a retrospective analysis of adult patients with
hyperglycemia receiving intravenous (IV) insulin therapy from
March 2006 to December 2007 in the intensive care units of 2
tertiary care teaching hospitals. Patients placed on a glycemic
control protocol using the Clarian GlucoStabilizer™ IV insulin
dosing calculator with a target range of 4.4-6.1 mmol/L were
analyzed. Metrics included time to target, time in target, mean
blood glucose ± standard deviation, % measures in
hypoglycemic ranges <3.9 mmol/L, per-patient hypoglycemia,
and BG testing interval.
Results 4,588 ICU patients were treated with the
GlucoStabilizer to a BG target range of 4.4-6.1 mmol/L. We
observed 254 severe hypoglycemia episodes (BG <2.2 mmol/
L) in 195 patients, representing 0.1% of all measurements, and
in 4.25% of patients or 0.6 episodes per 1000 hours on insulin
infusion. The most common contributing cause for
hypoglycemia was measurement delay (n = 170, 66.9%). The
median (interquartile range) time to achieve the target range was
5.9 (3.8 - 8.9) hours. Nearly all (97.5%) of patients achieved
target and remained in target 73.4% of the time. The mean BG
(± SD) after achieving target was 5.4 (± 0.52) mmol/L. Targeted
blood glucose levels were achieved at similar rates with low
incidence of severe hypoglycemia in patients with and without
diabetes, sepsis, renal, and cardiovascular disease.
Conclusions Glycemic control to a lower glucose target range
can be achieved using a computerized insulin dosing protocol.
With particular attention to timely measurement and adjustment
of insulin doses the risk of hypoglycemia experienced can be
minimized.
BG: blood glucose; ICU: intensive care unit; IQR: interquartile range; IV: intravenous; NICE SUGAR: The Normoglycemia in Intensive Care Evaluation
and Survival Using Glucose Algorithm Regulation; SD: standard deviation; VISEP: Volume Substitution and Insulin Therapy in Severe Sepsis.
Critical Care Vol 13 No 5 Juneja et al.
Page 2 of 10
(page number not for citation purposes)
Introduction
Hyperglycemia is a recognized adverse factor for intensive
care unit (ICU) outcomes [1,2]. The landmark study by van den
Berghe and colleagues in 2001 provided evidence for a
causal link between tight glycemic control and reduced mor-
bidity and mortality in a surgical ICU population [3]. Observa-
tional studies outside of clinical trials supported these results,
finding improved outcomes after intensive insulin therapy to
manage hyperglycemia in the critically ill patient [4-6]. Based
on these results and subsequent published guidelines [7,8],
hospitals increasingly adopted glycemic control programs,
despite controversy regarding how best to use continuous
insulin therapy to normalize glucose, the optimal target ranges
for improved outcomes and patient populations that most ben-
efit.
Attempts to replicate these early studies have raised concerns
about the safety of 'tight' glycemic control protocols. Several
large randomized controlled trials were stopped due to unac-
ceptably high rates of severe hypoglycemia (blood glucose
(BG) <2.2 mmol/L), 9.8% of patients in the Glucontrol study
[9] and 17.0% of the tight control group in the Efficacy of Vol-
ume Substitution and Insulin Therapy in Severe Sepsis
(VISEP) study [10]. Similarly, 18.7% of the intervention group
in the Leuven II medical ICU study experienced severe
hypoglycemia, increasing to 25% among patients with ICU
stays of 5 days or longer [11]. Most recently, intensive glucose
control in the Normoglycemia in Intensive Care Evaluation and
Survival Using Glucose Algorithm Regulation (NICE-SUGAR)
trial [12] was associated with a 14-fold increase in severe
hypoglycemia (6.8%) compared with the moderate glucose
control group (0.5%; P < 0.001). Subsequently, two meta-
analyses also demonstrated that severe hypoglycemia
increased the likelihood of death six-fold [13,14]. This over-
arching concern for hypoglycemia has resulted in a call for
more measured, less aggressive glycemic control [13-15],
and higher target BG ranges (6.1 to 7.7 mmol/L and 7.8 to
10.0 mmol/L) with recommendations against BG lower than
6.1 mmol/L [15].
These recent results have left clinicians sitting on the horns of
the dilemma; how to achieve and maintain glucose control
without increasing the risk of hypoglycemia [16]. One reason
for this dilemma might be that intravenous (IV) insulin proto-
cols have been designed to lower BG in order to achieve a
'normal' or 'optimal' BG target range, without consideration for
their tendency to cause hypoglycemia. Indeed, the literature on
manual and computerized protocols reports wide variation in
performance in terms of patients reaching target and hypogly-
cemia rates varying from 4.6% to over 25.0% [17-20]. Moreo-
ver, the variety of methods used to measure BG (and their
relative accuracy), and the metrics used to define and report
hypoglycemia make it challenging to ascertain the actual risk
of hypoglycemia with any degree of certainty [21].
On one hand, paper protocols require manual calculation and
documentation based on a single BG measure, without con-
sideration of the patient's insulin sensitivity and response to
previous dosing. On the other hand, computerized applica-
tions, which enable rapid, complex calculations for recom-
mended insulin infusion rates, have demonstrated superior
overall efficacy and safety in some reports [22-26], and failed
to improve glycemic control or reduce hypoglycemia in others
[27,28] when compared with manual protocols.
We previously reported our experience with a computerized IV
insulin protocol, the GlucoStabilizer™ achieving BG targets of
4.4 to 6.1 mmol/L in 61.0% of patients with minimal hypogly-
cemia (<2.8 mmol/L, 4.25%) [29]. Given the concerns sur-
rounding hypoglycemia with intensive insulin therapy, we
examine herein, factors contributing to hypoglycemia in the
context of the overall performance metrics of the GlucoStabi-
lizer.
Materials and methods
This study was performed with the approval of the Indiana Uni-
versity human subjects investigational review board. Based on
the retrospective and non-interventional nature of this
research, patient consent was not required and was waived. In
this study, data were analyzed for adult patients with hypergly-
cemia treated with the GlucoStabilizer (Medical Decisions
Network, Charlottesville, VA, USA) to a target range of 4.4 to
6.1 mmol/L in ICUs from March 2006 to December 2007. The
ICUs were large, with 30 and 32 beds available to both medi-
cal and surgical patient populations. Illness severity scores
were not available for these analyses. Average length of stay
was 5.5 days, and patient care required a high nurse to patient
ratio (1:2 respectively). Hourly BG measurements were most
frequently obtained by fingerstick capillary sampling; however,
venous and arterial sampling with point-of-care glucometer,
blood gas analyzer and central laboratory measurement were
also included, reflecting a real-world clinical context.
Use of the GlucoStabilizer has been previously described in
detail [29]. In brief, when a patient BG value is entered, the
program calculates an initial insulin infusion rate in units/hour
using (BG in mg/dL - 60) × multiplier, set at an initial default of
0.02, (an insulin sensitivity factor) [30]. The BG target range
set to 80 to 110 mg/dL (4.4 to 6.1 mmol/L), testing interval set
to 60 minutes, and reminder alarms set for 55 minutes were
preprogrammed. In the event of hypoglycemia (BG <3.9
mmol/L), the software reverts to a hypoglycemia recovery
mode and calculates an appropriate dose of D50W = (100 -
BG in mg/dL) × 0.4 mL) to be given IV. An audible alarm alerts
the nurse to a scheduled BG check and also every 15 minutes
until recovery from the hypoglycemic event to the target BG
range. All drip run information and insulin doses are electroni-
cally saved in the GlucoStabilizer database.
Available online />Page 3 of 10
(page number not for citation purposes)
In the absence of generally accepted performance metrics for
IV insulin protocols [21], we evaluated the safety and efficacy
of our experience with the GlucoStabilizer using standardized
methods to calculate (1) time to target BG; (2) time BG
remained in target range of 4.4 to 6.1 mmol/L; (3) rate of
hypoglycemia using several metrics including: the proportion
of episodes overall (n, % for BG <2.2, <2.8, <3.3, <3.9 mmol/
L), percentage of patients experiencing at least one episode of
BG less than 2.2 mmol/L, the number of events per patient
and the number of events standardized to 1000 drip run hours,
time to hypoglycemia episode and time spent in hypoglycemia.
We used at least one episode of BG less than 2.2 mmol/L as
a measure of critical and severe hypoglycemia, to correspond
with the most common definition of serious hypoglycemia
reported in the literature.
We used a 'patient drip run' as the unit of analysis when cal-
culating time to achieving target BG range, percentage of time
within target range, and incidence of hypoglycemia. A patient
drip run starts with entry of a patient's identifying data and ini-
tial BG into the GlucoStabilizer program. IV insulin drip runs
are generally initiated after two BGs above 7.2 mmol/L deter-
mined by either point-of-care or laboratory measurements. For
analysis purposes, a drip run is considered complete when
there is a gap of six hours or more between successive BG
measurements. The same patient can thus have multiple drip
runs, as might occur when IV insulin is restarted after a period
of normal BG followed by later reoccurrence of hyperglycemia.
Drip runs started for patients with a baseline BG of 6.1 mmol/
L or less were not included in this analysis.
A 'patient time-glucose curve' is used in this analysis as a con-
tinuous representation of glucose readings resulting from a
drip run over time. This curve is constructed by plotting the dis-
crete set of time and BG pairs as points, with time on the ×-
axis and BG on the y-axis. These points are connected by line
segments, producing a curve that approximates the patient's
BG at any time during the drip run. The percentage of time that
a patient was within a particular BG range, for example 4.4 to
6.1 mmol/L, was calculated relative to this curve, as was one-
hour BG change. The patient time-glucose curve was con-
structed for 50 hours' duration (mean drip run length for this
patient population).
In addition to analyzing these parameters, we were interested
in performance of the software protocol within different dis-
ease subgroups. Patient populations for subgroup analysis
were identified using International Classification of Diseases,
9
th
Revision, Clinical Modification diagnosis and procedure
codes from our inpatient database: sepsis (038.9 and either
995.91 or 995.92), acute myocardial infarction (410.xx, pri-
mary diagnosis only, excluding 410.x2 for follow-up treatment),
coronary artery bypass graft (36.1x, primary procedure only),
all diabetes mellitus (250.xx), type 1 diabetes mellitus (250.x1
or 250.x3), new onset acute renal failure (584.5, 584.61,
584.7, 584.8, or 584.9), chronic kidney disease (585.x), and
those on dialysis [38.95].
Statistical analysis
Insulin drip runs were analyzed using the median (interquartile
range [IQR]) measure. Kaplan-Meier time-to-event curves
were used to estimate time to achieve target range. Hypogly-
cemia was examined by using Kaplan-Meyer time-to-event
curves to estimate time-to-hypoglycemia, calculated as the
amount of time into the drip run when a hypoglycemic BG was
first recorded. Descriptive statistics were used to calculate fre-
quency of hypoglycemia events in terms of percent of events,
number of events per patient, and events standardized to
1000 drip-run hours. A further analysis to determine the influ-
ence of timing of BG measurement on the occurrence of
hypoglycemia events was modeled by examining the rate of
change between measures as a predictor of hypoglycemia
when measurement was delayed. Subgroup comparisons
were made using the Chi-squared statistic. All analyses were
performed using SPSS 15.0 (SPSS Inc, Chicago, IL, USA).
Results
During the study period, 4588 ICU patients were treated with
the GlucoStabilizer to a target range of 4.4 to 6.1 mmol/L.
There were a total of 6069 drip runs recorded in the GlucoS-
tabilizer database for these patients. Runs where the starting
BG was 6.1 mmol/L or less were excluded leaving 5456 runs
for this analysis. The median (IQR) drip run length was 40.3
(19.2 to 83.0) hours.
Time to target and time within target
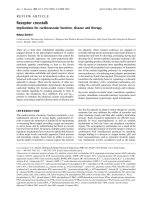
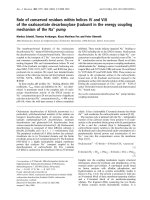
The median (IQR) time to achieve target range was 5.9 (3.8 to
8.9) hours. The median times to achieve target range were
longer for higher initial BG; times to target (IQR) for baseline
BG in ranges of more than 6.1 to 8.3, more than 8.3 to 11.1,
more than 11.1 to 13.8, and more than 13.8 mmol/L were 3.8
(2.1 to 6.4), 5.8 (4.0 to 8.6), 6.8 (4.7 to 9.6), and 7.9 (5.4 to
11.0) hours, respectively. Kaplan-Meier time-to-event curves
for the time to achieve target range demonstrate this depend-
ence on the baseline BG (Figure 1). Almost all patients
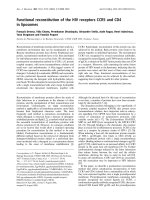
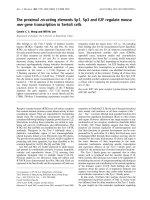
(97.5%) achieved the target range. Mean BG (± standard
deviation (SD)) after achieving target was 5.4 (± 0.52) mmol/
L. After reaching target, patients remained in target 4.4 to 6.1
mmol/L, 73.4% of the time, and in the expanded ranges of 3.9
to 6.6 mmol/L and 3.9 to 8.3 mmol/L, 89.2% and 95.9% of the
time respectively, over 50 hours of the drip run. (Figures 2a
and 2b)
Hypoglycemia
A 4.25% proportion of patients experienced at least one epi-
sode of BG less than 2.2 mmol/L. We observed 254 episodes
of severe hypoglycemia in 195 patients, with 32 patients expe-
riencing more than one event. Overall, 0.1% of the 289,289
BGs in the database were less than 2.2 mmol/L and corre-
sponding rates for less than 2.8, less than 3.3 and less than
Critical Care Vol 13 No 5 Juneja et al.
Page 4 of 10
(page number not for citation purposes)
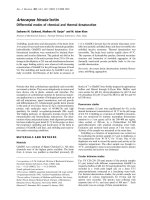
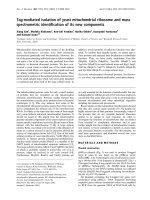
3.9 mmol/L were 0.07%, 0.31% and 1.36%, respectively (Fig-
ure 2a). Over the first 14 days of IV insulin therapy, the
hypoglycemia incidence standardized to 1000 hours are
shown in Figure 3a; with rates of 0.60, 1.89, 6.35, 20.5 for the
increments of hypoglycemia. The Kaplan-Meier time-to-event
curves for the time to hypoglycemia for less than 2.2, less than
2.8, less than 3.3, and less than 3.9 mmol/L illustrate that the
incidence of hypoglycemia increased with the duration of the
drip (Figure 3b). For drip runs lasting 24, 48, 72, 96, and 120
hours, the percentage with at least one episode of severe
hypoglycemia (BG <2.2 mmol/L) was 1.1, 2.5, 3.8, 4.7, and
5.4% respectively.
We further examined the 254 episodes (n = 195 patients) of
severe hypoglycemia (BG <2.2 mmol/L) in the 4588 patients.
Assuming that BG changes at a constant rate between meas-
urements in response to a constant insulin dose, we used the
following model to examine time to hypoglycemia and time
spent in hypoglycemia: for each hypoglycemic measure, we
assumed a constant decrease of 0.05 mmol/L/min from the
previous BG measure, based on usual protocol performance.
For example, if a measure of 6.1 mmol/L at 1200 hours was
followed by a measure of 1.7 mmol/L at 1320 hours (80 min-
utes later); using our model, the level of 2.2 mmol/L would be
reached in 70 minutes, that is at 1310 hours. An on-time
measurement at 1255 hours (when estimated BG would have
been 3.0 mmol/L), would have triggered hypoglycemia recov-
ery mode by the software and the avoidance of the severe
hypoglycemic event. Using this model we found that in 170
(66.9%) of the 254 severe hypoglycemia episodes, the dura-
tion of measurement delay exceeded the estimated time to
hypoglycemia, suggesting that delayed measurement by 12
minutes (median 21.8 minutes, IQR 12.2 to 29.0 minutes) may
have contributed to these severe hypoglycemic episodes. In
116 (45.7%) of the severe hypoglycemic episodes, the previ-
ously measured BG exceeded 6.1 mmol/L, demonstrating that
severe hypoglycemia may also be associated with large, (>3.3
mmol/L/hr decrease) rapid (more than 0.05 mmol/L/min), and
unpredictable drops in BG. Two hundred and one (79.1%)
episodes were associated with either a previous BG of more
than 6.1 mmol/L or a measurement delay that exceeded the
estimated time to hypoglycemia and 85 episodes were asso-
ciated with both. No discernable cause for hypoglycemia
occurrence could be determined in 84 patients. In evaluating
all the hypoglycemic events, the mean (± SD) amount of time
that a patient was severely hypoglycemic before detection was
8.9 ± 7.4 minutes. The time to BG recovery to 2.2 mmol/L was
3.8 ± 6.1 minutes, and time to target recovery of more than 3.9
mmol/L was 28.0 ± 26.2 minutes; with a mean BG of 6.1 ±
2.9 mmol/L at recovery.
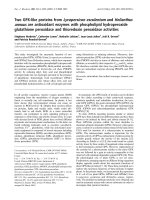
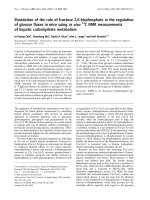
Finally, GlucoStabilizer performance was found to be compa-
rably effective in several critically ill patient populations, with
similar time-to-target and time-within-target durations in
patients with and without diabetes, and with admission diag-
nosis of sepsis, acute myocardial infarction, coronary artery
bypass graft, or renal disease. Hypoglycemia rates were also
low in all patient subtypes studied with the highest rate seen
in patients with type 1 diabetes (Figure 4).
Discussion
The challenge of inpatient hyperglycemia management is to
find a balance between two disparate and competing goals;
that of correcting hyperglycemia while minimizing and prevent-
ing hypoglycemia. When insulin is administered, hypoglycemia
is a foreseeable consequence, and more likely to occur with
more aggressive and narrow BG target ranges. In contrast to
some of the commonly used protocols, the GlucoStabilizer
achieved target more often (97.5%) for longer duration, with a
comparable incidence of severe hypoglycemia (4.25% per
patient, and 0.1% per measure). Additionally, we found the
hypoglycemia rate would be considerably less (2.0% per
patient) with timely BG measurement. The Leuven paper-
based protocol [3], using a target range of 4.4 to 6.1 mmol/L
showed ability to reach a mean BG of 5.7 ± 1.1 mmol/L and a
significant improvement in mortality and morbidity for surgical
ICU patients with a severe hypoglycemia rate of 5.1% (any BG
≤ 2.2 mmol/L). The Leuven protocol and target ranges were
subsequently implemented in two other large multicenter ran-
domized trials that were stopped prematurely due to exces-
sive, significant hypoglycemia [9,10]. In VISEP [10] the
hypoglycemia rate was 17.0% compared with 4.1% in the
control group, while in GLUCONTROL [9] the incidence of
hypoglycemia (BG <2.2 mmol/L) was 9.8% in the intensive
group compared with 2.7% in the control group. It is of interest
Figure 1
Time to achieve target range for starting blood glucoseTime to achieve target range for starting blood glucose. Kaplan-Meier
time-to-event curves for the time to achieve target range 4.4 to 6.1
mmol/L, for starting blood glucose ranges >6.1 to 8.3 mmol/L, >8.3 to
11 mmol/L, >11 to 13.8 mmol/L, and >13.8 mmol/L.
Available online />Page 5 of 10
(page number not for citation purposes)
that these studies utilized the same protocol, yet realized such
different rates of hypoglycemia, demonstrating that factors
outside of the protocol rather than the glucose target may sig-
nificantly influence glucose control and hypoglycemia.
Regarding other protocols, in a study of cardiac surgery
patients with diabetes, 61% of patients achieved the glucose
target range of 4.4 to 8.3 mmol/L while on continuous insulin
infusion based on the Portland protocol (paper-based) with a
7.1% hypoglycemia rate (BG <2.2 mmol/L) [4]. In contrast, a
very low incidence of hypoglycemia was reported in a study
using the Yale protocol in cardiothoracic ICU and medical ICU
patients (0.2% and 0.3%, respectively, with successful glyc-
emic control in 73% and 66% of both populations (target BG
range of 4.4 to 7.7 mmol/L). However, hypoglycemia was
defined as a BG less than 3.3 mmol/L in these studies [28].
Similarly, 53.9% of all patient measures were in the 4.4 to 6.1
mmol/L target while only 0.1% of measures fell below 4.0
mmol/L in a study using the computer-derived, but paper-
based Specialised Relative Insulin Nutrition Tables protocol
[29]. Two studies comparing the Model Predictive Control
Algorithm to the routine paper glucose management proto-
cols, found improved glycemic control based on lower mean
BG achieved, and longer time in target range and low rates of
Figure 2
Proportion of measures reaching target and remaining in targetProportion of measures reaching target and remaining in target. Percentage of measures in selected blood glucose ranges after target range of 4.4
to 6.1 mmol/L achieved. (a) Percentage of measures in selected ranges using 0.55 mmol/L intervals; (b) Percentage of time blood glucose meas-
ures were in target for ranges 4.4 to 6.1, 3.3 to 6.7, 3.3 to 7.2, and 3.3 to 8.3 mmol/L for the first 50 hours after target range achieved.
Critical Care Vol 13 No 5 Juneja et al.
Page 6 of 10
(page number not for citation purposes)
hypoglycemia [25,31,32]. These studies were not included in
a review of the relative risk of hypoglycemia with intensive insu-
lin therapy in the ICU [13] which reported the incidence of
hypoglycemia and outcomes among the patients treated with
these various protocols of various targets and hypoglycemia
definitions. Hypoglycemia incidence ranged from 5.0% to
18.7% in tight glucose target groups, and found a significantly
increased overall risk of hypoglycemia (13.7% vs. 2.5%; rela-
tive risk 5.13; 95% confidence interval 4.10 to 6.43) with insu-
lin treatment to lower glycemic targets [13]. An updated meta-
analysis that included the NICE-SUGAR results again found a
six-fold increased risk of severe hypoglycemia among patients
given intensive insulin therapy compared with controls, with lit-
tle examination of the protocols represented [14]. In fact, on
examination of the protocols included, it appears all are clini-
cally derived, and there is little that differentiates the basic ele-
Figure 3
Hypoglycemia incidenceHypoglycemia incidence. (a) Number of hypoglycemic episodes per 1000 hours over the first 14 days; (b) Kaplan-Meier time-to-event curves for the
times to hypoglycemia <2.2, <2.8, <3.3, and <3.9 mmol/L.
Available online />Page 7 of 10
(page number not for citation purposes)
ments of these protocols except their reported success or
failure in various populations and settings.
When evaluating reports of experience with computerized
insulin infusion protocols, some have shown improved glyc-
emic control with reduced time-to-target, longer time-in-target
and lower rates of hypoglycemia [20,22-35]. Most of these
protocols have two attributes in common; an insulin dose cal-
culator that uses a current and previous BG value (considering
the insulin sensitivity) and a recommendation for the timing of
the next BG measure. Protocol compliance can exceed 90%,
and achieve better glucose control when compared with
paper-based protocol [34]. But, even when these factors are
in place, it may be difficult to achieve low BG targets without
hypoglycemia. It must be noted that although the NICE-
SUGAR web-based insulin dose calculation protocol was
standardized across 42 centers there was a high rate of pro-
tocol deviation. In an interim safety analysis of the first 100
hypoglycemic events occurring in the study, 8.0% of patients
treated in the intensive glycemic control arm experienced
severe hypoglycemia (BG <2.2 mmol/L) versus 0.3% in the
moderately controlled group. Adjudicated causes were
reported to be clinician error (failure to follow the computer-
ized treatment algorithm and infrequent BG monitoring in
37%, decreased nutritional intake 24%, pre-terminal state 8%,
spurious measurement error 16%, and other miscellaneous
causes in 15% [34-36] Additionally, BG measures were taken
at various intervals (one to four-hour intervals) with no reminder
system to support timely BG testing. Many protocols lack the
audible reminders to perform timely BG measurement and
insulin dose adjustment-critical factors for safe and effective
glycemic control, as demonstrated in our analysis. Additionally,
ameliorating factors that predispose to hypoglycemia [37-39]
and management of rapid fluctuations in BG levels with
prompt, frequent, accurate and timely glucose measurements
are external factors that contribute to the success or failure of
any protocol [40].
So although many reports and numerous editorials have called
tight glycemic control strategies into question citing the inher-
ent risk of hypoglycemia and association with mortality, they
have largely overlooked performance characteristics of the IV
insulin protocols used in the studies. Protocol comparisons
have shown that different BG targets were used, there were
differences in study populations, differences in definitions of
hypoglycemia, all of which contributed to wide disparities in
Figure 4
GlucoStabilizer management of all patients, compared with those with AMI, CABG, diabetes, and renal failureGlucoStabilizer management of all patients, compared with those with AMI, CABG, diabetes, and renal failure. (a) Time to achieve target range,
hours, median and interquartile range; (b) Mean blood glucose after target range achieved, mean and standard deviation; (c) Number of hypoglyc-
emic episodes per 1000 hours; (d) Percent of time in ranges 4.4 to 6.1, 3.9 to 6.7, 3.9 to 7.2, and 3.9 to 8.3 mmol/L after target range achieved. All
= all patients (5456 drip runs); Sepsis = (658 drip runs); AMI = acute myocardial infarction (160 drip runs); CABG = coronary artery bypass graft
(444 drip runs); DM+ = with diabetes (2717 drip runs); DM- = without diabetes (2647 drip runs); Type 1 DM = type 1 diabetes (126 drip runs);
Renal = new onset acute renal failure, chronic kidney disease, or on dialysis (2207 drip runs). The value in mmol/L can be calculated by multiplying
the mg/dL value by 0.05551.
Critical Care Vol 13 No 5 Juneja et al.
Page 8 of 10
(page number not for citation purposes)
the performances of IV insulin protocols thereby precluding
reasonable comparisons in efficacy of therapy and outcomes
[13,14,17-20]. As such, the study outcomes may more reflect
protocol compliance than protocol performance and their influ-
ence cannot be isolated.
In contrast, the GlucoStabilizer studied herein demonstrated a
high likelihood of achieving target BG with a comparably low
incidence of hypoglycemic events across our large ICU popu-
lation. Additionally, nearly 90% of patients not only achieved
BG control within the range of 3.9 to 6.7 mmol/L but also
remained in that range 96% of the time demonstrating that the
GlucoStabilizer effectively and safely controls BG. And, finally,
we found that the GlucoStabilizer performed consistently
among different critically ill patient populations.
However, even in our environment, where the testing interval is
one hour, delays in BG measurement were associated with
hypoglycemic episodes, ultimately accounting for 67% of
observed severe hypoglycemia. In the high-stress environment
of an ICU, it is not uncommon that a scheduled BG test is
delayed, despite the warning provided by audible alarms from
the GlucoStabilizer. Given the rapid action of IV insulin and an
aggressive target range, a delay of even eight minutes can
result in an episode of hypoglycemia. Additionally, we
observed large unpredictable drops in BG within the one hour
testing frequency in some patients who experienced severe
hypoglycemia. Our examination of hypoglycemic events and
their relation to timing of BG measurement is an important new
understanding of the causes of hypoglycemia, particularly
since hypoglycemia at a level less than 2.2 mmol/L could be
independently associated with increased risk of mortality [41].
Our data would further argue that while the occurrence of
severe hypoglycemia is a known risk associated with IV insulin,
especially with lower glucose targets, the risk is likely com-
pounded with any protocol that can be difficult to use with
consistency. This is especially so in a busy ICU setting where
critically ill patients and their metabolic demands can change
with little notice. All of these factors contribute to inadvertent
and unintentional errors and delays in BG testing that may
result in hypoglycemia and illustrate the limitations of current
measurement technologies when used to achieve a strict gly-
cemic target.
A major limitation of our study is its non-randomized, retro-
spective nature, which does not allow for direct comparison
and unequivocal evidence that our computerized system is
superior to a paper IV insulin protocol. However, this system
as well as other computerized dosing calculators has demon-
strated that they are able to achieve tight glucose targets and
maintain patients in narrow therapeutic ranges of BG, with low
rates of hypoglycemia in published reports and clinical experi-
ence. The methodologies used to examine hypoglycemic
events in this paper could be useful in evaluating other proto-
cols and such events in other randomized clinical trials where
IV insulin is utilized.
The authors acknowledge several significant limitations of this
investigation. Illness severity scores were not available for
these analyses; however, average length of stay was 5.5 days,
and patient care required a high nurse to patient ratio (1:2
respectively). Also, hourly blood glucose measurements were
most frequently obtained by fingerstick capillary measures,
with some venous and arterial sampling using point-of-care
glucose meter, blood gas analyzer and central laboratory
measurements. It is unknown how our results would differ if
BG measurement methodologies were controlled for in this
analysis. This study reflects a real-world clinical context, and
the influence of accuracy of the BG values is a subject of fur-
ther study. Finally, we have not presented the relation of
patient outcomes with the various indices of glycemic control,
and plan to include that in future analysis.
Conclusions
Performance characteristics of insulin dosing protocols can-
not be overlooked when evaluating the evidence for tight glyc-
emic control and resulting hypoglycemia. Factors including
timely, frequent, accurate BG measurement and treatment
with correct and prompt insulin dose adjustment contribute to
safe and effective glycemic control to any target. Our results
show that a computerized IV insulin protocol can be success-
fully implemented on a large scale in multiple ICUs in a variety
of patient conditions. We found a low rate of hypoglycemia,
compared with reports of other protocols, even with the vast
majority of patients treated to an aggressive target range of
4.4 to 6.1 mmol/L reaching target and remaining in target.
Delays in the timing of repeat BG measurements of more than
12 minutes were found to be an important contributor to 67%
of hypoglycemic events.
Competing interests
RJ and CPR (deceased) receives royalties from the sale of the
CGS dosing tool and RJ is a shareholder for Diabetes Innova-
tions, LLC, a consultancy company that gets paid the royalties
from the sale of the CGS dosing tool indicated above. SJF
receives royalties from sales of the GlucoStabilizer software
and Clarian Health Partners was assigned the patent rights for
the Glucostabilizer software. SAN is Clinical consultant for
Medical Automation Systems, Echo Therapeutics, Optiscan.
JC receives clinical consultant fees paid by Medical Automa-
tion Systems who owns license for and markets the IV Glu-
coStabilizer insulin computer program. AAG, DN, JJ, and VJA
have no competing interests.
Authors' contributions
RJ, CPR, SAN, JJ, and SJF made substantial contributions to
the conception and design of the study, and have been
involved in drafting and revising the manuscript for critically
important content. AAG, JC, and DN have been involved in the
Available online />Page 9 of 10
(page number not for citation purposes)
acquisition of data and description of the processes involved
in glycemic management. VJA is a statistician, and provided
analysis and interpretation of the data. All authors have given
final approval of this version of the manuscript.
Acknowledgements
The authors would like to thank the nursing and decision support staff at
Clarian Health for their assistance with this study. Additionally we would
like to acknowledge the late Dr. Corbin Roudebush for his extensive
contributions to this work and to the field of Endocrinology. He will be
missed. Dr. Rattan Juneja has received grant support from The Epsilon
Group Virginia, LLC. Drs. Juneja and Flanders receive royalties from the
sale of the GlucoStabilizer. Dr. Stanley Nasraway serves in an advisory
role to Optiscan Biomedical, Hayward, CA, and Echo Therapeutics,
Franklin, MA. Joni Carroll receives honoraria in relation to facilitating
commercial sales of the GlucoStabilizer. The work of Adam Golas was
supported by educational grants from The Epsilon Group Virginia, LLC.
We would also like to thank The Epsilon Group Virginia, LLC for exten-
sive assistance with the statistical analysis and writing of the manuscript.
References
1. Bagshaw S, Egi M, George C, Bellomo R, Australia New Zealand
Intensive Care Society Database Management Committee: Early
blood glucose control and mortality in critically ill patients in
Australia. Crit Care Med 2009, 37:463-470.
2. Falciglia M, Freyberg R, Almenoff P, D'Alessio D, Render M:
Hyperglycemia-related mortality in critically ill patients varies
with admission diagnosis. Crit Care Med 2009 in press.
3. Berghe G Van den, Wouters P, Weekers F, Verwaest C, Bruyn-
inckx F, Schetz M, Vlasselaers D, Ferdinande P, Lauwers P, Bouil-
lon R: Intensive insulin therapy in critically ill patients. N Engl
J Med 2001, 345:1359-1367.
4. Furnary AP, Gao G, Grunkemeier GL, Wu Y, Zerr K, Bookin S, Flo-
ten H, Starr A: Continuous insulin infusion reduces mortality in
patients with diabetes undergoing coronary artery bypass
grafting. J Thorac Cardiovasc Surg 2003, 125:1007-1021.
5. Krinsley JS: Association between hyperglycemia and increased
hospital mortality in a heterogeneous population of critically ill
patients. Mayo Clin Proc 2003, 78:1471-1478.
6. Krinsley JS: Effect of intensive glucose management protocol
on the mortality of critically ill adult patients. Mayo Clin Proc
2004, 79:992-1000.
7. ACE/ADA Task Force on Inpatient Diabetes: American College of
Endocrinology and American Diabetes Association consensus
statement on inpatient diabetes and glycemic control: a call to
action. Diabetes Care 2006, 29:1955-1962.
8. Task Force on Diabetes and Cardiovascular Diseases of the Euro-
pean Society of Cardiology (ESC) and of the European Associa-
tion for the Study of Diabetes (EASD): Guidelines on diabetes,
pre-diabetes, and cardiovascular diseases: executive sum-
mary. Eur Heart J 2007, 28:88-136.
9. Preiser JC, Devos P, Ruiz-Santana S, Melot C, Annane D, Groen-
eveld J, Iapichino G, Leverve X, Nitenberg G, Singer P, Wernerman
J, Joannidis M, Stecher A, Chiolero R: A prospective randomised
multi-centre controlled trial on tight glucose control by inten-
sive insulin therapy in adult intensvie care units: the Glucontrol
study. Intensive Care Med 2009, 35:1738-1748.
10. Brunkhorst FM, Engel C, Bloos F, Meier-Hellmann A, Ragaller M,
Weiler N, Moerer O, Gruendling M, Oppert M, Grond S, Olthoff D,
Jaschinski U, John S, Rossaint R, Welte T, Schaefer M, Kern P,
Kuhnt E, Kiehntopf M, Hartog C, Natanson C, Loeffler M, Reinhart
K, for the German Competence Network Sepsis (SepNet): Inten-
sive insulin therapy and pentastarch resuscitation in severe
sepsis. N Engl J Med 2008, 358:125-139.
11. Berghe G Van den, Wilmer A, Hermans G, Meersseman W, Wout-
ers P, Milants I, van Wijngaerden E, Bobbaers H, Bouillon R: Inten-
sive insulin therapy in the medical ICU. N Engl J Med 2006,
354:449-461.
12. The NICE-SUGAR Study Investigators: Intensive versus conven-
tional glucose control in critically ill patients. N Engl J Med
2009, 360:1283-1296.
13. Wiener RS, Wiener DC, Larson RJ: Benefits and risks of tight
glucose control in critically ill adults: a meta-analysis. JAMA
2008, 300:933-944.
14. Griesdale D, de Souza R, van Dam R, Heyland D, Cook D, Malhotra
A, Dhaliwal R, Henderson W, Chittock D, Finfer S, Talmor D:
Intensive insulin therapy and mortality among critically ill
patients: a meta-analysis including NICE-SUGAR study data.
CMAJ 2009, 180:821-827.
15. Moghissi E, Korytkowski M, DiNardo M, Einhorn D, Hellman R, Hir-
sch I, Inzucchi S, Ismail-Beigi F, Kirkman S, Umpierrez G: ADA/
AACE Consensus Statement on inpatient glycemic control.
Endocr Pract 2009, 15:1-17.
16. Nasraway SA: Sitting on the horns of a dilemma: Avoiding
severe hypoglycemia while practicing tight glycemic control.
Crit Care Med 2007, 35:2435-2437.
17. Nazer LH, Chow SL, Moghissi ES: Insulin infusion protocols for
critically ill patients: a highlight of differences and similarities.
Endocr Pract 2007, 13:137-146.
18. Wilson M, Weinreb J, Hoo GW: Intensive insulin therapy in crit-
ical care: a review of 12 protocols. Diabetes Care 2007,
30:1005-1011.
19. Meijering S, Corstjens AM, Tulleken JE, Meertens J, Zijlstra J,
Ligtenberg J: Towards a feasible algorithm for tight glycaemic
control in critically ill patients: a systematic review of the liter-
ature. Crit Care 2006, 10:R19.
20. Eslami S, Abu-Hanna A, de Jonge E, de Keizer N: Tight glycemic
control and computerized decision-support systems: a sys-
tematic review. Intensive Care Med 2009, 35:1505-1517.
21. Eslami S, de Keizer N, de Jonge E, Schultz M, Abu-Hanna A: A sys-
tematic review on quality indicators for tight glycaemic control
in critically ill patients: need for an unambiguous indicator ref-
erence subset. Critical Care 2008, 12:R139.
22. Davidson P, Steed R, Bode B: Glucommander. A computer-
directed intravenous insulin system shown to be safe, simple
and effective in 120,618 h of operation. Diabetes Care 2005,
10(28):2418-2423.
23. Boord J, Sharifi M, Greevy R, Griffin M, Lee V, Webb T, May M,
Waitman L, May A, Miller R: Computer-based insulin infusion
protocol improves glycemia control over manual protocol. J
Am Med Inform Assoc 2007, 14:278-287.
Key messages
• Insulin dosing algorithms designed to manage BG lev-
els have been implemented with varying degrees of suc-
cess in targeting euglycemia and are often associated
with high rates of hypoglycemia
• Frequent (hourly) monitoring of BG to facilitate timely
insulin dose adjustment is necessary in hypoglycemia
prevention, and measurement delay is often associated
with increased risk of severe and serious hypoglycemia
• Rapid drop in BG (>3.3 mmol/hour) combined with
measurement delay greatly increases the risk of severe
and serious hypoglycemia
• Computerized IV insulin dosing can achieve and main-
tain glycemic control in critically ill patients with low risk
of hypoglycemia when BG measurements are per-
formed frequently and on time, thereby facilitating timely
insulin dose adjustment
• Future randomized trials of inpatient glycemic manage-
ment should employ protocols that have undergone rig-
orous evaluation and are proven to have low rates of
hypoglycemia with high rates of demonstrated protocol
compliance to limit the potential confounding factors
that predispose to severe hypoglycemia and inpatient
mortality
Critical Care Vol 13 No 5 Juneja et al.
Page 10 of 10
(page number not for citation purposes)
24. Shulman R, Finney S, O'Sullivan C, Glynne P, Greene R: Tight gly-
cemic control: a prospective observational study of a compu-
terized decision-supported intensive insulin therapy protocol.
Crit Care 2007, 11:R75.
25. Vogelzang M, Zijlstra F, Nijsten M: Design and implementation of
GRIP: a computerized glucose control system at a surgical
intensive care unit. BMC Med Inform Decis Mak 2005, 5:38.
26. Pachler C, Plank J, Weinhandl H, Chassin L, Wilinska M, Kulnik R,
Kaufmann P, Smolle K, Pilger E, Pieber T, Ellmerer M, Hovorka R:
Tight glycemic control by an automated algorithm with time-
variant sampling in medical ICU patients. Intensive Care Med
2008, 34:1224-1230.
27. Toschlog E, Newton C, Allen N, Newell M, Goettler C, Schenarts
P, Bard M, Sagraves S, Rotondo M: Morbidity reduction in criti-
cally ill trauma patients through use of a computerized insulin
infusion protocol: A preliminary study. J Trauma 2007,
62:1370-1376.
28. Cavalcanti A, Silva E, Pereira A, Caldeira-Filho M, Almeida F, West-
phal G, Beims R, Fernandes C, Correa T, Gouvea M, Eluf-Neto J:
A randomized controlled trial comparing a computer-assisted
insulin protocol with a strict and conventional protocol for glu-
cose control in critically ill patients. J Crit Care 2009,
24:371-378.
29. Juneja R, Roudebush C, Kumar N, Macy A, Golas A, Wall D, Wol-
verton C, Nelson D, Carroll J, Flanders S: Utilization of a compu-
terized intravenous insulin infusion program to control blood
glucose in the intensive care unit. Diabetes Technol Ther 2007,
9:232-240.
30. White NH, Skor D, Santiago JV: Practical closed-loop insulin
delivery. A system for the maintenance of overnight euglyc-
emia and the calculation of basal insulin requirements in insu-
lin-dependent diabetics. Ann Intern Med 1982, 97:210-213.
31. Goldberg P, Roussel M, Inzucchi S: Clinical results of an
updated insulin infusion protocol in critically ill patients. Dia-
betes Care 2004, 27:188-191.
32. Chase J, Shaw G, Le Compte A, Lonergan T, Willacy M, Wong
XW, Lin J, Lotz T, Lee D, Hann C: Implementation and evaluation
of the SPRINT protocol for tight glycaemic control in critically
ill patients: a clinical practice change. Crit Care 2008, 12:R49.
33. Plank J, Blaha J, Cordingley J, Wilinska M, Chassin L, Morgan C,
Squire S, Haluzik M, Kremen J, Svacina S, Toller W, Plasnik A,
Ellmerer M, Hovorka R, Pieber T: Multicentric, randomized con-
trol trial to evaluate blood glucose control by the Model Pre-
dictive Control algorithm versus routine glucose management
protocols in intensive care unit patients. Diabetes Care 2006,
29:271-276.
34. Morris A, Orme J, Truwit J, Steingrub J, Grissom C, Lee K, Li G,
Thompson T, Brower R, Tidswell M, Bernard G, Sorenson D,
Sward K, Zheng H, Schoenfeld D, Warner H: A replicable
method for blood glucose control in critically ill patients. Crit
Care Med 2008, 36:1787-1795.
35. The NICE-SUGAR Investigators: The Normoglycemic in Inten-
sive Care Evaluation and Survival Using Glucose Algorithm
Regulation (NICE-SUGAR) Study: Development, design and
conduct of an international multicenter, open label, rand-
omized controlled trial of two target ranges for glycemic con-
trol in intensive care unit patients. Am J Respir Crit Care Med
2005. online suppl
36. Clark N, Finfer S, the NICE-SUGAR Investigators: Regulation
(NICE-SUGAR) study: analysis of the first 100 hypoglycemic
events. [ />september/niceSugar.html].
37. Mechanik JI, Handelsman Y, Bloomgarden ZT: Hypoglycemia in
the intensive care unit. Curr Opin Clin Nutr Metab Care 2007,
10:193-196.
38. Vriesendorp T, van Santen S, De Vries H, de Jonge E, Rosendaal
F, Schultz M, Hoekstra J: Predisposing factors for hypoglycemia
in the intensive care unit. Crit Care Med 2006, 34(1):96-101.
39. Elia M, De Silva: Tight glucose control in intensive care units: an
update with an emphasis on nutritional issues. Curr Opin Clin
Nutr Metab Care 2008, 11:465-470.
40. Fahy V, Sheehy A, Coursin D: Glucose control in the intensive
care unit. Crit Care Med 2009, 37:1-8.
41. Krinsley JS, Grover A: Severe hypoglycemia in critically ill
patients: risk factors and outcomes. Crit Care Med 2007,
35:2262-2267.