Báo cáo y học: "Correction: End-expiratory lung volume during mechanical ventilation: a comparison with reference values and the effect of positive end-expiratory pressure in intensive care unit patients with different lung conditions" pdf
Bạn đang xem bản rút gọn của tài liệu. Xem và tải ngay bản đầy đủ của tài liệu tại đây (247.92 KB, 2 trang )
Available online />Page 1 of 2
(page number not for citation purposes)
Following the publication of our article [1] we noticed that
three of the figures were incorrectly numbered and positioned
with respect to the figure legends.
The complete set of correct figures (Figure 1, 2, 3 and 4)
follows below. Figures 2, 3 and 4 appeared incorrectly in the
original article.
Reference
1. Bikker IG, van Bommel J, Reis Miranda D, Bakker J and Gommers
D: End-expiratory lung volume during mechanical ventilation:
a comparison with reference values and the effect of positive
end-expiratory pressure in intensive care unit patients with
different lung conditions. Crit Care 2008, 12:R145.
Correction
Correction: End-expiratory lung volume during mechanical
ventilation: a comparison with reference values and the effect of
positive end-expiratory pressure in intensive care unit patients
with different lung conditions
Ido G Bikker, Jasper van Bommel, Dinis Reis Miranda, Jan Bakker and Diederik Gommers
Department of Intensive Care Medicine, Erasmus MC, ‘s Gravendijkwal 230, 3015 CE Rotterdam, The Netherlands
Corresponding author: Diederik Gommers,
Published: 15 December 2009 Critical Care 2009, 13:430 (doi:10.1186/cc8196)
This article is online at />© 2009 BioMed Central Ltd
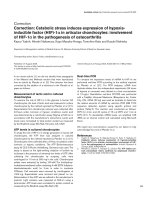
Figure 1
Progression of EELV in individual patients over three stepwise
reductions in PEEP. Mean EELV values at each PEEP level are
presented as black dots. Patients are divided according to the type of
lung condition. Patients in group N had normal lungs, those in group P
had a primary lung disorder, and those in group S had a secondary
lung disorder. EELV, end-expiratory lung volume; PBW, predicted body
weight; PEEP, positive end-expiratory pressure.
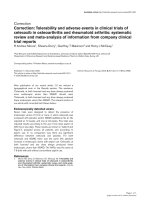
Figure 2
Measured EELV as percentage of predicted sitting FRC at three PEEP
levels. The black dotted line represent predicted sitting FRC (100%).
Patients in group N had normal lungs, those in group P had a primary
lung disorder, and those in group S had a secondary lung disorder.
Values are expressed as mean ± standard deviation. EELV, end-
expiratory lung volume; FiO
2
, inspired oxygen fraction; FRC, functional
residual capacity; Pao
2
, arterial oxygen tension; PEEP, positive end-
expiratory pressure.
Critical Care Vol 13 No 6 Bikker et al.
Page 2 of 2
(page number not for citation purposes)
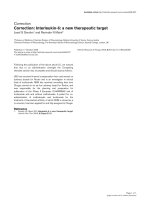
Figure 4
Correlation between change in EELV and change in dynamic compliance. Data are presented as the difference between the lowest PEEP level
(5 cmH
2
O) and 10 or 15 cmH
2
O PEEP. Patients in group N had normal lungs, those in group P had a primary lung disorder, and those in group S
had a secondary lung disorder. EELV, end-expiratory lung volume; PEEP, positive end-expiratory pressure.
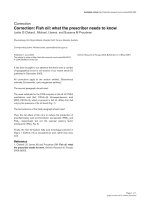
Figure 3
Pao
2
/Fio
2
ratio in different types of lung conditions at three PEEP
levels. Patients in group N had normal lungs, those in group P had a
primary lung disorder, and those in group S had a secondary lung
disorder. Values are expressed as mean ± standard deviation. EELV,
end-expiratory lung volume; FiO
2
, inspired oxygen fraction; Pao
2
,
arterial oxygen tension; PBW, predicted body weight; PEEP, positive
end-expiratory pressure.