Báo cáo y học: "Intensive insulin treatment improves forearm blood flow in critically ill patients: a randomized parallel design clinical trial" ppsx
Bạn đang xem bản rút gọn của tài liệu. Xem và tải ngay bản đầy đủ của tài liệu tại đây (169.76 KB, 9 trang )
Open Access
Available online />Page 1 of 9
(page number not for citation purposes)
Vol 13 No 6
Research
Intensive insulin treatment improves forearm blood flow in
critically ill patients: a randomized parallel design clinical trial
Ivan Žuran
1
, Pavel Poredoš
2
, Rafael Skale
3
, Gorazd Voga
3
, Lucija Gabrš.ek
3
and Roman Parežnik
3
1
Department of Angiology, Endocrinology and Rheumatology, General Hospital Celje, Oblakova ul. 5, 3000 Celje, Slovenia
2
Clinical Department of Vascular Diseases, University Medical Centre, Ljubljana, Zaloška c. 2, 1000 Ljubljana, Slovenia
3
Department of Intensive Internal Medicine, General Hospital Celje, Oblakova ul. 5, 3000 Celje, Slovenia
Corresponding author: Ivan Žuran,
Received: 30 Jul 2009 Revisions requested: 2 Sep 2009 Revisions received: 8 Oct 2009 Accepted: 9 Dec 2009 Published: 9 Dec 2009
Critical Care 2009, 13:R198 (doi:10.1186/cc8202)
This article is online at: />© 2009 Žuran et al.; licensee BioMed Central Ltd.
This is an open access article distributed under the terms of the Creative Commons Attribution License ( />),
which permits unrestricted use, distribution, and reproduction in any medium, provided the original work is properly cited.
Abstract
Introduction Intensive insulin treatment of critically ill patients
was seen as a promising method of treatment, though recent
studies showed that reducing the blood glucose level below 6
mmol/l had a detrimental outcome. The mechanisms of the
effects of insulin in the critically ill are not completely
understood. The purpose of the study was to test the hypothesis
that intensive insulin treatment may influence forearm blood flow
independently of global hemodynamic indicators.
Methods The study encompassed 29 patients of both sexes
who were admitted to the intensive care unit due to sepsis and
required artificial ventilation as the result of acute respiratory
failure. 14 patients were randomly selected for intensive insulin
treatment (Group 1; blood glucose concentration 4.4-6.1 mmol/
l), and 15 were selected for conventional insulin treatment
(Group 2; blood glucose level 7.0 mmol/l-11.0 mmol/l). At the
start of the study (t
0
, beginning up to 48 hours after admittance
and the commencement of artificial ventilation), at 2 hours (t
1
),
24 hours (t
2
), and 72 hours (t
3
) flow in the forearm was
measured for 60 minutes using the strain-gauge
plethysmography method. Student's t-test of independent
samples was used for comparisons between the two groups,
and Mann-Whitney's U-test where appropriate. Linear
regression analysis and the Pearson correlation coefficient were
used to determine the levels of correlation.
Results The difference in 60-minute forearm flow at the start of
the study (t
0
) was not statistically significant between groups,
while at t
2
and t
3
significantly higher values were recorded in
Group 1 (t
2
; Group 1: 420.6 ± 188.8 ml/100 ml tissue; Group
2: 266.1 ± 122.2 ml/100 ml tissue (95% CI 30.9-278.0, P =
0.02); t
3
; Group 1: 369.9 ± 150.3 ml/100 ml tissue; Group 2:
272.6 ± 85.7 ml/100 ml tissue (95% CI 5.4-190.0, P = 0.04).
At t
1
a trend towards significantly higher values in Group 1 was
noted (P = 0.05). The level of forearm flow was related to the
amount of insulin infusion (r = 0.40).
Conclusions Compared to standard treatment, intensive insulin
treatment of critically ill patients increases forearm flow. Flow
increase was weakly related to the insulin dose, though not to
blood glucose concentration.
Trial Registration Trial number: ISRCTN39026810.
Introduction
Stress-induced hyperglycemia is a relatively common condi-
tion in patients admitted to intensive care units. It occurs in
almost all patients with diabetes, as well as in patients with
previously normal glucose metabolism [1]. Hyperglycemia
(defined as a fasting plasma glucose >11.0 mmol/l) results
from a reaction to a tissue injury or infection [2]. To date, the
goal of hyperglycemia treatment has focused on maintaining
glucose levels between 8.8 and 11.0 mmol/l. However, in a
prospective, randomized, controlled study, it was shown that
intensive insulin treatment maintaining glucose levels below
6.1 mmol/l significantly reduces both the mortality and the
morbidity in critically ill patients in the surgical intensive care
unit [3]. In another study of medical critically ill patients, mor-
bidity but not mortality was reduced by intensive insulin treat-
ment [4].
APACHE: Acute Physiology and Chronic Health Evaluation; CI: confidence interval; eNOS: endothelial nitric oxide synthase; HbA
1
c: glycated hae-
moglobin.
Critical Care Vol 13 No 6 Žuran et al.
Page 2 of 9
(page number not for citation purposes)
Recent data, however, indicate that intensive insulin therapy
does not have a beneficial effect in critically ill patients and that
it increases the risk of serious adverse events related to
hypoglycemia; in the Normoglycemia in Intensive Care Evalua-
tion-Survival Using Glucose Algorithm Regulation (NICE-
SUGAR) study it was found that intensive glucose control
increases mortality among patients treated in the intensive
care unit [5,6]. Therefore, there is no definite answer of
whether intensive glucose control has a long-term beneficial
effect on the survival of critically ill patients, and the effect of
insulin in these patients is not clearly understood. Most likely,
insulin has different effects, and, among other factors, these
effects are probably due to the improvement of vasodilation in
peripheral circulation based on increased activity of the
endothelial nitric oxide synthase (eNOS) [7].
The purpose of this study was to investigate if intensive insulin
treatment in critically ill ventilated patients causes a change in
forearm flow, and what is the relation between the forearm flow
and the blood glucose concentration.
Materials and methods
The study was conducted on patients admitted to the Depart-
ment of Intensive Internal Medicine, General Hospital Celje,
Slovenia, between January 2005 and December 2006. We
included those critically ill patients who met the criteria for
severe sepsis with acute respiratory failure requiring artificial
ventilation. The following criteria for severe sepsis were con-
sidered: body temperature above 38°C or below 36°C, heart
rate over 90 bpm, respiratory rate over 20 breaths/min or par-
tial pressure of arterial carbon dioxide below 32 mmHg, leuko-
cyte count over 12.0 × 10
9
/l or below 4.0 × 10
9
/l [8]. Those
patients were included who met at least two criteria of sepsis.
No diabetic patients were included in the study. Patients
requiring artificial ventilation due to primary failure of respira-
tory muscles and those who required artificial ventilation due
to brain injury were also excluded. Prior to inclusion, the
patients' legal representatives signed written consent for par-
ticipation in the study. The patients were randomized into two
groups as regards the regulation of blood glucose: intensive
(Group 1) and conventional (Group 2). In the conventional
protocol the blood glucose concentration was maintained
within the range of 7.0 to 11.0 mmol/l, while in the intensive
protocol the concentration was maintained within the range of
4.4 to 6.1 mmol/l. The lower level (7 mmol/l) in patients receiv-
ing the conventional protocol was selected as per the pro-
posal by the supervisory committee, because the
recommendations at that time favoured blood glucose levels
less than 8.3 mmol/l [9]. In a 50 ml syringe, 50 IU of human
insulin for intravenous administration was diluted in a 0.9%
solution of sodium chloride. The amount of infusion was
adjusted according to the values of blood glucose concentra-
tions in conformity with a previously published protocol [10].
The blood glucose concentration was determined hourly using
the hexokinase method at the beginning of insulin treatment,
and every two hours thereafter, except when the dose of insu-
lin was adjusted; in this case, the next measurement was taken
after one hour. The treatment was initiated within 48 hours of
the start of artificial ventilation. Up to that point, the blood glu-
cose concentrations were maintained in the 8.8 to 11.0 mmol/
l range by means of subcutaneous administration of rapid-act-
ing insulin or the infusion described above.
Hypoglycemia, a possible adverse event occurring during
insulin treatment, was defined as a decrease in blood glucose
concentration to values below 2.2 mmol/l, and was suspected
in cases where the patient suffered sudden perspiration, con-
vulsions, and change in heart rate or blood pressure. In these
cases, administration of insulin was interrupted and blood was
taken to determine the glucose levels. In addition, we per-
formed a bedside test to determine the glucose values. If the
blood glucose values were found to be below 2.2 mmol/l, we
terminated the insulin infusion and the patient was intrave-
nously administered 25 g of glucose in the form of a 50% solu-
tion.
All patients were continuously subjected to hemodynamic
monitoring with the following measurements: continuous mon-
itoring of the electrocardiography curve, and invasive
measurement of arterial and central venous pressure. Cardiac
output was continuously monitored by means of the thermodi-
lution method (Edwards Lifesciences, Vigilance, Irvine, CA,
USA).
Any additional monitoring was introduced by the principal phy-
sician, depending on the patient's clinical status.
The severity of the patients' clinical status was assessed by
means of the Acute Physiology and Chronic Health Evaluation
(APACHE) II score system routinely used for all patients
treated at the department [11,12]. All patients were artificially
ventilated with a Siemens Servo ventilator 300 set (Danvers,
MA, USA) to pressure regulated volume control with a tidal
volume of 5 to 7 ml/kg.
The patients were given food using a nasogastric tube as soon
as possible, mostly after the initial 12-hour volume resuscita-
tion. The food was administered between 6 a.m. and 10 p.m.
During the overnight break in feeding the insulin dose was
halved regardless of the insulin treatment protocol. Patients
who did not tolerate enteral feeding received food in the form
of a parenteral infusion of nutrients, and the insulin dose was
adjusted based on the blood glucose levels.
The study was approved by the State Ethics Committee.
Strain-gauge plethysmography
Measurements of forearm flow were performed by means of a
plethysmograph (model EC5R, D.E. Hokanson, Inc., Bellevue,
WA, USA). A detailed test procedure is described elsewhere
Available online />Page 3 of 9
(page number not for citation purposes)
[13,14]. Briefly, the patient was in a supine position with the
upper body lifted by approximately 15°C. The forearm was
positioned in the level of the right atrium (at 3/5 chest height).
A 10 cm wide cuff was placed on the forearm and connected
to the rapid cuff inflator. A mercury-filled clamp with a circum-
ference 1.5 to 2 cm smaller than the forearm circumference
was placed on the widest part of the forearm. A second 8 cm
wide cuff was placed just above the wrist in order to block
arterial inflow to the thermoregulatory area, in our case the
hand. The upper arm cuff pressure was preset to 50 mmHg.
After 10 seconds of inflation the cuff was deflated for five sec-
onds. Prior to the measurement, the wrist cuff was inflated to
the value 40 mmHg above the systolic pressure for the dura-
tion of a single measurement (approximately one minute). The
plethysmographic curve was recorded and measurement was
repeated every 10 minutes, with each individual measurement
lasting one hour.
The instantaneous arterial flow was calculated manually by
analysing the plethysmographic recording.
The values of the instantaneous arterial flow were expressed
as ml/100 ml of tissue/min. To estimate the total forearm flow,
the area under the 60-minute arterial flow curve was calcu-
lated. All arterial flow measurements were taken at the begin-
ning of the study (t
0
), after 2 hours (t
1
), after 24 hours (t
2
), and
after 72 hours (t
3
) between 8 a.m. and 9 a.m., with the excep-
tion of insulin infusion measurements, which were taken
between 11 a.m. and 12 p.m.
Laboratory tests
To determine blood glucose levels, blood was taken from an
arterial catheter for hemodynamic monitoring every hour at the
beginning of the study, and every two hours thereafter if the
insulin infusion was not changed. Exceptionally, if hypoglyc-
emia was suspected, a bedside test was performed to deter-
mine the glucose level from capillary blood; the test was
always verified by collecting arterial blood. Serum glucose was
determined on the Roche Modular (Hitachi Ltd, Tokyo, Japan)
apparatus using the hexokinase method.
Statistical model
The study was designed as a prospective, randomized, parallel
study. Student's t-test of independent samples was used for
comparisons between the two groups. Blood glucose concen-
trations showed a deviation from normal distribution; in this
case, consequently, the comparisons between the groups
were made using Mann-Whitney test. To compare categorical
values, either the chi-squared test or Fisher's exact test was
used, according to appropriateness. To calculate statistical
differences in flows between the two groups of patients, the
area under the flow curve during the one-hour measurement
was considered as an individual piece of data. The area was
calculated using the trapezoid rule [15].
The sample size was estimated at 30 patients based on find-
ings from previously published data and on the basis of results
from our own pilot study [16]. The data are expressed here as
mean value ± standard deviation or, in the case of abnormal
distribution, as the median, interquartile range or range
between the minimum and maximum value. Linear regression
analysis and the Pearson correlation coefficient were used to
determine the levels of correlation. The value P < 0.05 was
deemed as a statistically significant difference. Statistical cal-
culations were carried out using the programme SPSS for
Windows 10.0 (Chicago, Il, USA).
Results
Patient data
Twenty-nine patients were included in the study, 18 male and
11 female. 15 patients were randomly selected for conven-
tional insulin treatment, and 14 were selected for intensive
insulin treatment. The average age in the group of patients
receiving intensive insulin treatment (Group 1) was 57.1 years
(± 14.8), while in the group receiving conventional treatment
(Group 2) the average age was 58.5 years (± 14.3) (P =
0.79). Group 1 consisted of 8 male and 6 female patients, and
Group 2 consisted of 10 male and 5 female patients (P =
0.71). All the patients completed the study. In one patient, the
arterial flow could not be measured after 24 hours because
the patient could not be sufficiently sedated. One patient who
had already been included in the study was excluded after 24
hours due to early completion of the treatment; this individual
was replaced by another patient. Randomization was repeated
for this patient. A comparison between the groups with
respect to sex, age, initial serum glucose value and glycated
haemoglobin (HbA
1
c) value and APACHE II shows that the
groups did not differ according to these indicators (P = 0.70
and 0.48, respectively; Table 1)
The reasons and leading diagnoses for the patients' hospitali-
sation in Group 1 were: pneumonia in six patients, septic
shock in four patients, and meningococcal meningitis in one
patient. In Group 2, nine patients suffered from pneumonia,
four from septic shock, and two from acute pancreatitis.
Table 1
Demographic and physiological data of the two groups of
patients
Variable Group 1 Group 2 P value
Age (years) 57.1 ± 14.8 58.5 ± 14.3 0.79
Sex (male/female) 8/6 10/5 0.71
BMI (kg/m
2
) 31.1 ± 5.6 29.3 ± 3.7 0.31
HbA1c (%) 6.4 ± 0.7 6.5 ± 1.1 0.70
APACHE II (score) 21.4 ± 5.8 23.2 ± 5.6 0.48
The data are presented as mean values ± standard deviation.
APACHE = Acute Physiology and Chronic Health Evaluation; BMI =
body mass index; HbA1C = glycated haemoglobin level.
Critical Care Vol 13 No 6 Žuran et al.
Page 4 of 9
(page number not for citation purposes)
Hemodynamic data at the time of admission and after
12-hour volume resuscitation
Immediately after admission the patients underwent volume
resuscitation. Table 2 indicates the predominant use of a crys-
talloid infusion, that is a 0.9% solution of sodium chloride,
which is a standard type of crystalloid used in our institution.
The patients were also administered hydroxyethyl starch,
although in significantly smaller doses. As the table shows,
there was no difference between the two groups with respect
to output data, type of volume treatment or hemodynamic
response after 12 hours (Table 2).
Hemodynamic monitoring of patients during the insulin
treatment protocol
Table 3 shows key hemodynamic data and lactate values dur-
ing the study. As is evident from the table, there were no sta-
tistically significant differences between the two groups.
Comparison of both groups with respect to therapeutic
procedures
Table 4 shows a comparison of all therapeutic procedures
throughout the duration of the treatment. As is evident, the only
difference between the groups was the total daily dose of insu-
lin at t
2
. The difference remained significant at t
3
(P < 0.01).
Glucose concentration at different check-ups
Table 5 shows the serum glucose values as well as insulin
dose in Group 1 and Group 2 at individual measurements.
At the beginning of the study, serum glucose concentrations
were lower in Group 2 (P = 0.03). At t
1
, significantly lower lev-
els were recorded in Group 1 as compared with those in
Group 2 (P = 0.01). The difference in concentrations remains
significantly higher in the intensively treated group at t
2
and t
3
(P < 0.01).
For the duration of the study (72 hours) no clinical or labora-
tory signs of hypoglycemia were recorded. The lowest meas-
ured level of serum glucose was 3.8 mmol/l (in a Group 1
patient).
A comparison of insulin doses at individual flow measurements
indicates that at time t
0
the doses were not statistically differ-
ent (P = 0.89), while at times t
1
, t
2
and t
3
Group 1 patients
were administered significantly larger doses (P < 0.01, 0.03,
and 0.03, respectively).
Total arterial flow in the forearm of investigated patients
of both groups at different check-ups
The 60-minute forearm flow at the start of the trial (t
0
) did not
differ between Group 1 and Group 2 (305.0 ± 137.8 ml/100
ml tissue vs. 255 ± 104.2 ml/100 ml tissue; P = 0.28).
Statistically significant higher values in the total 60-minute
arterial flow were found at t
2
and t
3
, while at t
1
only a trend
towards increased flow in the intensively treated group was
indicated (Figure 1). At t
2
, the value of 60-minute arterial flow
was 420.6 ± 188.8 ml/100 ml of tissue in Group 1 and 266.1
± 122.2 ml/100 ml of tissue in Group 2 (95% confidence
interval (CI) = 30.9 to 278.0; P = 0.02), and at t
3
369.9 ±
150.3 ml/100 ml of tissue vs. 272.6 ± 85.7 ml/100 ml of tis-
sue (95% CI = 5.4 to 190.0; P = 0.04).
Table 2
Hemodynamic parameters at the time of admission and after 12 hours of volume resuscitation, type of volume resuscitation in the
initial 12 hours
Time Variable Group 1 Group 2 P value
Admission to intensive care unit Heart rate (beat/min) 128.3 ± 19.4 118.0 ± 22.6 0.29
Mean arterial pressure (mmHg) 65.9 ± 20.9 64.8 ± 21.4 0.91
Central venous pressure (mmHg) 13.0 ± 5.7 12.1 ± 2.7 0.68
Lactate (mmol/l) 3.6 ± 1.9 5.3 ± 3.2 0.18
Postresuscitation (12 hours) Heart rate (beat/min) 105.0 ± 19.7 97.5 ± 16.9 0.28
Mean arterial pressure (mmHg) 85.4 ± 15.9 84.6 ± 12.1 0.90
Central venous pressure (mmHg) 16.1 ± 4.5 16.3 ± 5.7 0.92
Lactate (mmol/l)* 2.6 ± 1.8 1.8 ± 0.7 0.18
Cristalloid infusion (ml/kg/12 hours) 47.3 ± 25.6 49.6 ± 28.7 0.85
Hydroxyethyl starch
Number of patients treated 3 5 0.23
Cumulative dosage (12 hours) 11.5 ± 1.0 13.3 ± 2.1 0.18
Group 1 received intensive treatment and Group 2 received conventional treatment. Values are expressed as mean value ± standard deviation.
* value of lactate is measured 24 hrs after admission to intensive care unit.
Available online />Page 5 of 9
(page number not for citation purposes)
At t
1
a trend towards a significant higher flow in Group 1 was
observed (Group 1: 367.1 ± 192.7 ml/100 ml of tissue;
Group 2: 253.0 ± 90.6 ml/100 ml of tissue; 95% CI = 0.6 to
227.5; P = 0.05).
Interrelationship between blood flow and rate of insulin
infusion
In determining correlations between independent and
dependent variables we made use of linear regression analysis
and Pearson's correlation. Independent variables were
defined as those that were found to influence the dependent
variables such as the 60-minute flow and maximum instantane-
ous forearm flow in previous studies.
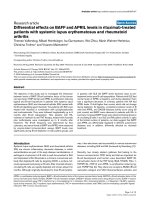
Linear regression analysis confirmed the linear correlation
between the rate of insulin infusion in U/h and the 60-minute
arterial flow. Figure 2 shows that the flow increases in relation
to the insulin infusion (r = 0.40, P < 0.01).
Conversely, no correlation was found between the glucose
concentration and forearm flow (r = -0.054, P = 0.57).
Discussion
To our knowledge, our study was the first to investigate the
influence of intensive insulin treatment on forearm flow in criti-
cally ill, artificially ventilated patients. We found a significant
flow increase 24 and 72 hours after the start of intensive treat-
ment, whereas two hours after the start there was a borderline
increase. With respect to the type of treatment, our groups dif-
fered only in the quantity of insulin administered to the patients
within 24 hours. The initial volume resuscitation was carried
out primarily with a crystalloid infusion, while a comparable
number of patients also received low doses of hydroxyethyl
starch. A recent study showed treatment with this colloid to be
inappropriate due to increased incidence of adverse effects on
the renal function and coagulation, increased need for blood
transfusions, and adverse effects on survival [6]. During the
study there were no differences in global hemodynamic
parameters or in vasoactive norepinephrine treatment. During
our study, no severe hypoglycemia was observed; this fact
contrasts with the most recent studies, which have recorded
6.8% to 17% of severe hypoglycemic incidents [5,6]. The
most probable explanation for the absence of hypoglycemia in
Table 3
Hemodynamic data on patients at the beginning (t
0
), after 2 hours (t
1
), after 24 hours (t
2
)and after 72 hours (t
3
) in both groups of
patients
Time Variable Group 1 Group 2 P value
t
0
Heart rate (beat/min) 109.0 ± 20.5 95.8 ± 20.7 0.16
Mean arterial pressure (mmHg) 87.9 ± 16.1 90.2 ± 12.0 0.66
Central venous pressure (mmHg) 16.6 ± 3.7 15.8 ± 4.2 0.58
Cardiac index (l/min/m
2
) 4.4 ± 1.4 3.9 ± 1.7 0.55
Lactate (mmol/l) 2.6 ± 1.8 1.8 ± 0.7 0.17
t
1
Heart rate (beat/min) 107.0 ± 20.6 93.3 ± 20.4 0.15
Mean arterial pressure (mmHg) 92.0 ± 19.6 88.7 ± 14.2 0.69
Central venous pressure (mmHg) 17.0 ± 4.6 16.2 ± 3.5 0.68
Cardiac index (l/min/m
2
) 4.3 ± 1.6 3.7 ± 0.5 0.39
t
2
Heart rate (beat/min) 98.5 ± 17.5 93.3 ± 15.7 0.41
Mean arterial pressure (mmHg) 85.4 ± 15.9 91.5 ± 12.2 0.25
Central venous pressure (mmHg) 16.9 ± 4.0 14.6 ± 5.4 0.20
Cardiac index (l/min/m
2
) 4.4 ± 1.3 3.9 ± 1.5 0.46
Lactate (mmol/l) 1.8 ± 1.1 1.2 ± 0.5 0.09
t
3
Heart rate (beat/min) 97.1 ± 18.2 96.7 ± 19.5 0.95
Mean arterial pressure (mmHg) 95.1 19.5 95.0 ± 19.6 0.99
Central venous pressure (mmHg) 13.3 ± 5.3 12.1 ± 4.5 0.49
Cardiac index (l/min/m
2
) 4.6 ± 1.4 3.9 ± 1.0 0.25
Lactate (mmol/l) 1.6 ± 1.1 1.0 ± 0.4 0.19
Group 1 received intensive treatment and Group 2 received conventional treatment. Vales are expressed as mean ± standard deviation.
Critical Care Vol 13 No 6 Žuran et al.
Page 6 of 9
(page number not for citation purposes)
our study is the relatively small sample of patients and the
short period of intensive insulin treatment in comparison to
other studies. The flow was in a linear, although weak, interre-
lationship with the rate of the insulin infusion. Conversely, our
study did not confirm the interrelationship between the glu-
cose concentration and forearm flow, which cannot be defini-
tively explained. In another study the influence of intraarterial
insulin infusion on protein synthesis in skeletal muscles in the
legs was investigated in patients with burns [16]. In addition to
the increased utilization of amino acids, they also found that
the flow in the legs increased significantly.
The increase of blood flow could be related to the improve-
ment of endothelial function.
The influence of insulin on the endothelial function has been
studied extensively and it has been shown that the influence
appears through the activation of eNOS [17-19]. The flow in
skeletal muscles increases in two phases: first the dilatation of
terminal arterioles triggers capillary recruitment within minutes,
and in the second phase larger arteries dilate and the flow
increases, the effect reaching its peak after two hours [20,21].
In sepsis, the stimulation of eNOS is inhibited and conse-
quently the response of the endothelium on the insulin is lim-
ited [22]. In our study there was a nonsignificant increase in
blood flow two hours after the start of the treatment. This could
be a result of a delayed response, especially of large arteries,
to the insulin infusion.
Our study indicates that insulin treatment improves skeletal
muscle blood flow. The weak linear relation between the
amount of the infused insulin and forearm flow in our study
indicates that the regulation of the flow through skeletal mus-
cles has been preserved and that it may be increased by
means of therapeutic procedures such as insulin infusion. This
presumption is in agreement with findings of Van den Berghe
Table 4
Comparison of Groups 1 and 2 (intensive vs. conventional protocol) with respect to key therapeutic procedures
Type of treatment Group 1 Group 2 P-value
Ventilatory support
FiO
2
0.5 ± 0.2 0.4 ± 0.1 0.25
PEEP(cmH
2
O) 7.5 ± 1.5 9.0 ± 3.6 0.54
Nutritional support
Total daily caloric intake (kcal/kg/day) 19.5 ± 3.4 23.7 ± 8.1 0.14
Carbohydrate caloric intake (kcal/kg/day) 9.7 ± 4.1 10.9 ± 4.9 0.56
Enteral nutrition
Number of patients (%) 9 (64) 10 (66) 0.70
Enterak daily caloric intake (kcal/kg/day) 11.3 ± 7.4 17.3 ± 6.4 0.11
Hemodynamic support (norepinephrine infusion)
Number of patients treated 8 5 0.27
norepinephrine infusion rate (μg/kg/min) 0.3 ± 0.2 0.4 ± 0.2 0.43
Antibiotics*
Number of patients treated 14 15 1.0
Insulin infusion (U/day) 140.7 ± 56.3 67.2 ± 44.9 < 0.01
Corticosteroid treatment (methylprednisolone)
Number of patients treated 10 7 0.47
methylprednisolone dosage (mg/day) 160 ± 84 200 ± 0 0.27
Hemodialysis
Number of patients 2 1 0.60
Blood transfusion
Number of patients 1 1 0.62
The numerical data refers to the period 24 hours following the start of insulin treatment. The number of patients receiving antibiotics, hemodialysis
and blood transfusion applies to the entire duration of the treatment.
FiO2 = fraction of inspired oxygen; PEEP = positive end-expiratory pressure
* treatment with at least one antibiotic is taken into account
Available online />Page 7 of 9
(page number not for citation purposes)
and colleagues, who showed that intensive insulin treatment
significantly reduces the mortality and morbidity of critically ill
patients [3,4]. However, recent data mitigate the positive
effects of intensive insulin treatment of critically ill patients or
suggest that a goal of normoglycemia does not necessarily
benefit critically ill patients and may be harmful (the NICE-
SUGAR study) [5]. These findings could mean that increased
blood flow in the forearm is not an indicator of improvement of
all perfusion (especially vital organs) in critically ill patients, but
can be an indicator of the re-distribution of blood flow. The dif-
ferent findings in our study in comparison to the NICE-SUGAR
study could also be a consequence of the duration of the fol-
low-up period. In our study, we only followed patients for 72
hours. One possible explanation, thus, is that intensive glu-
cose control has time-limited positive homodynamic effects
(up to some days), and that afterward the positive effects of
intensive insulin treatment are concealed by a higher compli-
cation rate related to adverse events, especially hypoglycemia.
Table 5
Serum glucose concentrations at the beginning (t
0
), after 2 hours (t
1
), after 24 hours (t
2
), and after 72 hours (t
3
) in both groups of
patients and simultaneous insulin doses expressed in U/h
Time Variable Group 1 Group 2 P-value
t
0
Serum glucose level (mmol/l) 9.4
(6.7-13.6)
8.8
(4.6-21.0)
0.03
Insulin infusion (U/h) 4.0 ± 3.2 3.8 ± 3.2 0.89
t
1
Serum glucose level (mmol/l) 6.8
(4.3-9.4)
8.3
(4.3-19.4)
0.01
Insulin infusion (U/h) 9.7 ± 3.6 3.6 ± 2.7 < 0.01
t
2
Serum glucose level (mmol/l) 6.0
(3.9-8.7)
7.9
(5.5-12.1)
< 0.01
Insulin infusion (U/h) 6.2 ± 3.3 3.4 ± 3.4 0.03
t
3
Serum glucose level (mmol/l) 5.2
(3.7-11.4)
7.6
(4.6-11.3)
< 0.01
Insulin infusion (U/h) 4.9 ± 3.7 2.2 ± 2.7 0.03
The data are shown as medians and interquartile ranges or mean ± standard deviation.
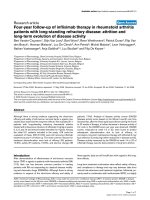
Figure 1
Total 60-minute blood flow in the forearm at the beginning (t
0
), after 2 hours (t
1
), after 24 hours (t
2
), and after 72 hours (t
3
) in both groups of patientsTotal 60-minute blood flow in the forearm at the beginning (t
0
), after 2
hours (t
1
), after 24 hours (t
2
), and after 72 hours (t
3
) in both groups of
patients. Values are shown as medians (horizontal bars inside the box)
with the 25th and 75th percentile (upper and lower frame of the box)
and the 5th and 95th percentile (bars). # P = 0.28, ## P = 0.05, * P =
0.02, ** P = 0.04.
Figure 2
Interrelationship between the insulin infusion rate and the total 60-minute arterial flowInterrelationship between the insulin infusion rate and the total 60-
minute arterial flow.
Critical Care Vol 13 No 6 Žuran et al.
Page 8 of 9
(page number not for citation purposes)
There are some limitations to our study: the sample of patients
was relatively small and the study was not completely blind;
following randomization, the patients' principal physicians and
nursing staff were informed of the type of insulin treatment pro-
tocol. During flow measurements, bias was minimised by cod-
ing the plethysmographic recordings and independent
calculations of flow measurements.
Conclusions
Compared with conventional treatment, the intensive treat-
ment of critically ill patients with insulin results in increased
arterial flow in the forearm. An increase in blood flow was indi-
cated in the group of intensively treated patients after two
hours, and became significantly greater after 24 hours and 72
hours. The increase of blood flow in the forearm is in a weak
linear relationship to the rate of insulin infusion, although no
relation with the glucose concentration was found. Based on
our findings, it may be concluded that a certain increase in flow
may be reached with insulin doses, which do not cause a dra-
matic reduction in blood glucose values below the acceptable
level. Further research is required to determine long-term
effects of the increase in blood flow in muscles during inten-
sive insulin treatment of critically ill patients.
Competing interests
The authors declare that they have no competing interests.
Authors' contributions
IŽ conceived the study, participated in the design of the study,
coordinated the study implementation, drafted the manuscript,
and participated in statistical analysis. PP participated in the
design of the study, supervised the study, and helped to draft
the manuscript. RS participated in the design of the study, per-
formed randomization of the patients, and participated in
implementation of the study. GV participated in the design of
the study, and participated in the implementation of the study.
LG and RP participated in implementation of the study.
Acknowledgements
The authors would like to thank Andrej Janež, PhD., MD, for his construc-
tive input regarding the preparation of the study protocol, Marjan Turk,
B.Sc. (Mathematics) for assistance with statistical calculations, and the
nursing staff of the Department of Intensive Internal Medicine at the
General Hospital Celje for their assistance in the execution of the study.
Dr. Jason Blake proofread the manuscript.
References
1. McCowen K, Malhotra A, Bistrian BR: Stress-induced hypergly-
cemia. Crit Care Clin 2001, 17:107-124.
2. Malhotra A: Intensive insulin in intensive care. N Engl J Med
2006, 354:516-518.
3. Berghe G Van den, Wouters P, Weekers F, Verwaest Ch, Bruyn-
inckx F, Schetz M, Vlasslaers D, Ferdinande P, Lauwers P, Bouillon
R: Intensive insulin therapy in critically ill patients. N Engl J
Med 2001, 345:1359-1367.
4. Berghe G Van den, Wilmer A, Hermans G, Meerseman W, Wout-
ers PJ, Milants I, Van Wijngaerden E, Bobbaers H, Bouillon R:
Intensive insulin therapy in the medical ICU. N Engl J Med
2006, 354:449-461.
5. Finfer S, Chittock R, Yu-Shuo Su S, Blair D, Foster D, Dhingra V,
Bellomo R, Cook D, Dodek P, Henderson WR, Hébert PC, Heritier
S, Heyland DK, McArthur C, McDonald E, Mitchell I, Myburgh JA,
Norton R, Potter J, Robinson BG, Ronco JJ: Intensive versus con-
ventional glucose control in critically ill patients. N Engl J Med
2009, 360:1283-1297.
6. Brunkhorst FM, Engel Ch, Bloos F, Meier-Hellmann A, Ragaller M,
Weiler N, Moerer O, Gruendling M, Oppert M, Grond S, Olthoff D,
Jaschinski U, John S, Rossaint R, Welte T, Schaefer M, Kern P,
Kuhnt E, Kiehntopf M, Hartog Ch, Natanson Ch, Loeffler M, Rein-
hardt K: Intensive insulin therapy and pentastarch resuscita-
tion in severe sepsis. N Engl J Med 2008, 358:125-139.
7. Kim JA, Montagnani M, Koh KK, Quon MJ: Reciprocal relation-
ship between insulin resistance and endothelial dysfunction.
Molecular and pathophysiological mechanisms. Circulation
2006, 113:1888-1904.
8. Bone RC, Balk RA, Cerra FB, Dellinger RP, Fein AM, Knaus WA,
Schein RM, Sibbald WJ: Definitions for sepsis and organ failure
and guidelines for the use of innovative therapies in sepsis.
The ACCP/SCCM Consensus Conference Committee. Ameri-
can College of Chest Physicians/Society of Critical Care Med-
icine. Chest 1992, 101:1644-1655.
9. Dellinger RP, Carlet JM, Masur H, Gerlach H, Calandra T, Cohen
J, Gea-Banacloche J, Keh D, Marshall JC, Parker MM, Ramsay G,
Zimmerman JL, Vincent JL, Levy MM, Surviving sepsis campaign
management guidelines committee: Surviving sepsis campaign
guidelines for management of severe sepsis and septic shock.
Crit Care Med 2004, 32:858-873.
10. Brown G, Dodek P: Intravenous insulin nomogram improves
blood glucose control in the critically ill. Crit Care Med 2001,
29:1714-1719.
11. Knaus WA, Draper EA, Wagner DP, Zimmerman JE: APACHE II: a
severity of disease classification system. Crit Care Med 1985,
13:818-829.
12. Vincent JL, Ferreira F, Moreno R: Scoring systems for assessing
organ dysfunction and survival. Crit Care Clin 2000,
16:353-366.
13. Roddie IC, Wallace WFM: Methods for the assessment of the
effects of drugs on the arterial system in man. Br J Clin Phar-
macol 1979, 7:317-323.
14. Hokanson DE, Sumner D, Strandness DE: An electrically cali-
brated plethysmograph for direct measurement of limb flow.
IEEE Trans Biomed Eng 1975, 22:25-29.
15. Matthews JN, Altman DG, Campbell MJ, Royston P: Analysis of
serial measurements in medical research. BMJ 1990,
300:230-235.
16. Gore DC, Wolf SE, Sanford AP, Herndon DN, Wolfe RR: Extrem-
ity hyperinsulinemia stimulates muscle protein synthesis in
severely injured patients. Am J Physiol Endocrinol Metab 2004,
286:E529-E534.
17. Steinberg HO, Brechtel G, Johnson A, Fineberg N, Baron A: Insu-
lin-mediated skeletal muscle vasodilatation is nitric oxide
Key messages
• Intensive insulin treatment of critically ill patients
improves forearm flow.
• Changes in global hemodynamic indicators do not
affect the increase in flow.
• The increase in flow is in a weak linear correlation with
the insulin dose; however, there is no correlation
between the flow increase and the concentration of glu-
cose in the blood.
• The effect of insulin on the flow is short-term and is
reduced within 72 hours from the start of intensive
treatment.
• The clinical significance of hemodynamic effects of
insulin will have to be evaluated.
Available online />Page 9 of 9
(page number not for citation purposes)
dependent. A novel action of insulin to increase nitric oxide
release. J Clin Invest 1994, 94:1172-1179.
18. Hermann C, Assmus B, Urbich C, Zeiher M, Dimmeler S: Insulin-
mediated stimulation of protein kinase Akt: A potent survival
signalling cascade for endothelial cells. Arterioscler Thromb
Vasc Biol 2000, 20:402-409.
19. Zeng G, Nystrom FH, Ravichandran LV, Cong LN, Kirby M,
Mostowski H, Quon MJ: Roles for insulin receptor, PI3-kinase,
and Akt in insulin-signalling pathways related to production of
nitric oxide in human vascular endothelial cells. Circulation
2000, 101:1539-1545.
20. Zhang L, Richards SM, Clerk LH, Rattigan S, Clark MG, Barrett EJ:
Insulin sensitivity of muscle capillary recruitment in vivo. Dia-
betes 2004, 53:447-453.
21. Vincent MA, Clerk LH, Lindner JR, Klibanov AL, Clark MG, Rattigan
S, Barrett EJ: Microvascular recruitment is an early insulin
effect that regulates skeletal muscle glucose uptake in vivo.
Diabetes 2004, 53:1418-1423.
22. McCowen KC, Ling PR, Ciccarone A, Mao Y, Chow JC, Bistrian
BR, Smith RJ: Sustained endotoxemia leads to marked down-
regulation of early steps in the insulin-signaling cascade. Crit
Care Med 2001, 29:839-846.