Báo cáo y học: "Oxygen consumption is depressed in patients with lactic acidosis due to biguanide intoxication" docx
Bạn đang xem bản rút gọn của tài liệu. Xem và tải ngay bản đầy đủ của tài liệu tại đây (1.41 MB, 9 trang )
Protti et al. Critical Care 2010, 14:R22
/>Open Access
RESEARCH
© 2010 Protti et al.; licensee BioMed Central Ltd. This is an open access article distributed under the terms of the Creative Commons
Attribution License ( which permits unrestricted use, distribution, and reproduction in
any medium, provided the original work is properly cited.
Research
Oxygen consumption is depressed in patients with
lactic acidosis due to biguanide intoxication
Alessandro Protti*
1
, Riccarda Russo
1
, Paola Tagliabue
2
, Sarah Vecchio
3
, Mervyn Singer
4
, Alain Rudiger
5
, Giuseppe Foti
2
,
Anna Rossi
6
, Giovanni Mistraletti
7
and Luciano Gattinoni
1
Abstract
Introduction: Lactic acidosis can develop during biguanide (metformin and phenformin) intoxication, possibly as a
consequence of mitochondrial dysfunction. To verify this hypothesis, we investigated whether body oxygen
consumption (VO
2
), that primarily depends on mitochondrial respiration, is depressed in patients with biguanide
intoxication.
Methods: Multicentre retrospective analysis of data collected from 24 patients with lactic acidosis (pH 6.93 ± 0.20;
lactate 18 ± 6 mM at hospital admission) due to metformin (n = 23) or phenformin (n = 1) intoxication. In 11 patients,
VO
2
was computed as the product of simultaneously recorded arterio-venous difference in O
2
content [C(a-v)O
2
] and
cardiac index (CI). In 13 additional cases, C(a-v)O
2
, but not CI, was available.
Results: On day 1, VO
2
was markedly depressed (67 ± 28 ml/min/m
2
) despite a normal CI (3.4 ± 1.2 L/min/m
2
). C(a-v)O
2
was abnormally low in both patients either with (2.0 ± 1.0 ml O
2
/100 ml) or without (2.5 ± 1.1 ml O
2
/100 ml) CI (and
VO
2
) monitoring. Clearance of the accumulated drug was associated with the resolution of lactic acidosis and a parallel
increase in VO
2
(P < 0.001) and C(a-v)O
2
(P < 0.05). Plasma lactate and VO
2
were inversely correlated (R
2
0.43; P < 0.001, n
= 32).
Conclusions: VO
2
is abnormally low in patients with lactic acidosis due to biguanide intoxication. This finding is in line
with the hypothesis of inhibited mitochondrial respiration and consequent hyperlactatemia.
Introduction
Metformin and phenformin are oral anti-diabetic drugs of
the biguanide class. Metformin is the first-line drug of
choice for the treatment of adults with type 2 diabetes [1]. It
is the 10
th
most frequently prescribed generic drug in the
USA (>40 million prescriptions in 2008) and is currently
used by almost one-third of diabetic patients in Italy [2,3].
Phenformin is no longer on sale in many countries, but is
still available in Italy.
Lactic acidosis can develop in patients taking metformin
or phenformin, especially when renal failure leads to drug
accumulation [4-6]. According to the American Association
of Poison Control Centers, metformin was implicated in 19
fatalities in the USA in 2007 [7]. Thirty cases of biguanide
intoxication have been reported over the past two years to
the Poison Control Centre of Pavia, Italy, resulting in 10
deaths (Dr Sarah Vecchio, unpublished data). The progres-
sive increase in metformin use (20% rise in prescriptions
between 2006 and 2008 in the USA) may result in a parallel
increase in the incidence of associated lactic acidosis [2,8].
The pathogenesis of biguanide-associated lactic acidosis
remains unclear, especially when it develops in the absence
of other major risk factors such as hypoxia, tissue hypoper-
fusion, or liver failure (biguanide-induced lactic acidosis).
Hyperlactatemia is classically attributed to an impaired lac-
tate clearance, secondary to an exaggerated inhibition of
hepatic gluconeogenesis [9] but may also depend on an
increased lactate production by the liver [10] or the intes-
tine [11].
Biguanide drugs mainly exert their therapeutic effect by
impairing hepatocyte mitochondrial respiration [12,13].
Recent observations have suggested that metformin, simi-
larly to phenformin, might also inhibit mitochondrial respi-
* Correspondence:
1
Fondazione IRCCS Ospedale Maggiore Policlinico, Mangiagalli e Regina Elena
di Milano, Università degli Studi di Milano, Via F. Sforza 35, 20122 Milan, Italy
Protti et al. Critical Care 2010, 14:R22
/>Page 2 of 9
ration in tissues other than the liver [14-16]. Mitochondria
produce energy while consuming oxygen (O
2
) and releasing
carbon dioxide (CO
2
) and heat. When O
2
provision or utili-
zation are compromised, cellular energy production can
partly rely on the extra-mitochondrial anaerobic lactate
generation, that is associated with metabolic acidosis. As
mitochondrial respiration normally accounts for more than
90% of whole body O
2
utilization and CO
2
release, any
defect in mitochondrial metabolism will decrease systemic
O
2
consumption and CO
2
production.
We hypothesize that inhibition of mitochondrial respira-
tion is responsible for the development of lactic acidosis
during metformin or phenformin intoxication. If our
hypothesis is correct, respiration should be abnormally low
regardless of any change in systemic O
2
delivery. The aim
of this study is to investigate global O
2
consumption (and
CO
2
production) in patients with lactic acidosis due to bigu-
anide intoxication.
Materials and methods
We reviewed the data sheets of patients admitted to 12
intensive care units and 1 nephrology unit of 11 hospitals
from January 2005 to June 2009, with a discharge diagnosis
of lactic acidosis due to biguanide intoxication. Patients
with a concomitant primary diagnosis of septic or cardio-
genic shock or liver failure were excluded. Lactic acidosis
was defined as pH less than 7.30 and plasma lactate more
than 5 mM. Only patients with central or mixed venous O
2
saturation monitoring were included.
We calculated the arterio-venous difference in O
2
content
[C(a-v)O
2
] as:
where CaO
2
and CvO
2
are arterial and venous blood O
2
content, respectively, Hb is blood hemoglobin concentra-
tion, SaO
2
is arterial O
2
saturation, SvO
2
is O
2
saturation of
blood taken from the superior vena cava or the pulmonary
artery (collectively indicated as central venous blood) and
PaO
2
and PvO
2
are the arterial and central venous O
2
ten-
sions.
Oxygen extraction index (OEI) was defined as:
and expressed as a percentage. The veno-arterial differ-
ence in CO
2
content [C(v-a)CO
2
] was calculated according
to Douglas and colleagues [17]. In patients with cardiac
index (CI) monitoring, we calculated whole body O
2
deliv-
ery (DO
2
) as CI × CaO
2
and O
2
consumption (VO
2
) as CI ×
C(a-v)O
2
, with CI computed as cardiac output divided by
estimated body surface area. Carbon dioxide production
(VCO
2
) was calculated as CI × C(v-a)CO
2
.
The severity of illness was initially expressed by the Sim-
plified Acute Physiology Score (SAPS) II [18] and then
monitored using the Sequential Organ Failure Assessment
(SOFA) score [19]. The cardiovascular SOFA score was
used to describe catecholamine requirements. Sedation was
evaluated using the Richmond Agitation Sedation Scale
(RASS) [20]. Heart rate, body temperature and need for
mechanical ventilation were also recorded. Analysis was
restricted to the first four days following admission, or until
discharge or death if any of these occurred earlier.
The local Ethics Committee of the coordinating Centre
(Fondazione IRCCS Ospedale Maggiore Policlinico, Man-
giagalli e Regina Elena di Milano, Italy) was informed of
the ongoing retrospective analysis and did not require any
specific informed consent.
Statistical analysis
Results are presented as mean ± standard deviation or
median and interquartile range, based on data distribution
(Kolmogorov-Smirnov test). The relation between serum
metformin levels and other variables was assessed using
linear regression analysis and expressed as R
2
. Severity of
illness at admission of patients with or without CI monitor-
ing was compared using the Student's t-test. The remainder
of the analyses were performed on data averaged on a daily
basis. Changes occurring over time were investigated using
parametric or non-parametric one-way repeated-measures
analysis of variance. Post-hoc comparisons were performed
using Bonferroni or Dunn's test, considering day 1 as base-
line. The relation between the arterio-venous difference in
O
2
content and the veno-arterial difference in CO
2
content
was calculated using linear regression. The relation
between systemic O
2
consumption and other variables was
investigated using linear (arterial pH) or non-linear (body
temperature and plasma lactate) regression. The chi-
squared test was used to assess whether the proportion of
patients requiring mechanical ventilation changed over
time. Analysis was performed using Sigma Stat version
3.1.1 (Jandel Scientific Software; San Jose, CA, USA). A
two-sided P value less than 0.05 was considered as statisti-
cally significant.
Results
We identified 24 diabetic patients admitted to the intensive
care (n = 22) or nephrology (n = 2) units with lactic acidosis
attributed to either metformin (n = 23) or phenformin (n =
1) intoxication (Table 1). Seventeen (71%) were females
and the mean age of all patients was 66 ± 9 years.
Lactic acidosis on hospital admission was always severe,
with an arterial pH of 6.93 ± 0.20 and lactate of 18 ± 6 mM.
Blood glucose level was 118 ± 78 mg/dl, with severe hypo-
glycemia (<40 mg/dl) being present in 3 patients. Liver
CaO CvO Hb SaO PaO
Hb SvO Pv
22 2 2
2
1 39 0 003
1 39 0 003
−=××+×
−×× + ×
(. . )
(. . OO
2
),
()/CaO CvO CaO
22 2
−
Protti et al. Critical Care 2010, 14:R22
/>Page 3 of 9
Table 1: Main characteristics of the study population
Id Intoxicant Serum
drug level
(μg/ml)
Creatinine
(mg/dl)
pH Lactate
(mM)
Monitoring SAPS II ICU
outcome
1 Metformin 70 6.4 7.21 22
CI;
58 S
2 Metformin 63 12.4 6.95 33
CI;
53 S
3 Metformin NA 10.8 6.76 21
CI;
61 S
4 Metformin NA 15.2 7.06 18
CI;
51 S
5Metformin NA 9.0 6.63 21
CI;
55 S
6 Metformin NA 10.3 6.82 21 CI; ScvO
2
87 S
7 Metformin NA 10.8 6.70 24 CI; ScvO
2
74 S
8 Metformin 61 1.9 7.27 10
CI;
83 NS
9 Metformin NA 13.2 6.79 21 CI; ScvO
2
63 S
10 Metformin NA 4.7 7.13 19 CI; ScvO
2
66 S
11 Metformin 53 4.5 <6.80 16
CI;
87 NS
12 Metformin 65 8.4 6.76 22 ScvO
2
43 S
13 Phenformin 480
§
9.5 6.91 13 ScvO
2
59 S
14 Metformin 100 5.8 7.26 10 ScvO
2
58 S
15 Metformin 63 4.2 6.89 18 ScvO
2
53 NS
16 Metformin NA 13.0 6.93 17 ScvO
2
67 S
17 Metformin 19
†
9.9 6.62 19 ScvO
2
62 S
18 Metformin NA 6.1 <6.80 24 ScvO
2
70 NS
19 Metformin 100 7.6 6.87 16 ScvO
2
45 S
20 Metformin 25
†
9.3 6.81 15 ScvO
2
44 S
21* Metformin 70 4.8 7.22 11 ScvO
2
66 S
22* Metformin 44 10.0 6.93 14 ScvO
2
55 S
23 Metformin NA 13.8 7.21 6 ScvO
2
39 S
24 Metformin NA 7.1 6.93 17 ScvO
2
65 NS
The first available serum drug concentration (
§
phenformin in ng/ml;
†
blood sample obtained with ongoing renal replacement therapy),
creatinine level, arterial blood pH and plasma lactate level, available data (CI, cardiac index; ScvO
2
, central venous oxymetry; , mixed
venous oxymetry), severity of the disease (expressed as Simplified Acute Physiology Score (SAPS) II score) and outcome (S = survivor; NS =
non survivor) are reported. Target values in patients on metformin or phenformin are less than 4 μg/ml and less than 140 ng/ml, respectively.
ICU, intensive care unit; NA, not available; * patients admitted to the Nephrology Unit.
SvO
2
SvO
2
SvO
2
SvO
2
SvO
2
SvO
2
SvO
2
SvO
2
function tests were usually normal, with alanine amin-
otransferase 66 ± 78 IU/L, total bilirubin 0.4 ± 0.2 mg/dl,
albumin 33 ± 6 g/L, and prothrombin time (expressed as
international normalized ratio) 1.2 ± 0.3 (excluding two
patients on warfarin). Left ventricular ejection fraction,
investigated in seven patients by echocardiography, was
always normal (≥ 50%).
Intoxication was always accidental and associated with
renal failure (creatinine 8.7 ± 3.5 mg/dl, urea 171 ± 70 mg/
dl and oligo-anuria) and continued drug intake. Factors
potentially implicated in the development of renal failure
Protti et al. Critical Care 2010, 14:R22
/>Page 4 of 9
were dehydration (a history of several days' vomiting and/
or diarrhea was reported in 75% of the cases), urinary tract
infection (29%) and chronic renal dysfunction (21%).
Whenever measured, serum drug concentration on day 1
was always well above safe limits (metformin 61 ± 25 vs.
<4 μg/ml, n = 12; phenformin 480 vs. <140 ng/ml, n = 1).
Metformin levels, measured at different time points in 10
patients, were positively correlated with those of creatinine
(R
2
= 0.34; P < 0.001, n = 29) and lactate (R
2
= 0.49; P <
0.001, n = 29) and inversely correlated with arterial pH (R
2
= 0.68; P < 0.001, n = 29).
Treatment included the use of mechanical ventilation (n =
16), catecholamines (n = 21) and renal replacement therapy
(n = 21). The first day SAPS II score was 61 ± 13, corre-
sponding to an expected mortality of approximately 70%.
Observed mortality was 21%.
Central venous O
2
saturation was monitored through a
central venous (n = 17) or pulmonary artery (n = 7) catheter.
Blood gases were always measured at 37°C. In 11 patients,
CI was also measured, using the PiCCO system (n = 2),
transesophageal Doppler ultrasonography (n = 2) or pulmo-
nary artery catheter thermodilution (n = 7). Patients with CI
monitoring had a higher SAPS II (67 ± 14 vs. 56 ± 10; P <
0.05) and SOFA (12 ± 3 vs. 9 ± 2; P < 0.05) scores on
admission.
Main results are reported in Table 2 and Figures 1 and 2.
Systemic O
2
consumption, monitored in 11 patients, was
abnormally low on day 1 and normalized within the next 48
to 72 hours (P < 0.001), paralleled by resolution of lactic
acidosis (P < 0.001). As systemic O
2
delivery did not signif-
icantly change compared with day 1, variations in whole
body O
2
consumption were reflected in equal changes in
Table 2: Temporal changes observed in 11 biguanide-intoxicated patients with cardiac index and central venous oxygen
saturation monitoring
n Day 1 Day 2 Day 3 Day 4 P
pH 11 7.03
(6.92-7.15)
7.35
(7.25-7.40)
7.44
(7.35-7.46)*
7.46
(7.44-7.47)*
<0.001
Lactate (mM) 11 17 (14-20) 5 (2-15) 2 (2-3)* 1 (1-3)* <0.001
VO
2
(ml/min/m
2
) 9 67 ± 28 99 ± 30* 116 ± 41* 129 ± 42* <0.001
DO
2
(ml/min/m
2
) 9 443 ± 167 572 ± 152 491 ± 95 430 ± 116 <0.01
CI (L/min/m
2
) 9 3.4 ± 1.2 4.4 ± 1.3 3.9 ± 0.8 3.4 ± 1.2 0.08
C(a-v)O
2
(ml O
2
/100 ml)
10 2.0 ± 1.0 2.4 ± 0.8 2.9 ± 0.8* 3.8 ± 1.4* <0.001
SvO
2
(%) 10 83 ± 8 80 ± 6 75 ± 5* 70 ± 8* <0.001
OEI (%) 10 13 (11-19) 16 (13-21) 23 (21-25)* 31 (23-34)* <0.001
C(v-a)CO
2
(ml CO
2
/100 ml)
7 2.2 ± 0.8 2.2 ± 0.8 3.9 ± 1.9 4.7 ± 1.2* <0.05
RASS 11 -4 (-5 2) -4 (-4 1) -2 (-4-0) -1 (-3-0) 0.06
On MV (%) 11 91 100 67 67 0.12
HR 11 103 ± 20 104 ± 8 99 ± 16 97 ± 21 0.74
SOFA 11 12 ± 3 10 ± 1* 9 ± 2* 10 ± 2* <0.001
Catecholamine
use (SOFA sub
score)
11 4 (4-4) 4 (4-4) 4 (4-4) 3 (2-3)* <0.001
BT (°C) 10 34.5 ± 2.2 36.6 ± 0.6* 36.8 ± 0.4* 36.7 ± 0.5* <0.001
Results of repeated-measures analysis of variance and chi-squared test are reported in the right column. Data significantly different from day
1 on post-hoc comparison are indicated as *. n is the number of patients with each specific variable monitored on day 1.BT, body temperature;
C(a-v)O
2
, arterio-venous difference in oxygen content; C(v-a)CO
2
, veno-arterial difference in carbon dioxide content; CI, cardiac index; DO
2
,
systemic oxygen delivery; HR, heart rate; MV, mechanical ventilation; OEI, oxygen extraction index; RASS, Richmond Agitation Sedation Score;
SOFA, Sequential Organ Failure Assessment; SvO
2
, central venous oxygen saturation; VO
2
, systemic oxygen consumption.
Protti et al. Critical Care 2010, 14:R22
/>Page 5 of 9
arterio-venous difference in O
2
content and O
2
extraction
index and opposite changes in central venous O
2
saturation
(P < 0.001 for all). The difference in veno-arterial CO
2
con-
tent was abnormally low on day 1 and progressively
returned to normal (P < 0.05). Whole body CO
2
production
showed a similar, although not significant, trend, rising
from 93 ± 24 (on day 1) to 115 ± 13 ml/min/m
2
(on day 4; n
= 4). The arterio-venous difference in O
2
content was posi-
tively associated with the veno-arterial difference in CO
2
content (R
2
= 0.42; P = 0.001, n = 22). Systemic O
2
con-
sumption was positively associated with arterial pH (R
2
=
0.37; P < 0.001, n = 32) and body temperature (R
2
= 0.38; P
< 0.001, n = 30) and inversely correlated with plasma lac-
tate (R
2
= 0.43; P < 0.001, n = 32).
Major findings remained valid when the analysis was
restricted to the 7 patients monitored with a pulmonary
artery catheter. From day 1 to 4, lactate levels decreased
from 16 (13 to 19) to 1 (1 to 2) mM (P < 0.01). Global O
2
consumption increased (81 ± 21 vs. 129 ± 47 ml/min/m
2
; P
= 0.01) despite no change in systemic O
2
delivery (482 ±
180 vs. 441 ± 139 ml/min/m2; P = 0.10). The arterio-
venous difference in O
2
content (2.3 ± 1.2 vs. 3.9 ± 1.1 ml
O
2
/100 ml; P = 0.001) and the O
2
extraction index (17 ± 7
vs. 30 ± 6%; P < 0.001) augmented and the mixed venous
O
2
saturation accordingly decreased (81 ± 9 vs. 69 ± 6%; P
= 0.001). The difference in veno-arterial CO
2
content
increased from 2.4 ± 0.7 to 4.6 ± 1.5 ml CO
2
/100 ml (P <
0.05). Systemic O
2
consumption inversely correlated with
plasma lactate (R
2
= 0.30; P = 0.01, n = 21).
In patients without CI monitoring, initial values and later
changes in the other variables of interest closely resembled
those observed in monitored patients (Table 3).
Twelve patients had one or more simultaneous determina-
tions of serum metformin levels and arterio-venous differ-
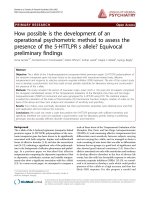
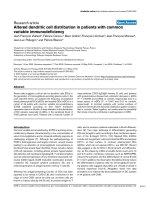
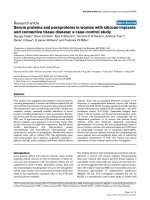
Figure 1 Relation between cardiac index and arterio-venous difference in oxygen content in biguanide-intoxicated patients. Cardiac index
(CI) and arterio-venous difference in oxygen content [C(a-v)O
2
] recorded during the first 4 days of admission from 11 biguanide-intoxicated patients.
Each circle refers to individual data averaged on a daily basis. The arterio-venous difference in oxygen content was computed from either mixed (black
circles) or central (white circles) venous oxygen saturation. Dotted lines refer to the lower and upper limits of normal systemic oxygen consumption
(110 to 160 ml/min/m
2
). Circles that are located under the lower dotted line indicate an arterio-venous difference in oxygen content (oxygen extrac-
tion) lower than expected if systemic oxygen consumption is normal.
C(a-v)O
2
(ml O
2
/100 ml)
CI (L/min/m
2
)CI (L/min/m
2
)
C(a-v)O
2
(ml O
2
/100 ml) C(a-v)O
2
(ml O
2
/100 ml)
CI (L/min/m
2
) CI (L/min/m
2
)
C(a-v)O
2
(ml O
2
/100 ml)
Day 1 Day 2
Day 3 Day 4
Protti et al. Critical Care 2010, 14:R22
/>Page 6 of 9
ence in O
2
content; an inverse correlation was noted
between these variables (R
2
= 0.20; P < 0.05, n = 22).
Discussion
The present study demonstrates that whole body O
2
con-
sumption (and CO
2
production) are abnormally low during
biguanide-induced lactic acidosis and return to normal on
recovery from drug intoxication.
Metformin is a safe drug when correctly prescribed [21].
Lactic acidosis can develop in cases of drug accumulation
but is usually attributed to other concomitant precipitating
factors. However, some reports suggest that metformin
accumulation may cause lactic acidosis even in the absence
of other obvious confounding variables [22]. According to
discharge diagnosis, patients included in this present study
suffered from lactic acidosis (better defined as hyperlac-
tatemia with metabolic acidosis) mainly attributed to (docu-
mented or suspected) metformin or phenformin
intoxication. None of the patients had any sign of acute
liver or cardiac failure. Acute renal failure was invariably
present at hospital admission, but could have hardly repre-
sented the sole cause of such a dramatic rise in blood lactate
levels. Septic shock was never reported as the primary diag-
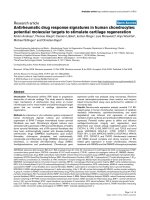
Figure 2 Relation between systemic oxygen consumption and
lactatemia in biguanide-intoxicated patients. Systemic oxygen
consumption (VO
2
), computed from either mixed (black circles) or cen-
tral (white circles) venous oxygen saturation, inversely correlated with
plasma lactate (R
2
= 0.43; P < 0.001; n = 32).
Table 3: Temporal changes observed in 13 biguanide-intoxicated patients with central venous oxygen saturation (but not
cardiac index) monitoring
n Day 1 Day 2 Day 3 Day 4 P
pH 13 7.14 ± 0.17 7.36 ± 0.10* 7.45 ± 0.09* 7.43 ± 0.06* <0.001
Lactate (mM) 13 12 ± 6 5 ± 8* 2 ± 1* 2 ± 1* <0.001
C(a-v)O
2
(ml O
2
/100 ml)
12 2.5 ± 1.1 3.1 ± 1.0 3.4 ± 0.8 4.2 ± 1.2* <0.05
SvO
2
(%) 12 79 ± 10 75 ± 10 73 ± 6* 66 ± 7* 0.01
OEI (%) 12 20 ± 10 24 ± 10 25 ± 7 33 ± 7* 0.01
C(v-a)CO
2
(ml CO
2
/100 ml)
8 2.4 ± 1.6 2.8 ± 1.2 3.6 ± 0.9 5.5 ± 1.9 0.16
RASS 13 -1 (-4-0) 0 (-3-0) 0 (-1-0) -1 (-3-0) 0.05
On MV (%)13314227380.89
HR 12 87 ± 17 88 ± 15 91 ± 14 88 ± 8 0.10
SOFA 13 9 ± 2 8 ± 3 6 ± 3* 7 ± 3* <0.001
Catecholamine
use (SOFA sub
score)
13 3 ± 2 3 ± 2 2 ± 2* 2 ± 2* <0.01
BT (°C) 10 35.8
(35.0-36.3)
36.8
(36.4-37.3)
37.0
(36.7-37.5)*
36.9
(36.6-37.4)
<0.05
Results of repeated-measures analysis of variance and chi-squared test are reported in the right column. Data significantly different from day
1 on post-hoc comparison are indicated as *. n is the number of patients with each specific variable monitored on day 1.
BT, body temperature; C(a-v)O
2
, arterio-venous difference in oxygen content; C(v-a)CO
2
, veno-arterial difference in carbon dioxide content;
HR, heart rate; MV, mechanical ventilation; OEI, oxygen extraction index; RASS, Richmond Agitation Sedation Score; SOFA, Sequential Organ
Failure Assessment; SvO
2
, central venous oxygen saturation.
Protti et al. Critical Care 2010, 14:R22
/>Page 7 of 9
nosis. Sepsis may still have acted as a precipitating factor
(gastroenteritis, urinary tract infection) but could not
explain our present initial findings. Indeed, systemic O
2
consumption is usually normal or even increased in criti-
cally ill septic patients, at least in the early phase [23,24].
The most common cause of lactic acidosis in critically ill
patients is probably cellular hypoxia. When O
2
delivery
acutely decreases due to low cardiac output, anemia or
hypoxemia, tissue O
2
extraction rises in an attempt to pre-
serve aerobic mitochondrial respiration. The arterio-venous
difference in O
2
content, that is the ratio between whole
body O
2
consumption and cardiac output, increases and
central venous O
2
saturation decreases. Oxygen consump-
tion only starts to diminish when O
2
delivery falls below a
critical value; the blood lactate concentration then abruptly
increases, indicating the development of anaerobic metabo-
lism [25]. The veno-arterial difference in CO
2
content, that
depends on the ratio between CO
2
production and cardiac
output, may rise as well, mainly as a consequence of a
reduced cardiac output.
Lactic acidosis can also develop under aerobic condi-
tions, when O
2
utilization is prevented by mitochondrial
dysfunction, glycolysis is overly stimulated or lactate clear-
ance is impaired [26-28]. Growing evidence, mainly
derived from cell and animal studies, suggest that met-
formin and phenformin can actually interfere with mito-
chondrial respiration in a dose-dependent manner [10,12-
14]. By interfering with mitochondrial respiration in the
liver, they decrease gluconeogenesis (and lactate clearance)
and may potentially increase glucose consumption (and lac-
tate production) [10,12,13]. Although the effect on organs
and tissues other than the liver is less clear, metformin can
still diminish mitochondrial respiration and increase glycol-
ysis (and lactate release) in the skeletal muscle [14].
Whether the drug can decrease global O
2
consumption in
either animals or humans remains poorly investigated and
unclear [29-31]. Based on these observations, we hypothe-
size that during metformin or phenformin accumulation, the
inhibition of mitochondrial respiration is so strong that the
production of lactate (by the liver and, probably, other tis-
sues) increases above the residual capacity of the body to
clear it, leading to the development of lactic acidosis.
Our results support this hypothesis. In fact, systemic O
2
consumption, measured in 11 patients, was markedly
depressed in the early phase, when lactic acidosis was more
dramatic, despite a normal, or even increased, O
2
delivery.
This finding may be cautiously extended to 13 additional
patients in whom systemic O
2
consumption could not be
computed, from initial recording of very low values of arte-
rio-venous difference in O
2
content, diminished peripheral
O
2
extraction and increased central venous O
2
saturation.
Similar changes occur after exposure to cyanide, a well-
known inhibitor of mitochondrial respiration [32]. Even if
acidosis was more likely the result of a diminished mito-
chondrial respiration, it might have also contributed to fur-
ther decrease the systemic energy expenditure and O
2
consumption [33]. However, the basal systemic O
2
con-
sumption of 15 critically ill, mechanically ventilated
patients enrolled in a previous trial led by our group, with
an arterial pH below 7.20, was 123 ± 65 ml/min/m
2
[34].
Alterations in O
2
consumption were apparently paralleled
by changes in CO
2
production. Direct measurement of sys-
temic CO
2
production using the reverse Fick equation
requires calculation of the whole blood veno-arterial differ-
ence in CO
2
content. This primarily consists of physically
dissolved CO
2
, bicarbonate ions and carbamino com-
pounds. As whole blood CO
2
content is not routinely mea-
sured, we computed it using an algorithm that includes the
CO
2
tension, pH, hemoglobin concentration and O
2
satura-
tion [17]. Similar to arterio-venous difference in O
2
content,
the initially low difference between venous and arterial CO
2
content is suggestive of diminished CO
2
production.
Previous studies have demonstrated that severity of ill-
ness, use of sedatives and catecholamines, heart rate, body
temperature and mechanical ventilation can all affect rest-
ing energy expenditure [35,36]. Overall, systemic O
2
con-
sumption, arterio-venous difference in O
2
content and veno-
arterial difference in CO
2
content reached their nadir when
severity of illness and use of catecholamines were at their
highest values. Patient awakening occurred slowly, well
after the normalization of O
2
consumption and related vari-
ables. Heart rate and the need for mechanical ventilation
did not significantly change over time. A body temperature
on hospital admission averaging 34 to 35°C cannot, in iso-
lation, explain the observed 40 to 60% reduction in sys-
temic O
2
consumption, because O
2
consumption should
diminish by approximately 5 to 6% for every 1°C fall in
temperature [37,38]. Moreover, the systemic O
2
consump-
tion of 25 critically ill patients, with a body temperature
between 34 to 35°C, was 136 ± 40 ml/min/m
2
[34]. None of
the patients included in the present study had any obvious
reason to be hypothermic on hospital admission: they usu-
ally arrived from home, were awake and with pale, cold
extremities. Hypothermia was more likely the consequence
of the biguanide-induced decrease in metabolic rate. Even
if abnormally low body temperature may impact upon the
interpretation of the blood gas analyses performed at 37°C,
temperature correction is unnecessary to compute the arte-
rio-venous differences in O
2
and CO
2
content [39].
Some of the limitations of this present study deserve a
comment. First, we did not include any control group,
because of the peculiar characteristics of the study popula-
tion. However, every single patient with biguanide intoxica-
Protti et al. Critical Care 2010, 14:R22
/>Page 8 of 9
tion acted as an internal control, with individual recordings
of global O
2
consumption (and CO
2
production) being sig-
nificantly lower on day 1, relative to the following days.
Second, we used the central venous O
2
saturation to com-
pute global O
2
consumption of patients equipped with a car-
diac output monitoring but not a pulmonary artery catheter.
As catecholamine use did not change over time in these
subjects, changes in central venous O
2
saturation (and
derived variables) likely reflected those in mixed venous O
2
saturation. Moreover, when the analysis was restricted to
the 7 patients equipped with a pulmonary artery catheter,
the major findings of the study remained valid. Third, the
respiratory quotient - the ratio between the difference in
CO
2
and O
2
content of simultaneously drawn arterial and
venous blood samples - sometimes exceeded one, an unex-
pected finding, at least at steady state. Possible explanations
include the fact that, in our study population, blood gas
analysis were not performed at steady state and blood CO
2
content was estimated rather than directly measured. We
cannot, however, definitely exclude the occurrence of any
error in blood sampling, gas analysis or data reporting.
Conclusions
Metformin and phenformin intoxication is characterized by
severe lactic acidosis and abnormally low systemic oxygen
consumption despite normal or even increased systemic
oxygen delivery. These findings are consistent with the
hypothesis that biguanide drugs cause lactic acidosis by
inhibiting mitochondrial respiration, without any clear evi-
dence of cellular hypoxia. Cause and effect still needs to be
conclusively demonstrated.
Key messages
• The progressive increase in metformin use may result
in a parallel increase in the incidence of associated lac-
tic acidosis.
• The pathogenesis of biguanide-associated lactic acido-
sis remains unclear, especially when it develops in the
absence of other major risk factors.
• Biguanide intoxication is characterized by severe lac-
tic acidosis and abnormally low systemic O
2
consump-
tion, despite normal or even increased global oxygen
delivery.
• Resolution of drug intoxication is paralleled by cor-
rection of lactic acidosis and normalization of systemic
O
2
consumption.
• These findings are in line with the hypothesis that lac-
tic acidosis develops during metformin or phenformin
intoxication because of inhibition of mitochondrial res-
piration.
Abbreviations
C(a-v)O
2
: arterio-venous difference in oxygen content; C(v-a)CO
2
: veno-arterial
difference in carbon dioxide content; CaO
2
: arterial blood oxygen content;
CvO
2
: venous blood oxygen content; CI: cardiac index; CO
2
: carbon dioxide;
DO
2
: systemic oxygen delivery; O
2
: oxygen; OEI: oxygen extraction index; PaO
2
:
arterial venous oxygen tensions; PvO
2
: central venous oxygen tensions; RASS:
Richmond Agitation Sedation Score; SAPS II: Simplified Acute Physiology Score
II; SaO
2
: arterial oxygen saturation; SOFA: Sequential Organ Failure Assessment;
SvO
2
: central venous oxygen saturation; VCO
2
: systemic carbon dioxide pro-
duction; VO
2
: systemic oxygen consumption.
Competing interests
The authors declare that they have no competing interests.
Authors' contributions
AP conceived the study, participated in its design and coordination, performed
the statistical analysis and drafted the manuscript. RR, PT, and SV participated
in study design and data collection. MS, AR, and GF participated in data collec-
tion, interpretation of data and helped to draft the manuscript. AR participated
in study design and data collection. GM participated in data collection and
helped with statistical analysis. LG participated in study design, interpretation
of data and helped to draft the manuscript. All the authors read and approved
the final manuscript.
Acknowledgements
Preliminary results were presented at the 21
st
Annual Meeting of the European
Society of Intensive Care Medicine (ESICM), held in Lisbon (Portugal) in 2008.
List of participating centers (all in Italy, unless otherwise stated): Centro Nazion-
ale di Informazione Tossicologica, Fondazione IRCCS Salvatore Maugeri, Pavia;
Fondazione IRCCS - Ospedale Maggiore Policlinico, Mangiagalli e Regina Elena,
Milano; Ospedale di Faenza, Ravenna; Ospedale di Manerbio, Brescia; Ospedale
di Sondrio; Ospedale di Vimercate; Ospedale Maggiore di Novara; Ospedale
Maggiore Niguarda, Milano; Ospedale San Gerardo Nuovo dei Tintori, Monza;
Ospedale San Paolo, Milano; University College Hospital, London, UK; Univer-
sity Hospital Zurich, Switzerland.
Author Details
1
Fondazione IRCCS Ospedale Maggiore Policlinico, Mangiagalli e Regina Elena
di Milano, Università degli Studi di Milano, Via F. Sforza 35, 20122 Milan, Italy,
2
Ospedale San Gerardo Nuovo dei Tintori, Università di Milano-Bicocca, Piazza
dell'Ateneo Nuovo 1, 20126, Milan, Italy,
3
Centro Nazionale di Informazione
Tossicologica, Fondazione IRCCS Salvatore Maugeri, Via Maugeri 10, 27100
Pavia, Italy,
4
Bloomsbury Institute of Intensive Care Medicine, University
College London, 5 University Street, London WC1E 6JF, UK,
5
University Hospital
Zurich, Rämistrasse 100, 8091 Zürich, Switzerland,
6
Ospedale Niguarda Ca'
Granda, Piazza Ospedale Maggiore 3, 20162 Milan, Italy and
7
Ospedale San
Paolo, Università degli Studi di Milano, Via A. Di Rudiní 8, 20142 Milan, Italy
References
1. American Diabetes Association: Standards of medical care in diabetes
2008. Diabetes Care 2008, 31 Suppl 1:S12-S54.
2. 2008 Top 200 generic drugs by total prescriptions [http://
drugtopics.modernmedicine.com/drugtopics/data/articlestandard//
drugtopics/222009/599844/article.pdf]
3. L'uso dei Farmaci in Italia. Rapporto Nazionale anno 2007 [http://
www.agenziafarmaco.it/allegati/rapporto_osmed_2007.pdf]
4. Lalau JD, Race JM: Lactic acidosis in metformin-treated patients.
Prognostic value of arterial lactate levels and plasma metformin
concentrations. Drug Saf 1999, 20:377-384.
5. Peters N, Jay N, Barraud D, Cravoisy A, Nace L, Bollaert PE, Gibot S:
Metformin-associated lactic acidosis in an intensive care unit. Crit Care
2008, 12:R149.
6. Seidowsky A, Nseir S, Houdret N, Fourrier F: Metformin-associated lactic
acidosis: a prognostic and therapeutic study. Crit Care Med 2009,
37:2191-2196.
Received: 27 October 2009 Revisions Requested: 23 December 2009
Revised: 9 January 2010 Accepted: 19 February 2010
Published: 19 February 2010
This article is available from: 2010 Protti et al.; licensee BioMed Central Ltd. This is an open access article distributed under the terms of the Creative Commons A ttribution License ( which permits unrestricted use, distribution, and reproduction in any medium, provided the original work is properly cited.Critical Care 2010, 14:R22
Protti et al. Critical Care 2010, 14:R22
/>Page 9 of 9
7. Bronstein AC, Spyker DA, Cantilena LR Jr, Green JL, Rumack BH, Heard SE,
American Association of Poison Control Centers: 2007 Annual Report of
the American Association of Poison Control Centers' National Poison
Data System (NPDS): 25
th
Annual Report. Clin Toxicol (Phila) 2008,
46:927-1057.
8. Personne M: Alarming increase of the number of metformin
intoxications. Ten times doubled number of inquiries to the Swedish
Poison Information Center since 2000. Lakartidningen 2009, 106:994.
9. Wang DS, Kusuhara H, Kato Y, Jonker JW, Schinkel AH, Sugiyama Y:
Involvement of organic cation transporter 1 in the lactic acidosis
caused by metformin. Mol Pharmacol 2003, 63:844-848.
10. Dykens JA, Jamieson J, Marroquin L, Nadanaciva S, Billis PA, Will Y:
Biguanide-induced mitochondrial dysfunction yields increased lactate
production and cytotoxicity of aerobically-poised HepG2 cells and
human hepatocytes in vitro. Toxicol Appl Pharmacol 2008, 233:203-210.
11. Bailey CJ, Wilcock C, Scarpello JH: Metformin and the intestine.
Diabetologia 2008, 51:1552-1553.
12. El-Mir MY, Nogueira V, Fontaine E, Avéret N, Rigoulet M, Leverve X:
Dimethylbiguanide inhibits cell respiration via an indirect effect
targeted on the respiratory chain complex I. J Biol Chem 2000,
275:223-228.
13. Owen MR, Doran E, Halestrap AP: Evidence that metformin exerts its
anti-diabetic effects through inhibition of complex 1 of the
mitochondrial respiratory chain. Biochem J 2000, 348:607-614.
14. Brunmair B, Staniek K, Gras F, Scharf N, Althaym A, Clara R, Roden M,
Gnaiger E, Nohl H, Waldhäusl W, Fürnsinn C: Thiazolidinediones, like
metformin, inhibit respiratory complex I: a common mechanism
contributing to their antidiabetic actions? Diabetes 2004, 53:1052-1059.
15. Zmijewski JW, Lorne E, Zhao X, Tsuruta Y, Sha Y, Liu G, Siegal GP, Abraham
E: Mitochondrial respiratory complex I regulates neutrophil activation
and severity of lung injury. Am J Respir Crit Care Med 2008, 178:168-179.
16. Hinke SA, Martens GA, Cai Y, Finsi J, Heimberg H, Pipeleers D, Casteele M
Van de: Methyl succinate antagonises biguanide-induced AMPK-
activation and death of pancreatic beta-cells through restoration of
mitochondrial electron transfer. Br J Pharmacol 2007, 150:1031-1043.
17. Douglas AR, Jones NL, Reed JW: Calculation of whole blood CO
2
content. J Appl Physiol 1988, 65:473-477.
18. Le Gall JR, Lemeshow S, Saulnier F: A new Simplified Acute Physiology
Score (SAPS II) based on a European/North American multicenter
study. JAMA 1993, 270:2957-2963.
19. Vincent JL, de Mendonça A, Cantraine F, Moreno R, Takala J, Suter PM,
Sprung CL, Colardyn F, Blecher S: Use of the SOFA score to assess the
incidence of organ dysfunction/failure in intensive care units: results of
a multicenter, prospective study. Working group on "sepsis-related
problems" of the European Society of Intensive Care Medicine. Crit
Care Med 1998, 26:1793-1800.
20. Sessler CN, Gosnell MS, Grap MJ, Brophy GM, O'Neal PV, Keane KA, Tesoro
EP, Elswick RK: The Richmond Agitation-Sedation Scale: validity and
reliability in adult intensive care unit patients. Am J Respir Crit Care Med
2002, 166:1338-1344.
21. Salpeter S, Greyber E, Pasternak G, Salpeter E: Risk of fatal and nonfatal
lactic acidosis with metformin use in type 2 diabetes mellitus.
Cochrane Database Syst Rev 2006, 1:CD002967.
22. Runge S, Mayerle J, Warnke C, Robinson D, Roser M, Felix SB, Friesecke S:
Metformin-associated lactic acidosis in patients with renal impairment
solely due to drug accumulation? Diabetes Obes Metab 2008, 10:91-93.
23. Kreymann G, Grosser S, Buggisch P, Gottschall C, Matthaei S, Greten H:
Oxygen consumption and resting metabolic rate in sepsis, sepsis
syndrome, and septic shock. Crit Care Med 1993, 21:1012-1019.
24. Moriyama S, Okamoto K, Tabira Y, Kikuta K, Kukita I, Hamaguchi M,
Kitamura N: Evaluation of oxygen consumption and resting energy
expenditure in critically ill patients with systemic inflammatory
response syndrome. Crit Care Med 1999, 27:2133-2136.
25. Vincent JL, De Backer D: Oxygen transport-the oxygen delivery
controversy. Intensive Care Med 2004, 30:1990-1996.
26. James JH, Luchette FA, McCarter FD, Fischer JE: Lactate is an unreliable
indicator of tissue hypoxia in injury or sepsis. Lancet 1999, 354:505-508.
27. Fink MP: Cytopathic hypoxia. Is oxygen use impaired in sepsis as a
result of an acquired intrinsic derangement in cellular respiration? Crit
Care Clin 2002, 18:165-175.
28. Levy B, Gibot S, Franck P, Cravoisy A, Bollaert PE: Relation between
muscle Na+K+ ATPase activity and raised lactate concentrations in
septic shock: a prospective study. Lancet 2005, 365:871-875.
29. Ramadan W, Petitjean M, Loos N, Geloen A, Vardon G, Delanaud S, Gros F,
Dewasmes G: Effect of high-fat diet and metformin treatment on
ventilation and sleep apnea in non-obese rats. Respir Physiol Neurobiol
2006, 150:52-65.
30. Johnson ST, Robert C, Bell GJ, Bell RC, Lewanczuk RZ, Boulé NG: Acute
effect of metformin on exercise capacity in active males. Diabetes Obes
Metab 2008, 10:747-754.
31. Braun B, Eze P, Stephens BR, Hagobian TA, Sharoff CG, Chipkin SR,
Goldstein B: Impact of metformin on peak aerobic capacity. Appl Physiol
Nutr Metab 2008, 33:61-67.
32. Peddy SB, Rigby MR, Shaffner DH: Acute cyanide poisoning. Pediatr Crit
Care Med 2006, 7:79-82.
33. Hillered L, Ernster L, Siesjö BK: Influence of in vitro lactic acidosis and
hypercapnia on respiratory activity of isolated rat brain mitochondria.
J Cereb Blood Flow Metab 1984, 4:430-437.
34. Gattinoni L, Brazzi L, Pelosi P, Latini R, Tognoni G, Pesenti A, Fumagalli R: A
trial of goal-oriented hemodynamic therapy in critically ill patients.
SvO
2
Collaborative Group. N Engl J Med 1995, 333:1025-1032.
35. Frankenfield DC, Omert LA, Badellino MM, Wiles CE, Bagley SM, Goodarzi
S, Siegel JH: Correlation between measured energy expenditure and
clinically obtained variables in trauma and sepsis patients. JPEN J
Parenter Enteral Nutr 1994, 18:398-403.
36. Faisy C, Guerot E, Diehl JL, Labrousse J, Fagon JY: Assessment of resting
energy expenditure in mechanically ventilated patients. Am J Clin Nutr
2003, 78:241-249.
37. Harris EA, Seelye ER, Squire AW: Oxygen consumption during
cardiopulmonary bypass with moderate hypothermia in man. Br J
Anaesth 1971, 43:1113-1120.
38. Bacher A, Illievich UM, Fitzgerald R, Ihra G, Spiss CK: Changes in
oxygenation variables during progressive hypothermia in
anesthetized patients. J Neurosurg Anesthesiol 1997, 9:205-210.
39. Shapiro BA, Peruzzi WT: Blood gas analysis. In Critical Care 3rd edition.
Edited by: Civetta JM, Taylor RW, Kirby RR. Philadelphia: Lippincott-Raven;
1997:921-939.
doi: 10.1186/cc8885
Cite this article as: Protti et al., Oxygen consumption is depressed in
patients with lactic acidosis due to biguanide intoxication Critical Care 2010,
14:R22