Báo cáo y học: "Costs of relaparotomy on-demand versus planned relaparotomy in patients with severe peritonitis: an economic evaluation within a randomized controlled trial" docx
Bạn đang xem bản rút gọn của tài liệu. Xem và tải ngay bản đầy đủ của tài liệu tại đây (324.41 KB, 11 trang )
RESEARC H Open Access
Costs of relaparotomy on-demand versus
planned relaparotomy in patients with severe
peritonitis: an economic evaluation within a
randomized controlled trial
Brent C Opmeer
1*
, Kimberly R Boer
1
, Oddeke van Ruler
2
, Johannes B Reitsma
1
, Hein G Gooszen
3
,
Peter W de Graaf
4
, Bas Lamme
5
, Michael F Gerhards
6
, E Philip Steller
7
, Cecilia M Mahler
2
, Huug Obertop
2
,
Dirk J Gouma
2
, Patrick MM Bossuyt
1
, Corianne AJM de Borgie
1
, Marja A Boermeester
2
Abstract
Introduction: Results of the first randomized trial comparing on-demand versus planned-relaparotomy strategy in
patients with severe peritonitis (RELAP trial) indicated no clear differences in primary outcomes. We now report the
full economic evaluation for this trial, including detailed methods, nonmedi cal costs, furth er differentiated cost
calculations, and robustness of different assumptions in sensitivity analyses.
Methods: An economic evaluation was conducted from a societal perspective alongside a randomized controlled
trial in 229 patients with severe secondary peritonitis and an acute physiology and chronic health evaluation
(APACHE)-II score ≥11 from two academic and five regional teachi ng hospitals in the Netherlands. After the index
laparotomy, patients were randomly allocated to an on-demand or a planned-relaparotomy strategy. Primary
resource-utilization data were used to estimate mean total costs per patient during the index admission and after
discharge until 1 year after the index operation. Overall differences in costs between the on-demand relaparotomy
strategy and the planned strategy, as well as relative differences across several clinical subgroups, were evaluated.
Results: Costs were substantially lower in the on-demand group (mean, €65,768 versus €83,450 per patient in the
planned group; mean absolute difference, €17,682; 95% CI, €5,062 to €29,004). Relative differences in mean total costs
per patient (approximately 21%) were robust to various alternative assumption s. Planned relaparotomy consistently
generated more costs across the whole range of different courses of disease (quick recovery and few resources used
on one end of the spectrum; slow recovery and many resources used on the other end). This difference in costs
between the two surgical strategies also did not vary significantly across several clinical subgroups.
Conclusions: The reduction in societal costs renders the on-demand strategy a more-efficient relaparotomy
strategy in patients with severe peritonitis. These differences were found across the full range of healthcare
resources as well as across patients with different courses of disease.
Trial Registration: ISRCTN51729393
Introduction
Secondary peritonitis or abdominal sepsis is a serious
condition with high in-hospital mortality (estimates vary
between 20% and 60%) and considerable major disease-
related morbidity [1-4]. Patients with severe peritonitis
require intensive monitoring and medical treatment,
often including lengthy ICU stays. With an estimated
incidence for the United States of 9.3 cases of patients
with secondary peritonitis per 1,000 emergency hospital
admissions [5], these patients incur substantial costs to
the healthcare system.
* Correspondence:
1
Department of Clinical Epidemiology, Biostatistics and Bioinformatics,
Academic Medical Center, Meibergdreef 9, 1105 AZ, Amsterdam, The
Netherlands
Opmeer et al. Critical Care 2010, 14:R97
/>© 2010 Opmeer et al.; licensee BioMed Central Ltd. This is an open access article distribu ted under the terms of the Creative Commons
Attribution licens e (http://creativecommons .org/licenses/by/2.0), whic h permits unrest ricted use, distribution, and reproduction in any
medium, provided the original work is properly cited.
The initial treatment of abdominal sepsis consists of an
emergency laparotomy aimed at eliminating the source
of the infection. Thereafter, two surgical strategies are
used world-wide: planned relaparotomy or relaparotomy
on demand. In the planned strategy, a relaparotomy is
performed ev ery other day (24 to 36 h) until fi ndings are
negative for (ongoing) peritonitis. This strategy may
incur the risk of potential surgery-related complications.
The on-demand strategy uses ‘watchful waiting,’ in which
a relaparotomy is performed only in those patients show-
ing clinical deterioration or lack of improvement. Fewer
relaparotomies are likely to be performed with this st rat-
egy [3], which may benefit the already critically ill
patients, but may lead to a potentially harmful delay.
The debate about the preferred relaparotomy strategy
(on-demand versus planned) in these patients is long-
standing, with both strategies having their proponents. We
recently published the results of the first randomized trial
comparing these two surgical strategies and demonstrated
that patients in the on-demand group did not ha ve a sig-
nificantly lower rate of adverse clinical outcomes com-
pared with the planned group [6]. However, the economic
evaluation from a healthcare perspective showed that total
costs after 12 months of follow-up were estimated at 23%
lower per patient in the on-demand group (€62,741 (US,
$86,077)) as compared with a planned-relaparotomy strat-
egy (€81,532 (US, $111,858)).
Here we present the economic evaluation comparing
costs generated by an on-demand and a pla nned-rela-
parotomy strategy from a societal perspective. More
details are reported, regarding bot h methods and the
clinical process driving these costs. Sensitivity analyses
were performed to evaluate t he robustness of the find-
ings for s everal assumptions and methodologic choices.
Furthermore, differences in costs are assessed across
patients with different clinical characteristics and
courses of disease.
Materials and methods
Design and eligibility
This economic evaluation was part of the RELAP trial, a
randomized controlled multicenter trial comparing an
on-demand relaparotomy strategy with a planned-rela-
parotomy strategy in patients with severe peritonitis.
Details about the design, conduct, and major clinical
findings of this trial were reported elsewhere [6]. In
brief, we included patients diagnosed with s econdary
peritonitis and requiring a n emergency laparotomy, an
Acute Physiologic and Chronic Health Evaluation
(APACHE) II score greater than 10 in the i nitial 24-h
period [7], and aged between 18 and 80 years [6]. The
clinical diagnosis of peritonitis was confirmed during
the index laparotomy. Excluded were patients with con-
tinuous ambulatory peritoneal dialysis (CAPD)-relat ed
peritonitis and pancreatitis. Specialized randomization
software was used to allocate patients centrally, with
stratification by study site and APACHE-II classification
as a minimi zation factor [8]. The operat ing surgeon was
unaware of the allocated treatment strategy while per-
forming the initial emergency laparotomy. The study
was approved b y the medical ethics committees of all
participating centers.
The appropriate type of economic evaluation is condi-
tional o n the results of the primary end points (mortal-
ity, major disease-related morbidity) and health-related
quality-of-life (HR-QoL). In case of one clearly superior
strategy, a cost-effectiveness analysis (CEA) would be
required to combine clinical and economic outcomes. In
case of comparable outcomes in clinical effectiveness, a
cost-minimization analysis (CMA) would suffice [9]. As
clinical end points in this study were comparable or
even in favor of the on-demand strategy, this economic
evaluation was set up as a cost-minimization analysis.
Economic evaluation
Healthcare utilization and other resources were prospec-
tively documented for individual patients [10], by using
regist ration forms of the clinical study, and by acquiring
data from additional sources where needed. The horizon
for the economic evaluation was 12 months after the
initial emergency laparotomy.
The cost analysis was set up from a societal perspec-
tive, which consists of three cost categories [11]. These
include direct medical costs, direct nonmedical costs, and
indirect costs [9,12]. Direct medical costs are generated
by healthcare utilization and include hospital and ICU
admission periods, therapeutic and diagnostic proce-
dures, medication, and visi ts to primary and pa ramedical
healthcare providers after discharge. Direct nonmedical
costs are generated by expenses for travel to and from
healthcare providers. I ndirect costs are associated with
loss of productivity due to impaired ability to work [12].
This societal perspective allows a more complete eco-
nomic evaluation as compared with a healthcare perspec-
tive, used for earlier cost estimates [6].
To exclude potential protocol-driven costs, we
assessed the extent to which procedures and follow-up
visits are part of the usual care for these patients or are
relevant only for the conduct of the trial. Basically, some
surgical and diagnostic interventions formed protocol s
for the study, but this was because they are inherent to
the surgical st rategy; other pro cedures and int ervention s
were at the discretion of the surgeon, reflecting usual
care.
Resource utilization
Data on resource utilization during the index hospital
admission included the number of surgical interventions
Opmeer et al. Critical Care 2010, 14:R97
/>Page 2 of 11
(including relaparotomies), percutaneous drainage pro-
cedures, diagnostic procedures (abdominal computer
tomography (CT), ultrasound (US), plain radiograph of
the abdomen), postoperative hospital stay from index
laparotomy onward, and ICU stay. The initial summary
cost analyses reported with the main clinical findings [6]
were further refined by differentiating between relaparo-
tomies (performing further abdominal repair) and sec-
ond-look relaparotomies; the latter were assumed to
generate fewer costs.
All data were registered alongside the clinical study.
Resource utilization after discharge was documented in
specifically developed, self-administered questionnaires
that were sent to surviving discharged patients at 3, 6, 9,
and 12 months of follow-up. Patients reported use of
primary, secondary, and paramedic healthcare services.
Employment status and absence from paid work was
also documented by using the Health and Labour Ques-
tionnaire [13]. Nonresponse to the mailed question-
naires was followed by a reminder by phone, and a new
questionnaire after 1 month.
Unit costs
Estimates of unit costs were derived from different
sources [see Additional File 1]: Dutch reference data
from the handbook of the Dutch Health Council
[12,14]; Dutch pharmaceutical unit cost listings [15];
insurance reimbursement fees [16]; top-down cost cal-
culations; and bottom-up cost calculations performed by
the authors. All costs were set at the year 2004 price
level by using the price index rate for the Dutch health-
care sector.
Costs: calculations
Costs were calculated for individual patients by multi-
plying actually used healthcare resources and unit costs.
Data concerning postdischarge healthcare utilization
were not always complete because of partial or nonre-
sponse to the self-administered questionnaires. In these
cases, the average resource utilization for an out-of-hos-
pital day was estimated within each study/treatment
group, and extrapolated over t he total out-of-hospital
period. Productivity costs due to ill ness or recov ery in
patients younger than 65 years were estimated based on
patient-reported absences from paid work. Productivity
costs were calculated by using a friction cost approach,
which assumes that after a friction period (154 days),
each employee is replaced in the workforce [12].
Statistical analyses
All analyses were performed according to the intention-
to-treat principle [17]. Data management and analyses
were performed with SPSS 12 (SPSS Inc., Chicago, IL),
MS Excel 2003, and SAS 9.1 (SAS Institute, Cary, NC).
Mean volumes of resource utilization and associated
costs during the index admission and 1-year follow-up
were estimated for the two surgical strategies. Differ-
ences in volumes were tested for significance by using a
nonparametric Wilcoxon Mann-Whitney test.
Total costs per patient were estimated as the sum of
direct medical costs, direct nonmedical costs, and indir-
ect costs. Differences in total costs between the two
surgical strategies were tested based on their geometric
means [18].
Robustness of our results were evaluated in sensitivity
analyses regarding the extent to which cost differences
can be attributed to costs of relaparotomies alone, as
well as for unit costs for a range of cost drivers [5,6].
We evaluated whether differences in costs were consis-
tent across patients with var ying clinical conditions, or
whether these differences were more pronounced in
more severely ill patients. We hypothesized that the
total costs are a proxy for severity of the clinical condi-
tion, as more severely ill patients would require more-
complica ted care and more-intensive treatment, thereby
generating more resource utilization and costs. Based on
this assumption, we compared the distribution o f costs
across patients with different clinical conditions (from
those patients with a relative ly quick recovery and less
resource utilization to patients with a more-severe
course of disease with slower recovery and extensive use
of healthcare resources) between the two strategies. The
comparison was graphically presented by ranking
patients within each study group by their total costs,
and comparing total costs of patients with similar ranks.
Finally, we hypothesized that the relative difference
between the on-demand relaparotomy strategy and the
planned strategy could be different across clinical sub-
groups: betwee n patien ts with and without any major
comorbidity (defined as malignancy, cardiovascular dis-
ease, respiratory disease, renal disease, or diabetes),
patients with high (>20) versus patients with lower (11-
20) APACHE-II scores, and between patients surviving
and those who died before 12 months of follow-up. A lin-
ear r egression model was used, with the log-transformed
costs as the outcome measure to improve the normality
of the residuals required in such models. Differences
between clinical subgroups were estimated and statisti-
cally teste d by adding this as an interaction effect with
the type of surgical strategy to the model.
Results
Main clinical findings
In total, 229 patients were correctly randomized and
included in this study. In both surgical strategies, one
patient withdrew in formed consent, and one patient was
lost to follow-up, meaning that data on the initial
admission were available for 229 patients (114 on-
Opmeer et al. Critical Care 2010, 14:R97
/>Page 3 of 11
demand and 115 planned strategy) , and data on the
1-year follow-up, for 225 patients (112 o n-demand and
113 planned strategy).
Demographic and clinical baseline characteristics of
these randomized patients are presented in Table 1,
toge ther with a summary of the mai n clinical outcomes.
The results show that morbidity and mortality were
comparable. More details on the clinical outcomes can
be found in the trial publication of clinical outcomes [6].
Resource utilization and costs
Data available for analysis from the index admission and
follow-up admissions were available for all patients.
Additional data on use of healthcare resources outside
the hospital (outpatient care and other healthcare provi-
ders), travel, and absence from work were reported for
at least one follow-up period by 76 patients in the on-
demand group and 74 patients in the planned group.
For both strategies, mean costs per out-of-hospital day
were estimated and extrapolated to patients who did not
report this part of the follow-up.
Results of the cost analyses are presented by reporting
mean volumes, total costs, mean costs per patient per
strategy for the on-demand group and the planned
group for reso urce utilization during the index admis-
sion, and follow-up (Table 2). Mean costs per patient
associated with relaparotomy procedures during the
index admission were estimated as €4,617 (index lapar-
otomy plus 113 relaparotomies in 114 patients) for the
on-demand group and €6,641 (index laparotomy plus
233 relaparot omies in 115 patients) for the planned
group (P < 0.001). Although in the on-demand group,
significantly fewer relaparotomies comprised additional
surgical procedures (42 in the on-demand and 54 in the
planned-relaparotomy group; P = 0.022), the associated
mean costs per patient (€1,211 for the on-demand
group and €1,543 for the planned group) of thes e addi-
tional procedure differed only marginally (€ 332).
Higher costs generated by additional US- or CT-
guided percutaneous drainages (€147 (27% received
PCD) for the on-demand group and €233 (39% received
PCD; P = 0.038) ) for the planned group) did not com-
pensate for the lower numbers of relaparotomies in the
on-demand group.
As a large majority of patients were admitted to the
ICU, substantial costs were generated by the ICU stay.
Mean estimated costs per patient generated by the ICU
stay were €21,040 (90% of the patients; mean stay, 12
days) in the on-demand group and €31,248 (94% of the
patients; mean stay, 18 days; P = 0.001) for the planned-
relaparotomy group (mean difference, €10,208). Costs
ass ociated with mechanical ventil ation showed a similar
picture, with mean costs estimated as €3,080 (mean, 8.3
days) for the on-demand group and €4,360 (mean,
12 days; P = 0.004) for the planned group (mean cost
difference, €1,280). Costs generated by hospital stay on
the ward (excluding ICU days) were estimated as
€11,609 for the on-demand group and €11,784 for the
planned-relaparotomy group. Although the total length
of hospital stay for the index admission was substantially
shorter for patients in the on-demand grou p (mean, 38
days, versus mean, 45 days in the planned group), length
of stay on the ward was comparable (mean, 26 and 27
days, respectively; P = 0.21).
The on-demand group used substantially less medica-
tion and material (for example, days with enterostomy
care, blood transfusions). Mean costs per patient for
medication were €474 versus €619; for blood products,
€89 versus €178; and for enterostomy care, €741 and
€917, comparing the on-demand group and the
planned-relaparotomy group. Direct medical costs dur-
ing admission were significantly lower in the on-demand
group,withameandifferenceof€14,418 (95% CI,
€5,274 to €22,983).
Costs associated with readmissions during the 1-year
follow-up were c omparable (mean number of hospital
days, 9.5 versus 11.8 days (P =0.88),withmeancosts
€4,280 for the on-demand patients versus €5,083 for the
planned patients). On average, enterostomy care and
associated costs during follow-up were considerable.
Patients had an enterostomy for a mean of 140 days
(€4,449) in the on-demand group and 150 days (€4,767)
in the planned-relaparotomy group (P = 0.44).
Distinct differences in resource utilization and asso-
ciated costs of outpatient and secondary healthcare pro-
viders were found for home care supplied by district
nurses and stay in rehabilitation centers, in which the
on-demand group received less home care (45 hours per
patient versus 71 hours in the planned-relaparotomy
group; P = 0.16) and had shorter stays in rehabilitation
centers than did the planned-relaparotomy group (19
versus 23 days; P = 0.90). Differences between the study
groups in utilization and associated costs o f outpatient
care and visits to secondary healthcare providers
Table 1 Patient characteristics and summary of main
clinical outcomes in the on-demand and planned-
relaparotomy groups [6]
Characteristic On demand Planned
APACHE II >20, n (%)
a
16 (14) 19 (17)
Mannheim Peritonitis Index [28],
mean (95% CI)
a
27 (23 to 32) 29 (24 to 33)
One or more comorbidity present, n (%)
a
64 (56) 72 (63)
Mortality at 1 year, n (%)
b
32 (29) 41 (36)
Major morbidity in survivors, n (%)
c
32 (40) 32 (44)
a
At index admission (n = 229);
b
at follow up (n = 225);
c
in surviving patients
(n = 152).
Opmeer et al. Critical Care 2010, 14:R97
/>Page 4 of 11
Table 2 Mean use of resources and costs in the on-demand and planned-relaparotomy groups during index admission
and follow-up until 1 year after randomization
OD (n = 114) PR (n = 115) Difference (PR-OD)
Unit Mean
volume
Mean
costs p.p. (€)
Mean
volume
Mean
costs p.p.(€)
Mean
costs p.p. (€)
Direct medical costs
Index admission
Admission
Ward stay, index (excl ICU) Day 26 11,609 27 11,784 175
ICU stay Day 12 21,040 18 31,248 10,208
Interventions
(re)Laparotomy
Index laparotomy Procedure 1.0 2,267 1.0 2,267 0
Second-look Procedure 0.62 1,139 1.5 2,831 1,692
with other surgical procedures Procedure 0.37 1,211 0.47 1,543 332
Percutaneous drainage Procedure 0.41 123 0.67 199 84
Diagnostic CT and cultures
CT Procedure 1.2 302 1.4 341 39
Microbiology Cultures 43 586 58 792 206
Medication and other materials
Antibiotic therapy (excl ICU) Day 6.0 474 6.1 619 145
Enterostomy care
b
Day 24 741 29 917 176
Blood products Unit 0.61 89 1.04 178 89
Mechanical ventilation Day 8.3 3,080 12 4,360 1,280
SUBTOTAL 42,661 57,079 14,418
Follow-up
OD (n = 112) PR (n = 113)
Inpatient care
Ward stay, follow up Day 9.5 4,280 11.8 5,083 803
Elective surgery Procedure 0.39 875 0.51 1,163 288
Percutaneous drainage Procedure 0.08 24 0.11 32 84
Outpatient care
Specialist consultation
a
Visit 16.3 1,297 16.7 1,333 36
CT abdomen Procedure 0.07 18 0.03 7 -11
US abdomen Procedure 0.05 5 0.03 2 -2
Plain radiograph Procedure 0.18 8 0.12 5 -3
Enterostomy care
b
Day 140 4,449 150 4,767 318
Other health care providers
Primary care physician
a
Visit 9.4 194 8.5 175 -19
Company doctor
a
Visit 1.8 42 1.4 31 -10
Paramedical specialist
a
Visit 29 675 29 667 -7
District nurse
a
Hour 45 1,836 71 2,947 1,111
Rehabilitation center
a
Day 19 6,480 23 8,040 1,560
SUBTOTAL 20,183 24,252 4,069
Opmeer et al. Critical Care 2010, 14:R97
/>Page 5 of 11
(general practitioner, compa ny doctor) were marginal.
The direct medical costs during follow-up (between dis-
charge and 12 months after the index laparotomy) were
lower in the on-demand group, with a mean difference
per patient of €4,069 (95% CI, €2,660 to €7,063).
Among patients reporting to have paid work, only the
occasional patient reported a return to work within
12 months. For all nonresponding patients younger than
65 years, we therefore assumed that they were at least
absent for the full friction period (154 days). The mean
number of days absent from paid work was estimated as
70 days in the on-demand group versus 50 days in the
planned group (P = 0.038). Costs associated with lost
productivity for these days were estimated as €2,854 and
€2,048, respectively.
Overall, for t he 1-year study period, mean total costs
per patient associated with the on-demand strategy were
€65,768 versu s €83,450 with the planned strategy (abso-
lute difference, €17,682; 95% CI, €5,062 to €29,004; Wil-
coxon-Mann-Wh itney test, P < 0.005; relati ve difference,
21%). Of these total costs, 75% were generated during the
initial admission, of which 45% to 55% were ICU costs.
Subsequent sensitivity analyses showed that the results
of the cost analysis were ro bust for changes in various
assumptions (Table 3). Absolute estimates of total costs
were found to change within a limited range for each
strategy (<€8,000 for on-demand, and <€10,000 for
planned relaparotomy), whereas the relative difference
between the two strategies remained stable (21% to 22%).
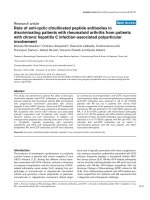
To answer the question whether this difference is con-
sistent across patients with different clinical course,
Figure 1 shows the distribution of total costs per patient
in each group after patients are ranked according to
their total costs. Costs were found to be consistently
lower in the on-dem and group compared with the
planned-relaparotomy group across the whole range of
costs, except for a small number of patients at the very
high end of total costs.
Relative differences in costs between the on-demand
relaparotomy strategy and the planned strategy varied
substantially across clinical subgroups: in some sub-
groups, the mean costs in the planned group are almost
twice tho se in the on-demand g roup (patients surviving
for 12 months versus patients dying within 12 months),
whereas costs associated with both strategies appear to
be rather comparable in others (for example, anastomo-
tic leakage) (Table 4). In patients who did not survive,
12-months costs w ere lower in the on-demand group.
As none of the formal statistical tests for interaction
was significant at the 5% level, the assumption that rela-
tive difference in costs between the on-demand and the
planned strategy are constant across subgroups has not
been rejected.
Discussion
We present an economic evaluation within a rando-
mized clinical trial comparing two commo nly used sur-
gical strategies for patients with secondary peritonitis
after their initial emergency laparotomy, on-demand
relaparotomy and planned relaparotomy. In an earlier
publication focusing on the clinical outcomes of the
RELAP trial, w e demonstrated that patients in the on-
demand group did not have a significantly lower rate
of poor outcomes compared with the planned group
[6]. The results of the detailed cost a nalyses presented
here indicate that, across the full range of healthcare
resources, as well as across patients with different dis-
ease and recovery courses, resource utilization and
associated costs generated by treatment and follow-up
of severe abdominal sepsis were substantially lower for
the on-demand strategy than for the planned strategy.
Furthermore, these relative differences in costs
between the two strategies appeared to be quite c onsis-
tent across a range of clinical subgroups, although for
some (for example, anastomotic leakage), this study
may have had insufficient power to statistically demon-
strate such differences.
The observed cost differences were predominantly
related to lengthier ICU stays and duration of mechanical
ventilation d uring t he index admission period. Costs of
Table 2: Mean use of resources and c osts in the on-demand and pla nned-rela parotomy g roups during index admis-
sion and follow-up until 1 year after randomization (Continued)
Direct nonmedical costs
Travel costs
a
Km 395 71 393 71 0
Indirect costs
Absence from paid work
a
Day 70 2,854 50 2,048 -806
Total costs (€) 65,768 83,450 17,682
a
PR n = 74/OD n = 76: number of patients on whom analyses are based. Average costs per patients per day outside the hospital within each arm were
extrapolated to patients for whom this information was not available.
b
PR n = 53 patients with enterostomy; OD n = 49 patients with enterostomy; volume,
average amount of resources used per patient; total costs, total costs of resource use of all patients; mean costs, average cost per patient; difference, difference
between PR and OD (positive values in favor of OD).
Opmeer et al. Critical Care 2010, 14:R97
/>Page 6 of 11
rehabilitation centers and home care and of readmissions
to a general hospital during follow-up were also substan-
tial contributors to these cost differences. Although the
planned strategy per definition involved at least one rela-
parotomy procedure, costs generated only by this extra
procedure were only a mere fraction of the encountered
cost differences. When costs associated with relaparotomy
procedures were disregarded, major cost differences
between the surgical strategies remained present.
An important component of the total direct medical
costs was the ICU stay (often involving mechanical ven-
tilation). Consequently, total costs were highly influ-
enced by the unit costs estimate for an ICU day. We
used a reference price based on data from a range of
general and academic hospitals in the Netherlands [14].
In the literature, considerable variation was encountered
in cost estimates for an ICU stay, if reported at all. This
variation due to differences in calculation methods,
patient groups, but also in local organization and facil-
ities (staff allocation and remuneration, equipment
costs, nonclinical support services and premises) [10]
and (national) healthcare system. To enhance the gener-
alizing of our findings to other countries, we presented
the consequences of u sing cost estimates found for the
United Kingdom [10], Austria [19], France [20], Canada
[21], Germany [22], and Norway [23]. Estimates for
countries with publicly funded healthcare systems were
better reported in the literature than estimates for coun-
tries with other types of healthcare systems (for exam-
ple, the United States). Information pertaining to these
costs and studies addressing the real costs of health care
resources appeared to be lacking for non-publicly
funded healthcare systems.
In general, resource utilization was found to be higher in
the planned group than in the on- demand group. There-
fore, adj ustments in un it costs woul d result in changing
Table 3 Summary of sensitivity analyses: mean total costs and estimated absolute and relative differences between
relaparotomy on demand and planned relaparotomy across alternative assumptions and calculation methods
Mean Mean %
Description OD PR difference 95% CI
a
Difference
Analysis
Main Main analysis (most probable assumptions) 65,768 83,450 17,682 (5,062 to
29,004)
21.2%
1 Percutaneous drainage procedures (reimbursement fee as opposed to AMC
estimate)
65,754 83,428 17,674 (5,057 to
28,975)
21.2%
2 Ward-stay unit costs (weighted average of Academic and General hospitals)
b
62,938 81,016 18,078 (5,437 to
28,640)
22.3%
3 ICU-day unit costs (AMC top-down calculation instead of guideline) 70,694 90,980 20,286 (5,959 to
32,160)
22.3%
4 With ICU-day unit costs estimated for
A United Kingdom 63,235 79,688 16,453 (4,788 to
28,439)
20.6%
B Germany 61,541 77,172 15,631 (4,578 to
28,037)
20.3%
C France 69,102 88,401 19,299 (5,371 to
29,721)
21.8%
D Norway 77,225 100,465 23,240 (5,948 to
31,306)
23.1%
E Austria 63,794 80,518 16,724 (4,851 to
28,560)
20.8%
F Canada 58,960 73,338 14,378 (4,223 to
27,415)
19.6%
5 Exclude all costs of relaparatomy procedures 62,543 77,913 15,370 (3,018 to
25,395)
19.7%
a
Based on geometric means;
b
weighted by ratio of Academic and General hospital beds in the Netherlands (1:6). Explanation of different sensitivity analyses:
(1) for percutaneous drainage procedure, AMC-unit costs estimates were replaced by reimbursement fees for this procedure. (2) To avoid the encountered cost
differences where direct results from the differentiation between academic and nonacademic hospitals, a weighted average unit cost per hospital ward day was
used. This average was weighted by the actual ratio of academic and nonacademic hospital beds in the Netherlands [29]. (3) We differentiated between unit
costs of relaparotomies with and those without other surgical procedures (such as enterostomy (re)construction, abscess drainage, colon resection) instead of
using the same all-in unit costs for all relaparotomies. (4a through f) To enhance generalizability of the results to other countries with publicly financed health
care systems, Dutch reference prices for ICU days were replaced by unit costs estimated for the UK, Germany, France, Norway, Austria, and Canada, respectively
[10,19-23]. Additionally (5), we compared the total costs of the two strategies when disregarding the costs of relaparotomy procedures during the index
admission because these differences were intrinsic to the strategy itself, as the planned strategy involved more procedures than did the on-demand strategy.
Opmeer et al. Critical Care 2010, 14:R97
/>Page 7 of 11
total costs, rather than affecting the difference be tween
on-demand and planned relaparotomy. Total costs varied
to some degree with the different assumptions regarding
unit-cost prices, but the relative difference between the
strategies remained consistent across these analyses. On
average, the on-demand strategy generated approximately
21% less costs than planned relaparotomy. Per 1,000
patients admitted to an emergency room with severe peri-
tonitis, half of whom are currently operated on according
to the planned strategy, some €10 million could be saved.
No othe r studies have reported a detailed description
of costs associated with resource utilization generated
by abdominal sepsis patients treated by either strategy,
and we can compare volumes only; our findings were
comparable to those of a retrospective study comparing
on-demand and planned relaparotomy, reporting similar
figures for average length of hospital stay (49.5 vs. 52.0
(including ICU) and a verage length of ICU stay (12.6
versus 17.8 days). Duration of mechanical ventilation
was a few days longer (10.3 versus 13.9) as compared
with our results (8.5 versus 12 days), but the difference
(on-demand, 2.5 days shorter ventilation period) was
consistent with our findings [3,6].
This study has some strengths and limitations. First,
the economic evaluation was performed as part of a ran-
domized, controlled trial that stratified for severity of
disease, ensuring that the patients in both strategies
were comparable with respect to clinical and prognostic
factors. Differences in resource utilization a nd related
costs can therefore confidently be attributed to the sur-
gical strategy. Furthermore, the economic evaluation
was based on data on resource utilization required for
the clinical trial and extended with additional relevant
information acquired with self-administered question-
naires. This bottom-up strategy provided insight into
the healthcare process and main cost-driving factors.
Although the majority of costs were generated during
index admission, syst ematic documentation during fol-
low-up demonstrated that these differences remain
unchanged from a societal perspective.
Currently, support of the on-demand strategy is grow-
ing [24-27], and sound empiric evidence regarding the
optimal approach is no w available from a prospective
randomized comparison. The clinical results of the
RELAP trial, reported elsewhere [6], and the present
economic evaluatio n support further implementation of
Figure 1 Comparing on-demand and planned-relaparotomy strategies for patients ranked according to their total costs.Totalcosts
could be taken as proxy for clinical condition and recovery. The observed difference in total costs per patient was similar for patients with the
most favorable conditions and courses of recovery, as compared with patients with more severe conditions or complicated courses of recovery
or both. PR, planned relaparotomy; OD, on-demand relaparotomy.
Opmeer et al. Critical Care 2010, 14:R97
/>Page 8 of 11
Table 4 Variation in relative differences in total costs between on-demand and planned relaparotomy strategies
across various clinical subgroups
Relaparotomy strategy
On demand Planned Difference
a
Mean costs p.p. n Mean costs p.p. n % from planned P value
b
Overall 66,216 112 84,152 113 -23.8%
Comorbidity 0.26
No 64,948 48 89,738 41 -32.8%
Yes 67,168 64 80,971 72 -17.1%
Apache II 0.58
11-20 66,956 96 84,683 94 -22.3%
>20 61,777 16 81,525 19 -32.3%
Etiology 0.09
Inflammation (1) 40,810 4 81,074 5 -21.7%
Perforation (2) 62,236 63 88,985 67 -37.0%
Ischemia (1) 59,591 6 72,080 8 –
Anastomotic leakage (3) 76,171 35 72,751 27 6.8%
Other (4) 77,153 4 100,149 6 -6.9%
Elimination of infectious source 0.81
No 71,113 10 90,254 11 -24.2%
Yes 65,736 102 83,494 102 -18.3%
Localization 0.45
Upper GT (1) 69,828 30 81,146 27 -25.9%
Lower GT (2) 67,402 70 82,446 74 -42.7%
Biliary tract (3) 63,496 2 100,115 5 -28.8%
Appendix (3) 32,075 3 26,575 1 –
Pancreas (3) 59,352 5 92,446 2 –
Gynecol (3) 41,650 2 67,720 1 –
Other (3) 145,821 3 –
Extent of index operation 0.49
1 quadrant 66,079 9 73,381 16 3.0%
2 quadrants 62,439 34 84,791 26 -30.6%
Diffuse 68,096 70 86,102 69 -24.8%
Nature of contamination 0.18
Clear (1) 59,306 6 97,791 8 -25.9%
Turbid (2) 57,179 18 96,672 29 -42.7%
Purulent (3) 55,746 43 77,003 30 -28.8%
Fecal (4) 84,707 41 81,977 41 -2.4%
Bile (3) 40,281 4 61,984 3 -
Survival (at 12 mo)
No 73,275 80 85,326 72 -17.8% 0.13
Yes 48,569 32 82,089 41 -38.6%
a
Model estimates of difference between On demand and Planned relaparotomy strategy based on analyses of geometric means;
b
For the interaction effect in
regression model; (x) numbers between brackets indicate collapsed categories used as interaction effect. The P value for the interaction effect in the regression
model tests the hypothesis that the relative differences between the two surgical strategies are the same across clinical subgroups (for example, for comorbidity,
that -32.8% = -17.1%). P values > 0.05 indicate that this hypothesis cannot be rejected at a 5% statistical significance level.
Opmeer et al. Critical Care 2010, 14:R97
/>Page 9 of 11
an on-demand relaparotomy strategy for treatment of
patients with abdominal sepsis.
Conclusions
This economic evaluation pro spectively demonstrated
that resource utilization and associated costs generated
during treatment and follow-up of severe peritonitis
were substantially lower for an on-demand strategy
compared with a planned strategy. These differences
were found across the full range of healthcare resources
as well as across patients with different courses of
disease. Considering that patients in the on-demand
relaparotomy strat egy group had a lower (albei t not sta-
tistically significant) rate of adverse outcomes compared
with the planned-relaparotomy group [6], the reduction
in costs (21%) associated with healthcare utilization
renders the on-demand rela parotomy a more efficient
surgical strategy in patients with severe peritonitis.
Implementation of an on-demand relaparotomy strategy
could have a positive impact on th e healthcare expenses
for this severe and costly medical condition.
Key messages
• Patients with severe peritonitis require intensive
monitoring and medical treatment, often including
lengthy ICU stays, and therefore incur substantial
costs to the healthcare system.
• The first randomized clinical trial comparing on-
demand versus a pla nned-relaparot omy strategy in
patients with severe peritonitis ( RELAP trial) indi-
cated no clear differences in primary clinical
outcomes.
• To assess the economic impact of differences in
resource use, we performed a full economic evalua-
tion from a societal perspective alongside this trial.
• Mean total costs per patient were 20% lower in the
on-demand group as compared with the planned
group.
• The substantial difference in costs renders the
on-demand strategy a far more efficient relaparot-
omy strategy in patients with severe peritonitis.
Additional material
Additional file 1: Table reporting units of resource use, unit costs
(€), valuation method and volume source used for the cost
analyses.
Abbreviations
APACHE: Acute Physiology and Chronic Health Evaluation; CRF: clinical
report form; CEA: cost-effectiveness analysis; CMA: cost-minimization analysis;
CT: computed tomography; FFP: fresh frozen plasma; HR-QoL: health-related
quality of life; ICU: intensive care unit; OD: on demand relaparotomy; PCD:
percutaneous drainage; PR: planned relaparotomy; RELAP trial: randomized
controlled trial comparing relaparotomy on demand with planned
relaparotomy; US: ultrasound; US$: United States dollar; 95% CI: 95%
confidence interval.
Acknowledgements
Dutch Peritonitis Study Group
RELAP trial clinical centers and investigators of the Dutch Peritonitis Study
Group All investigators are from Departments of Surgery unless specified: (E)
Clinical Epidemiology and Biostatistics, (I) Intensive Care, or (MP) Medical
Psychology.
O van Ruler MD; KR Boer MSc (E); JB Reitsma MD, PhD (E); CW Mahler MD;
EA Reuland MSc; JWO van Till MD; BC Opmeer PhD (E); PMM Bossuyt PhD
(E); MJ Schultz MD, PhD (I); MA Sprangers MD, PhD (MP); DJ Gouma MD,
PhD; H Obertop MD, PhD; CAJM de Borgie MD, PhD (E); MA Boermeeste r
MD, PhD, Academic Medical Center, Amsterdam; EPh Steller MD, PhD; P.
Tanis MD, PhD; H Hart MD (I), St Lucas Andreas Hospital, Amsterdam; MF
Gerhards MD, PhD; M Guijt MD; HM Oudemans MD, PhD (I), Onze Lieve
Vrouwe Gasthuis, Amsterdam; K. Bosscha MD, PhD; E Ritchie MD; M Vermeer,
Bosch Medical Centre, Den Bosch; PW de Graaf MD, PhD; B van Etten MD,
PhD; C Haazer (I); E Salm MD, PhD (I); Reinier de Graaf Hospital, Delft; B
Lamme MD, PhD; EJ Hesselink MD, PhD; H Rommes MD, PhD (I), Gelre
Hospitals, Lucas Hospital Apeldoorn; RJ Oostenbroek MD, PhD; L te Velde
MD; G Govaert MD; HH Ponssen MD (I), Albert Schweitzer Hospital,
Dordrecht; HG Gooszen MD, PhD; MK Dinkelman MD; LPH Leenen MD, PhD
(I), University Medical Centre Utrecht; EGJM Pierik MD, PhD; KWW Lansink
MD; J Bakker MD, PhD (I), Isala Clinics, Zwolle.
Key staff and steering committee at coordinating center RELAP trial:
O van Ruler (investigator), EA Reuland (data management), CW Mahler
(investigator), JB Reitsma (epidemiologist), CAJM de Borgie (epidemiologist),
KR Boer (quality of life investigator), BC Opmeer (health economist), MA
Boermeester (principle investigator, project supervisor, gastrointestinal
surgeon) from the Department of Surgery, Academic Medical Center
Amsterdam, The Netherlands.
The key staff and steering committee received compensation from the grant
provided by ZonMw, The Hague, The Netherlands.
Financial support:
Dutch Organization for Health Research and Development (ZonMw), The
Hague, The Netherlands. Health Care Efficiency Program. Grant numb er:
945-02-028
ZonMw approved the study protocol (including design and conduct of
the study, data collection and management) after consulting national
and international i ndependent reviewers. Final analyses, interpretation of
data, manuscript preparation, review and approval of the manuscript
were left to the authors’ discretion and were not influenced in any way
by ZonMw.
Supported by the Netherlands Organization for Health Research and
Development (ZonMW), The Hague, The Netherlands. Grant no. 945-02-028.
Author details
1
Department of Clinical Epidemiology, Biostatistics and Bioinformatics,
Academic Medical Center, Meibergdreef 9, 1105 AZ, Amsterdam, The
Netherlands.
2
Department of Surgery, Academic Medical Center,
Meibergdreef 9, 1105 AZ, Amsterdam, The Netherlands.
3
Department of
Surgery, Universitary Medical Center Utrecht, Heidelberglaan 100, 3584 CX,
Utrecht, The Netherlands.
4
Department of Surgery, Reinier de Graaf Gasthuis,
Reinier de Graafweg 3-11, 2625 AD, Delft, The Netherlands.
5
Department of
Surgery, Gelre Hospital, Albert Schweitzerlaan 31, 7334 DZ, Apeldoorn, The
Netherlands.
6
Department of Surgery, Onze Lieve Vrouwe Gasthuis,
Oosterpark 9, 1091 AC, Amsterdam, The Netherlands.
7
Department of
Surgery, Sint Lucas Andreas Hospital, Jan Tooropstraat 164, 1061 AE,
Amsterdam, The Netherlands.
Authors’ contributions
MAB, DJG, HO, JBR, and CAJMB designed the clinical study. BCO, CAJMB,
and MAB designed the economic evaluation alongside the clinical trial. OR
and CWM were responsible for the coordination of the study, including
contacting patients and collecting and entering data. KRB and OR were
responsible for assessment and processing of follow-up data. BCO, KRB, OR,
JBR, and MAB were responsible for the cost analyses. HGG, PWG, BL, MFG,
and EPS were responsible for including more than 10% of the randomized
patients in their participating hospital. BCO analyzed data and prepared
Opmeer et al. Critical Care 2010, 14:R97
/>Page 10 of 11
initial versions of the manuscript. BCO, KRB, OR, JBR, and MAB were
responsible for the final manuscript. BCO, KRB, OR, JBR, and MAB interpreted
and discussed all data. All authors read, reviewed, and approved the final
manuscript.
Competing interests
The authors declare that they have no competing interests.
Received: 11 December 2009 Revised: 9 April 2010
Accepted: 27 May 2010 Published: 27 May 2010
References
1. Christou NV, Barie PS, Dellinger EP, Waymack JP, Stone HH: Surgical
Infection Society intra-abdominal infection study: prospective evaluation
of management techniques and outcome. Arch Surg 1993, 128:193-198.
2. Koperna T, Schulz F: Prognosis and treatment of peritonitis: do we need
new scoring systems? Arch Surg 1996, 131:180-186.
3. Lamme B, Boermeester MA, Belt EJ, van Till JW, Gouma DJ, Obertop H:
Mortality and morbidity of planned relaparotomy versus relaparotomy
on demand for secondary peritonitis. Br J Surg 2004, 91:1046-1054.
4. Wittmann DH, Schein M, Condon RE: Management of secondary
peritonitis. Ann Surg 1996, 224:10-18.
5. Anaya DA, Nathens AB: Risk factors for severe sepsis in secondary
peritonitis. Surg Infect (Larchmt ) 2003, 4:355-362.
6. van Ruler O, Mahler CW, Boer KR, Reuland EA, Gooszen HG, Opmeer BC,
de Graaf PW, Lamme B, Gerhards MF, Steller EP, van Till JW, de Borgie CJ,
Gouma DJ, Reitsma JB, Boermeester MA, Dutch Peritonitis Study Group:
Comparison of on-demand vs planned relaparotomy strategy in patients
with severe peritonitis: a randomized trial. JAMA 2007, 298:865-872.
7. Knaus WA, Harrell FE Jr, Lynn J, Goldman L, Phillips RS, Connors AF Jr,
Dawson NV, Fulkerson WJ Jr, Califf RM, Desbiens N, Layde P, Oye RK,
Bellamy PE, Hakim RB, Wagner DP: The SUPPORT prognostic model:
objective e stimates of survival for seriously ill hospitalized adults: study
to understand prognoses and preferences for outcomes and risks of
treatments. Ann Intern Med 1995, 122:191-203.
8. Bohnen JM, Mustard RA, Oxholm SE, Schouten BD: APACHE II score and
abdominal sepsis: a prospective study. Arch Surg 1988, 123:225-229.
9. Gold MR, Siegel JE, Russel LB: Cost-effectiveness in Health and Medicine.
New York: Oxford University Press 1996.
10. Edbrooke D, Hibbert C, Ridley S, Long T, Dickie H: The development of a
method for comparative costing of individual intensive care units: The
Intensive Care Working Group on Costing. Anaesthesia 1999, 54:110-120.
11. Riteco JA, Heij LJ, Luijn JC, Wolff I: Richtlijnen voor farmaco-economisch
onderzoek [Guidelines for pharmaco-economic research]. Amstelveen:
College voor Zorgverzekeringen (CvZ) [Health Insurance Board] 1999.
12. Oostenbrink JB, Koopmanschap MA, Rutten FF: Standardisation of costs:
the Dutch Manual for Costing in economic evaluations.
Pharmacoeconomics 2002, 20:443-454.
13. van Roijen L, Essink-Bot ML, Koopmanschap MA, Bonsel G, Rutten FF: Labor
and health status in economic evaluation of health care: The Health and
Labor Questionnaire. Int J Technol Assess Health Care 1996, 12:405-415.
14. Oostenbrink JB, Buijs-Van der WT, van AM, Koopmanschap MA, Rutten FF:
Unit costs of inpatient hospital days. Pharmacoeconomics 2003,
21:263-271.
15. Van der Kuy A: Farmacotherapeutisch Kompas 2000/2001
[Pharmacotherapeutic Compass 2000/2001] Amstelveen: College voor
zorgverzekeringen (CvZ) [Health Insurance Board] 2000.
16. Huiskes LG: Tarieflijst instellingen 2001 [Tariff list institutions 2001].
College Tarieven Gezondheidszorg (CTG) [National Health Tariffs Authority]
2000.
17. Roland M, Torgerson DJ: What are pragmatic trials? BMJ 1998, 316:285.
18. Ramsey S, Willke R, Briggs A, Brown R, Buxton M, Chawla A, Cook J, Glick H,
Liljas B, Petitti D, Reed S: Good research practices for cost-effectiveness
analysis alongside clinical trials: The ISPOR RCT-CEA task force report.
Value Health 2005, 8:521-533.
19. Koperna T: Cost-effectiveness of defunctioning stomas in low anterior
resections for rectal cancer: a call for benchmarking. Arch Surg 2003,
138:1334-1338.
20. Sznajder M, Aegerter P, Launois R, Merliere Y, Guidet B, CubRea : A cost-
effectiveness analysis of stays in intensive care units. Intensive Care Med
2001, 27:146-153.
21. Heyland DK, Konopad E, Noseworthy TW, Johnston R, Gafni A: Is it
‘worthwhile’ to continue treating patients with a prolonged stay (>14
days) in the ICU? An economic evaluation. Chest 1998, 114:192-198.
22. Moerer O, Schmid A, Hofmann M, Herklotz A, Reinhart K, Werdan K,
Schneider H, Burchardi H: Direct costs of severe sepsis in three German
intensive care units based on retrospective electronic patient record
analysis of resource use. Intensive Care Med 2002, 28:1440-1446.
23. Flaatten H, Kvale R: Cost of intensive care in a Norwegian University
hospital 1997-1999. Crit Care 2003, 7:72-78.
24. Hau T, Ohmann C, Wolmershauser A, Wacha H, Yang Q: Planned
relaparotomy vs relaparotomy on demand in the treatment of intra-
abdominal infections: The Peritonitis Study Group of the Surgical
Infection Society-Europe. Arch Surg 1995, 130:1193-1196.
25. Lamme B, Boermeester MA, Reitsma JB, Mahler CW, Obertop H, Gouma DJ:
Meta-analysis of relaparotomy for secondary peritonitis. Br J Surg 2002,
89:1516-1524.
26. Lamme B, Boermeester MA, de VR, van RO, van Till JW, Obertop H: Survey
among surgeons on surgical treatment strategies for secondary
peritonitis. Dig Surg 2003, 21:387-395.
27. van Goor H, Hulsebos RG, Bleichrodt RP: Complications of planned
relaparotomy in patients with severe general peritonitis. Eur J Surg 1997,
163:61-66.
28. Wacha H, Linder MM, Feldmann U, Wesch G, Gundlach E, Steifensand RA:
Mannheim Peritonitis Index: prediction of risk of death from peritonitis:
construction of a statistical and validation of an emperically based
index. Theor Surg 1987, 2:169-177.
29. Giesbers H: Beddencapaciteit ziekenhuizen. Volksgezondheid Toekomst
Verkenning, Nationale Atlas Volksgezondheid Bilthoven: RIVM 2003.
doi:10.1186/cc9032
Cite this article as: Opmeer et al.: Costs of relaparotomy on-demand
versus planned relaparotomy in patients with severe peritonitis: an
economic evaluation within a randomized controlled trial. Critical Care
2010 14:R97.
Submit your next manuscript to BioMed Central
and take full advantage of:
• Convenient online submission
• Thorough peer review
• No space constraints or color figure charges
• Immediate publication on acceptance
• Inclusion in PubMed, CAS, Scopus and Google Scholar
• Research which is freely available for redistribution
Submit your manuscript at
www.biomedcentral.com/submit
Opmeer et al. Critical Care 2010, 14:R97
/>Page 11 of 11