Báo cáo y học: " Bedside measurement of changes in lung impedance to monitor alveolar ventilation in dependent and non-dependent parts by electrical impedance tomography during a positive end-expiratory pressure trial in mechanically ventilated intensive
Bạn đang xem bản rút gọn của tài liệu. Xem và tải ngay bản đầy đủ của tài liệu tại đây (4.14 MB, 9 trang )
RESEARC H Open Access
Bedside measurement of changes in lung
impedance to monitor alveolar ventilation in
dependent and non-dependent parts by electrical
impedance tomography during a positive
end-expiratory pressure trial in mechanically
ventilated intensive care unit patients
Ido G Bikker
1
, Steffen Leonhardt
2
, Dinis Reis Miranda
1
, Jan Bakker
1
, Diederik Gommers
1*
Abstract
Introduction: As it becomes clear that mechanical ventilation can exaggerate lung injury, individual titration of
ventilator settings is of special interest. Electrical impedance tomography (EIT) has been proposed as a bedside,
regional monitoring tool to guide these settings. In the present study we evaluate the use of ventilation
distribution change maps (ΔfEIT maps) in intensive care unit (ICU) patients with or without lung disorders during a
standardized decremental positive end-expiratory pressur e (PEEP) trial.
Methods: Functional EIT (fEIT) images and PaO
2
/FiO
2
ratios were obtained at four PEEP levels (15 to 10 to 5 to
0cmH
2
O) in 14 ICU patients with or without lung disorders. Patients were pressure-controlled ve ntilated with
constant driving pressure. fEIT images made before each reduction in PEEP were subtracted from those recorded
after each PEEP step to evaluate regional increase/decrease in tidal impedance in each EIT pixel (ΔfEIT maps).
Results: The response of regional tidal impedance to PEEP showed a significant difference from 15 to 10 (P =
0.002) and from 10 to 5 (P = 0.001) between patients with and without lung disorders. Tidal impedance increased
only in the non-dependent parts in patients without lung disorders after decreasing PEEP from 15 to 10 cm H
2
O,
whereas it decreased at the other PEEP steps in both groups.
Conclusions: During a decremental PEEP trial in ICU patients, EIT measurements performed just above the
diaphragm clearly visualize improvement and loss of ventilation in dependent and non-dependent parts, at the
bedside in the individual patient.
Introduction
Mechanical ventilation is critical for the survival of most
patients with respiratory failure admitted to the ICU,
butithasbecomeclearthatitcanexaggeratelung
damage and may even be the primary factor in lung
injury [1]. Protective ventilatory strategies to minimize
this lung injury include reduction of tidal volume and
prevention or minimization of lung collapse and
overdistension by adequate setting of the positive end
expiratory pressure (PEEP) [2]. Currently, PEEP setting
is often guided by global lung parameters such as arter-
ial oxygenation or global compliance, which are not spe-
cific for regional lung collapse or overdistension [3]. If a
regional monitoring tool for lung collapse and overdis-
tension would be available at the bedside, this would aid
optimization of ventilator settings in individual patients.
Electrical impedance tomography (EIT) is a noninva-
sive, real-time imaging method that provides a cross-
sectional ventilation image of the lung [4-6]. It is based
* Correspondence:
1
Department of Intensive Care Medicine, Erasmus MC, ‘s-Gravendijkwal 230,
Rotterdam, 3015 GE, The Netherlands
Bikker et al. Critical Care 2010, 14:R100
/>© 2010 Bikker et al.; licensee BioMed Central Ltd. This is an open a ccess article distri buted under the terms of the Creative Commons
Attribu tion License ( which permits unrestricted use, distribution, and repro duction in
any medium, provided the original work is properly cited.
on the measurement of lung tissue impedance by injec-
tion of small currents and voltage measurements, using
electrodes on the skin surface. Recently, different studies
described ventilati on distribution change maps to evalu-
atelungcollapseoroverdistension [7-9]. Costa et al.
described the use of these ventilation distribution
change maps in two ICU patients [7]. They introduced
an algorithm in which ventilation at a PEEP level is
expressed as a percentage from maximal ventila tion as
seen after a lung recruitment maneuver. In lung -lavaged
pigs, Meier et al. composed functional EIT images or
ventilation distribution maps by subtracting the EIT
images from two PEEP levels to show improvement or
loss of regional ventilation between these two PEEP
levels [9]. As the clinically set PEEP is often guided by
decremental PEEP trials, it would be of interest to evalu-
ate the ventilation distribution change maps during this
procedure.
In the present study we evaluate the use of ventilation
distribution change maps in ICU patients with two dis-
tinct types of lung conditions: with or without lung dis-
orders during a standardize d decremental PEEP trial.
Furthermore we investigated if the EIT measurements at
the bedside may visualize alveolar recruitment and dere-
cruitment in the dependent and non-dependent lung
regions.
Materials and methods
Following approval by the local institutional human
investigations committee, patients were enrolled after
prov iding informed consent from their legal representa-
tives. The study population consisted of 14 mechanically
ventilated patients on a mixed ICU. In eight of these
patients, end-expirato ry lung volume was also measured
and these data have recently been published [10]. For all
14 pa tients, chest x-rays and, if available, CT-sca ns were
retrospectively evaluated and related to clinical history
and data to divide these patients into two groups; with-
out lung disorders (Group N) and with lung d isorders
(Group D). Patients were regarded to be without lung
disorders when no clinical signs of respiratory failure,
pneumonia or significant atelectasis were present. The
group with lung disorders was defined as PaO
2
/FiO
2
ratio <300 mmHg and proven pneumonia or abdominal
sepsis. All patients were well sedated and ventilated in
pressure-controlled mode, without spontaneous breath-
ing activity. All patients were ventilated with constant
driving pressures throughout the procedure, mean
applied driving pressure was 12 cm H
2
O (r ange 9 to 18)
inGroupNand16cmH
2
O(range12to21)inGroup
D. Exclusion criteria for participat ion in the study were:
pneumothorax, severe airflow obstruction due to
Chronic Obstructive Pulmonary Disease (COPD)
(defined as forced expired volume in 1 s or vital capacity
below predicted value minus 2 SD), lung trans planta-
tion, thoracic deformations and severe cardiovascular
instability.
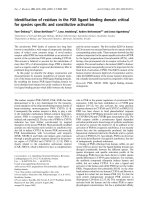
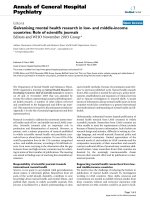
In all patients, impedance measurements were per-
formed during two minutes with a silicone belt with
16 integrated electrocardiographic electrodes placed
around the thoracic cage at the fifth or sixth intercos-
tal space (Figure 1), connected with an EIT device
(EIT evaluation kit 2, Dräger, Lübeck, Germany). EIT
data were gener ated by application of a small alternat-
ing electrical current of 5 mA at 50 kHz. After baseline
measurements at the clinical set ventilator settings
(Table 1), PEEP was increased to 15 cm H
2
O. After a
steady state of 15 minutes PEEP was de creased step-
wise each 10 minutes to 10, then to 5 and, if clinically
acceptable, to 0 cm H
2
O. The stability of each steady
state was evaluated by a stable end-expiratory EIT sig-
nal and a stable arterial saturation. Before th e end of
each PEEP level, EIT was measured during two min-
utes and hemodynamic and ventilatory parameters
were recorded. Dynamic compliance was calculated by
dividing expiratory tidal volume by the constant driv-
ing pressure set for each patient. In addition, arterial
blood gas analysis was performed (ABL 700, Radio-
meter, Copenhagen, Denmark) in order to calculate
the P aO
2
/FiO
2
ratio.
EIT data were stored and analyzed off line on a perso-
nal computer (Dell, P4, 2.4 GHz, Round Rock, Texas,
USA). The EIT scans consist of images o f impedance
with a 32 × 32 color-coded matrix relative to the lowest
impedance during the PEEP trial (rel. ΔZ). The differ-
ence between rel. ΔZattheendofinspirationand
expi ration is defined as tidal impedance variation (TIV).
This tidal impedance variation is visualized in the func-
tional EIT (fEIT) image, which co ntains tidal impedance
variation per pixel (32 × 32 matrix) aver aged over one
minute (Figure 1). For analysis of the regional distribu-
tion of ventilation, the EIT images were subdivided into
two symmetrical non-overlapping ventral to dorsal
oriented layers defined as dependent and non-dependent
regions of interest (ROI). fEIT images before each PEEP
step were subtracted from fEIT images at the end of the
next PEEP step to obtain ventilation change maps or
ΔfEIT images. This ΔfEIT image represents the change
in tidal impedance per pixel. With pressure-controlled
ventilation with constant driving pressure, the change in
tidal impedance per pixel represents the change in tidal
volume per pixel or pixel compliance [7]. A weighted
pixel count was used to evaluate total increase and
decrease in TIV between PEEP steps in the ΔfEIT
images and expressed as the percentage positive of total
impedance change by equation 1. In this equation a
value of 50% represents a balance between gain and loss
of TIV at a given PEEP step.
Bikker et al. Critical Care 2010, 14:R100
/>Page 2 of 9
%positive of total
positive
positive negative
Δ
Δ
ΔΔ
TIV
TIV
TIV
=
∑
∑
+
TTIV
∑
(1)
Statistical analysis
Statistical analysis was performed with Graphpad soft-
ware package (version 5.0, Graphp ad Software Inc., San
Diego, CA, USA). Due to the small number of patients,
results are expressed as medi an and interquartile range.
Regional compliance changes between each PEEP step
were evaluated with the Wilcoxon matched pair test.
EELV, PaO
2
/FiO
2
ratio and dynamic compliance was
evaluated using ANOVA for repeated measurements.
The percentage positive of the total tidal impedance
change during each PEEP step between both groups was
evaluated with the Mann-Whitney U test. For all com-
parisons, P <0.05 was considered significant.
Results
Table 1 presents data on the 14 mechanically ventilated
patients. Group N (n = 6) consisted of postoperative
patients (two transhiatal esophagectomy, one liver trans-
plantation and one kidney transplantation) without evi-
dence of pulmonary complications (n = 4), and patients
requiring ventilatory support after traumatic brain injury
Figure 1 Principle of electrical impedance tomography (EIT) and the functional EIT image (fEIT). Electrical excitation currents ar e applied
between pairs of adjacent surface electrodes (1 to 16); the resulting voltages are measured between the other electrodes (U). In the fEIT image,
impedance variation induced by the tidal volume is divided into a 32 × 32 matrix. Each pixel contains the individual tidal impedance variation,
creating an image of ventilation distribution. The ventral to dorsal oriented ROIs are marked in gray in the right panel.
Table 1 Data on patient characteristics
Without lung disorders (group N) With lung disorders
(group D)
P-value
Number of patients 6 8
Gender, female/male 3/6 3/8 ns
Age (years) 57 (6) 56 (15) ns
BMI 22.4 (1.8) 24.3 (5.5) ns
Time of mechanical ventilation (hours) 18.0 (12.5) 8.0 (16.3) ns
Baseline PEEP (cm H
2
O) 5.0 (0.0) 10.0 (1.0) 0.001
Baseline EELV (L) 1.65 (0.55) 1.2 (1.2) ns
Baseline PaO
2
/FiO
2
ratio, (kPa) 59.8 (8.4) 33.5 (6.7) <0.01
Baseline FiO
2
35.0 (3.8) 50.0 (10.0) <0.01
Baseline dynamic compliance (ml/cm H
2
O) 40.1 (12.3) 34.7 (15.6) ns
Reasons for mechanical ventilation -Postoperative (n = 4)
-Neurological (n = 2)
-Pneumonia (n = 5)
-Abdominal sepsis (n = 3)
Data are presented as median and (where appropriate) interquartile range. BMI, body mass index; PEEP, positive end-expiratory pressure; EELV, end-expiratory
lung volume; ns, nonsignificant.
Bikker et al. Critical Care 2010, 14:R100
/>Page 3 of 9
(n = 2). Group D (n = 8) consisted of patients with pneu-
monia (n = 5) and respiratory failure associated with
abdominal sepsis (n = 3). Eight patients were measured
at a PEEP of 15, 10 and 5 cm H
2
Oandsixpatientsata
PEEP of 15, 10, 5 and 0 cm H
2
O. Respiratory data during
the PEEP step s are present ed in Table 2. One patient in
the group without lung disorders had a transient drop in
blood pressure at PEEP 15 cm H
2
O and measurements
were continued at 10 PEEP cm H
2
O. All other patients
tolerated the PEEP trial well.
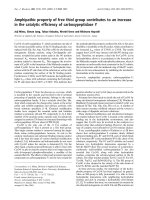
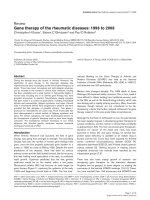
Figure 2 exemplarily shows the effect of PEEP on
regional ventilation in a patient with lung disorder and
in a patient without lung disorder. The ventilation dis-
tribution is presented as ventilation distribution maps
(fEIT) at each PEEP level and ventilation distribution
change maps (ΔfEIT) between PEEP levels. A clear dif-
ference can be seen in response to the change in PEEP
in the non-d ependent and dependent lung regions
between these two patients (Figure 2).
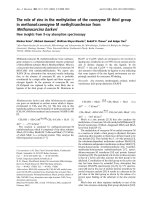
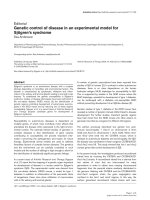
In Figure 3, the tidal impedance per cm H
2
Odriving
pressure is presented for two ventral to dorsal ROIs at
all PEEP levels. In both groups, tidal impedance
decreased towards 0 cm H
2
O PEEP. However, this was
different for the individual ROIs. In Group N, tidal
impedance increased in the non-dependent ROI after
decreasing PEEP from 15 to 10 cmH
2
O, whereas
decreased in the dependen t ROI during each PEEP step.
In Group D, tidal impedance variation was significantly
lower compared to Group N in both regions. Further,
tidal impedance did not change in the non-dependent
region between PEEP steps 15 to 10 and 5 to 0 and in
the dependent region between PEEP step 5 to 0. Tidal
impedance decreased significantly during the other
PEEP changes.
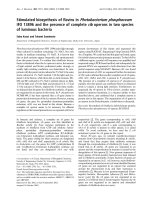
The ΔfEIT images between PEEP steps for the indivi-
dual patient are shown in Figure 4. In this figure, also
the change in PaO
2
/FiO
2
ratio and change in dynamic
compliance during each PEEP step is presented.
In Figure 5 the total impedance change is shown for
each PEEP step. Only during the PEEP step from 15 to
10 the increase was higher than the decrease whereas in
all other step the decrease was more than the increase.
In all patients, the response of regional tidal impedance
to PEEP showed a significant difference from 15 to
10 cm H
2
O(P = 0.002) and from 10 to 5 cm H
2
O
(P = 0.001) between patients with and without lung dis-
orders (Figure 5).
Discussion
This trial shows that EIT is suitable for bedside moni-
toring of tidal impedance or regional compliance during
decremental PEEP steps and can differentiate between
dependent and non-dependent lung regions. There was
a significant difference in response to a stepwise
decrease in PEEP between patients with and without
lung disorders, indicating a different PEEP depend ency
between these two groups.
Using EIT, increase or decrease of tidal impedance
variation b ecomes visible in ΔfEIT maps (Figure 4).
During a decremental PEEP trial, as used in the present
study, improvement in tidal impedance var iation can be
caused by recruitment of non-ventilated collapsed
alveoli or increased ventilation in previously overdis-
tended alveoli. To obtain an equal balance between
derecruitment and overdistension, a value of 50%
increase of the total tidal impedance change per ΔfEIT
map could be used during decremental PEEP steps. If
this value is above 50%, more reduction in overdisten-
tion compared to increase in derecruitment is present,
whereas below 50%, derecruitment is predominant in
the measured EIT slice. In the group without lung dis-
orders, total tidal impedance increased after reducing
thePEEPfrom15andfrom10cmH
2
O; this was due
to increased tidal impedance variation in the ventral
lung regions, with less loss in the dorsal lung regions
(Figures 3 and 5). This indicates that during 15 cm
H
2
O of PEEP alveoli in the ventral part were inflated
throughout the ventilatory cycle or overdistended and
after lowering the PEEP to 10 cm H
2
O ventilation
increased in the non-dependent part. In this group,
Table 2 Respiratory parameters during the decremental PEEP steps
PEEP [cm H
2
O] 15 10 5 0 Significance between groups
EELV (L) N 2.3 (0.3) 2.2 (0.2) 1.8 (0.2)* 1.5 (0.2)
D 1.9 (1.0) 1.6 (1.0)* 1.3 (0.8)* 1.2 (0.6) P =NS
PaO
2
/FiO
2
(kPa) N 62.3 (1.9) 63.7 (9.4)* 58.3 (13.9) 50.3 (13.8)
D 37.9 (10.5) 39.0 (8.6) 33.5(15.2) 26.8 (5.1) P <0.01
Cdyn
(ml/cm H
2
O)
N 38.6 (7.4) 45.0 (4.5) 45.0 (4.6) 41.0 (1.2)
D 34.1 (11.0) 37.0 (12.6)* 35.0 (13.3)* 29.0 (7.1) P =NS
Data are presented as median and (where appropriate) interquartile range. N, without lung disorders, D, with lung disorders. PEEP, positive end-expiratory
pressure; EELV, end-expiratory lung volume; Cdyn, dynamic compliance. Asterisk represents significance within groups vs. 15 cm H
2
O.
Bikker et al. Critical Care 2010, 14:R100
/>Page 4 of 9
after further lowering the PEEP from 10 to 5 cm H
2
O,
tidal impedance increase in the ventral part was
exceeded by loss of the tidal impedance in the dorsal
part; total impedance change was below 50% during this
latter PEEP step (Figure 5). In the group with lung
disorders, for each PEEP step there was less increase of
tidal impedance in the ventral lung regions and more
decrease in tidal impe dance in the dorsal regions; total
positive impedance change was below 50% for each
PEEP step (Figure 5). Therefore, in order to prevent
Figure 2 The effect of a decremental PEEP trial on regional ventilation shown in two representative patients. The functional EIT (fEIT)
image at the different PEEP levels (15 to 10 to 5 to 0 cm H
2
O) shows the ventilation distribution in a colour-coded matrix in a patient without
lung disorders and a patient with lung disorders. The ΔfEIT images are created by subtracting fEIT before the PEEP step from fEIT after each PEEP
step. The increase or decrease in regional ventilation between PEEP (ΔfEIT) steps is displayed in a color-coded matrix. Each EIT image represents
a thoracic slice with the ventral lung regions at the top and dorsal lung regions at the bottom.
Bikker et al. Critical Care 2010, 14:R100
/>Page 5 of 9
alveolar collapse in the dorsal part in this caudal thor-
acic EIT level, a higher PEEP level should be used in
these patients with lung disorders compared to the
group without lung disorders (Figures 3 and 5).
EIT is able to show the effect of PEEP on tidal impe-
dancechangeineachpixelofthefunctionalimage
matrix. If one accepts the proposed linear relationship
between impedance and tidal volume [11-13], the
Δimpedance per pixel reflects Δtidal volume in the indi-
vidual pixel. During pressure-controlled ventilation, t he
volume change with constant driving pressure or by div-
ing impedance by the driving pressure can be regarded
as regional compliance change in each pixel [7].
In the present study, each patient showed an indivi-
dual response in tidal impedance change during each
stepwise decrease in PEEP, and the response differs
between dependent and non-dependent lung regions
(Figure 4). This is in accordance with the common
understanding of gravity-dependent tidal volume dist ri-
butions in acute lung injury and acute respiratory dis-
ease syndrome [14,15]. While the PEEP setting is often
guided by global compliance measurements [16-18] or
pressure-volume curve analysis [19,20], thes e global
indicators cannot discriminate between the dependent
and non-dependent lung regions. EIT is capable of
monitoring regional ventilation d istribution at the bed-
side [21-23]. Setting PEEP by the use of tidal impedance
or regional compliance requires a definition of the ‘opti-
mal’ PEEP with regard to the balance between
decreased alveolar surface stress and increased alveolar
collapse during stepwise decrease in PEEP. In order to
minimize ventilato r-induced l ung injury [24], it is
proposed that the lung should be opened by a recruit-
ment maneuver and thereafter a relatively adequate
PEEP should be used to keep the lung open, with the
lowest inspiratory airway pressure to prevent alveolar
overdistention [25]. In the present study, we did not use
a recruitment maneuver; however, we have s hown that
a compromise must be found between lowering alveolar
overdistention in the non-dependent part and preven-
tion of alveolar collapse in the dependent part. If opti-
mal PEEP is defined as an equal balance between
increase and decrease in tidal impedance, at this thor-
acic EIT level o ptimal PEEP would be in the studied
patients around 10 cm H
2
O in patients wit hout lung
disorders, and at least 15 cm H
2
O in patients with lung
disorders (Figure 5). Because EIT is now able to ade-
quately visualize regional change in ventilation, a defini-
tion is needed if this method is used to set the optimal
PEEP. In the future, three-dimensional EIT could help
to monitor the entire lung.
A potential limitation of the present study is that EIT
measures an eclipse with a central diameter of 5 to
10 cm. The individual pixel in the EIT matrix contains
a vast number o f alveoli; during tidal ventilation and/or
stepwise change in PEEP, different alveoli might be
included in the EIT pixel. However, because the indivi-
dual pixel contains alveoli from the same lung region, it
is unlikely to influence the results of this study. In the
present study, we didn’t compare our findings to
another imaging technique like CT scanning. However,
Meier et al. used the same method in an experimental
animal study and showed good agreement between CT
and regional ventilation [9]. In addition, for future
Figure 3 Changes in regional compliance in pat ients without (left) and patients with (right) lung disorders. During pressure-contr olled
ventilation with constant driving pressure, the tidal impedance change per pixel can be regarded as regional compliance change per pixel. The
open triangle represents the dependent lung region and the open circle represents the non-dependent lung region at the different used PEEP
levels. Data are presented as mean and SEM. Significance: * P <0.05; ** P <0.01.
Bikker et al. Critical Care 2010, 14:R100
/>Page 6 of 9
studies smaller decremental PEEP steps should be cho-
sen in order to establish the optimum PEEP setting for
each individual patient.
Conclusions
We conclude that during a decremental PEEP trial in
ICU patients, EIT measurements performed just above
the diaphragm clearly visualize improvement or loss of
ventilation in dependent and non-dependent parts, at
the bedside in the individual patient. There was a
sig nificant difference in response to a stepwise decrease
in PEEP between patients with and without lung disor-
ders, indicating a different PEEP dependency between
these two groups. However, the individual response to
the decrease of PEEP within the groups was also differ-
ent indicating that optimal PEEP should be titrated indi-
vidually and can not b e generalized for a group of
patients. In addition, the response to the decrease of
PEEP was different between dependent and non-de pen-
dent lung regions within a patient, suggesting that
Figure 4 ΔfEIT images in patients without (1 to 6) and with (8 to 14) lung disorders between the PEEP steps used.PaO
2
/FiO
2
ratio
change (black) and compliance change (red) are presented next to each ΔfEIT image. Images containing a colour-coded 32 × 32 matrix, are
generated by subtracting fEIT before the PEEP step from fEIT after each PEEP step. PEEP is decreased stepwise from 15 to 0 cm H
2
O. Each EIT
image represents a thoracic slice with the ventral lung regions at the top and dorsal lung regions at the bottom.
Bikker et al. Critical Care 2010, 14:R100
/>Page 7 of 9
optimal PEEP may be defined as an equal balance
between increase and decrease in tidal impedance. This
definition of the optimal PEEP in order to minimize
VILI needs further research to prove its benefit.
Key messages
• EIT is suitable for bedside monitoring of tidal
impedance or regional compliance during decremen-
tal PEEP steps and can differentiate between depen-
dent and non-dependent lung regions.
• During a decremental PEEP trial in ICU patients,
EIT measurements performed just above the dia-
phragm clearly visualize improvement and loss of
ventilation in dependent and non-dependent parts,
at the bedside in the individual patient.
• D ifferences in response to decremental PEEP steps
were found not only between patient groups, but
also within groups indicating that the optimal PEEP
should be titrated individually and can not be gener-
alized for a group of patients.
• A definition of the optimal EIT PEEP is needed if
this technique is going to be used in the clinical
setting.
Abbreviations
COPD: Chronic Obstructive Pulmonary Disease; CT: computed tomography;
EIT: Electrical Impedance Tomography; fEIT: functional EIT; ΔfEIT: functional
EIT images subtracted pixelwise from each other; Group D: group with lung
disorders; Group N: group without lung disorders; ICU: intensive care unit;
PEEP: positive end-expiratory pressure; ROI: region of interest; TIV: tidal
impedance variation; ΔZ: mpedance change.
Acknowledgements
The EIT equipment was supplied by Dräger Medical AG, Lübeck, Germany.
The authors thank Laraine Visser-Isles for English language editing.
Author details
1
Department of Intensive Care Medicine, Erasmus MC, ‘s-Gravendijkwal 230,
Rotterdam, 3015 GE, The Netherlands.
2
Helmholz-Institute for Biomedical
Engineering, RWTH Aachen University, Pauwelsstraße 20, Aachen, D-52074,
Germany.
Authors’ contributions
IB carried out the data acquisition, analysis, statistical analysis and
par ticipated in drafting the manuscript. DRM participated in the statistical
analysis and in drafting the manusc ript . DG participated in the data
acquisitio n and in drafting the manuscript. SL and JB participated in
drafting the m anuscri pt. All authors read and approved the final
manuscript.
Competing interests
The authors declare that they have no competing interests.
Received: 26 November 2009 Revised: 14 February 2010
Accepted: 30 May 2010 Published: 30 May 2010
References
1. Ricard JD, Dreyfuss D, Saumon G: Ventilator-induced lung injury. Curr Opin
Crit Care 2002, 8:12-20.
2. ARDSnet: Ventilation with lower tidal volumes as compared with
traditional tidal volumes for acute lung injury and the acute respiratory
distress syndrome. The Acute Respiratory Distress Syndrome Network. N
Engl J Med 2000, 342:1301-1308.
3. Cressoni M, Caironi P, Polli F, Carlesso E, Chiumello D, Cadringher P,
Quintel M, Ranieri VM, Bugedo G, Gattinoni L: Anatomical and functional
intrapulmonary shunt in acute respiratory distress syndrome. Crit Care
Med 2008, 36:669-675.
4. Frerichs I, Dargaville PA, Dudykevych T, Rimensberger PC: Electrical
impedance tomography: a method for monitoring regional lung
aeration and tidal volume distribution? Intensive Care Med 2003,
29:2312-2316.
5. Hedenstierna G: Using electric impedance tomography to assess regional
ventilation at the bedside. Am J Respir Crit Care Med 2004, 169:777-778.
6. Putensen C, Wrigge H, Zinserling J: Electrical impedance tomography
guided ventilation therapy. Curr Opin Crit Care 2007, 13:344-350.
7. Costa EL, Borges JB, Melo A, Suarez-Sipmann F, Toufen C Jr, Bohm SH,
Amato MB: Bedside estimation of recruitable alveolar collapse and
hyperdistension by electrical impedance tomography. Intensive Care Med
2009, 35:1132-1137.
Figure 5 Response to decremental PEEP steps on tidal impedance change in patients with or without lung disorders. During pressure-
controlled ventilation with constant driving pressure, the tidal impedance change per pixel can be regarded as regional compliance change per
pixel. The percentage positive of the total Δtidal impedance is calculated from the total increase and total decrease in each Δfunctional EIT
image. Data are presented as median and interquartile range.
Bikker et al. Critical Care 2010, 14:R100
/>Page 8 of 9
8. Frerichs I, Hinz J, Herrmann P, Weisser G, Hahn G, Dudykevych T, Quintel M,
Hellige G: Detection of local lung air content by electrical impedance
tomography compared with electron beam CT. J Appl Physiol 2002,
93:660-666.
9. Meier T, Luepschen H, Karsten J, Leibecke T, Grossherr M, Gehring H,
Leonhardt S: Assessment of regional lung recruitment and derecruitment
during a PEEP trial based on electrical impedance tomography. Intensive
Care Med 2008, 34:543-550.
10. Bikker IG, van Bommel J, Reis Miranda D, Bakker J, Gommers D: End-
expiratory lung volume during mechanical ventilation: a comparison to
reference values and the effect of PEEP in ICU patients with different
lung conditions. Crit Care 2008, 12:R145.
11. Adler A, Amyot R, Guardo R, Bates JH, Berthiaume Y: Monitoring changes
in lung air and liquid volumes with electrical impedance tomography. J
Appl Physiol 1997, 83:1762-1767.
12. Erlandsson K, Odenstedt H, Lundin S, Stenqvist O: Positive end-expiratory
pressure optimization using electric impedance tomography in morbidly
obese patients during laparoscopic gastric bypass surgery. Acta
Anaesthesiol Scand 2006, 50:833-839.
13. Lindgren S, Odenstedt H, Olegard C, Sondergaard S, Lundin S, Stenqvist O:
Regional lung derecruitment after endotracheal suction during volume-
or pressure-controlled ventilation: a study using electric impedance
tomography. Intensive Care Med 2007, 33:172-180.
14. Gattinoni L, Pelosi P, Crotti S, Valenza F: Effects of positive end-expiratory
pressure on regional distribution of tidal volume and recruitment in
adult respiratory distress syndrome. Am J Respir Crit Care Med 1995,
151:1807-1814.
15. Luecke T, Meinhardt JP, Herrmann P, Weiss A, Quintel M, Pelosi P: Oleic
acid vs saline solution lung lavage-induced acute lung injury: effects on
lung morphology, pressure-volume relationships, and response to
positive end-expiratory pressure. Chest 2006, 130:392-401.
16. Maisch S, Reissmann H, Fuellekrug B, Weismann D, Rutkowski T, Tusman G,
Bohm SH: Compliance and dead space fraction indicate an optimal level
of positive end-expiratory pressure after recruitment in anesthetized
patients. Anesth Analg 2008, 106:175-81.
17. Suarez-Sipmann F, Bohm SH, Tusman G, Pesch T, Thamm O, Reissmann H,
Reske A, Magnusson A, Hedenstierna G: Use of dynamic compliance for
open lung positive end-expiratory pressure titration in an experimental
study. Crit Care Med 2007, 35:214-221.
18. Suter PM, Fairley B, Isenberg MD: Optimum end-expiratory airway
pressure in patients with acute pulmonary failure. N Engl J Med 1975,
292:284-289.
19. Amato MB, Barbas CS, Medeiros DM, Magaldi RB, Schettino GP, Lorenzi-
Filho G, Kairalla RA, Deheinzelin D, Munoz C, Oliveira R, Takagaki TY,
Carvalho CR: Effect of a protective-ventilation strategy on mortality in
the acute respiratory distress syndrome. N Engl J Med 1998, 338:347-354.
20. Maggiore SM, Richard JC, Brochard L: What has been learnt from P/V
curves in patients with acute lung injury/acute respiratory distress
syndrome. Eur Respir J Suppl
2003, 42:22s-26s.
21. Frerichs I, Schmitz G, Pulletz S, Schadler D, Zick G, Scholz J, Weiler N:
Reproducibility of regional lung ventilation distribution determined by
electrical impedance tomography during mechanical ventilation. Physiol
Meas 2007, 28:S261-S267.
22. Frerichs I, Dargaville PA, van Genderingen H, Morel DR, Rimensberger PC:
Lung volume recruitment after surfactant administration modifies spatial
distribution of ventilation. Am J Respir Crit Care Med 2006, 174:772-779.
23. Victorino JA, Borges JB, Okamoto VN, Matos GF, Tucci MR, Caramez MP,
Tanaka H, Sipmann FS, Santos DC, Barbas CS, Carvalho CR, Amato MB:
Imbalances in regional lung ventilation: a validation study on electrical
impedance tomography. Am J Respir Crit Care Med 2004, 169:791-800.
24. Pinhu L, Whitehead T, Evans T, Griffiths M: Ventilator-associated lung
injury. Lancet 2003, 361:332-340.
25. Lachmann B: Open up the lung and keep the lung open. Intensive Care
Med 1992, 18:319-321.
doi:10.1186/cc9036
Cite this article as: Bikker et al.: Bedside measurement of changes in
lung impedance to monitor alveolar ventilation in dependent and non-
dependent parts by electrical impedance tomography during a positive
end-expiratory pressure trial in mechanically ventilated intensive care
unit patients. Critical Care 2010 14:R100.
Submit your next manuscript to BioMed Central
and take full advantage of:
• Convenient online submission
• Thorough peer review
• No space constraints or color figure charges
• Immediate publication on acceptance
• Inclusion in PubMed, CAS, Scopus and Google Scholar
• Research which is freely available for redistribution
Submit your manuscript at
www.biomedcentral.com/submit
Bikker et al. Critical Care 2010, 14:R100
/>Page 9 of 9