Báo cáo y học: " Pulse-pressure variation and hemodynamic response in patients with elevated pulmonary artery pressure: a clinical study" ppt
Bạn đang xem bản rút gọn của tài liệu. Xem và tải ngay bản đầy đủ của tài liệu tại đây (807.46 KB, 9 trang )
Wyler von Ballmoos et al. Critical Care 2010, 14:R111
/>Open Access
RESEARCH
© 2010 Wyler von Ballmoos, et al.; licensee BioMed Central Ltd. This is an open access article distributed under the terms of the Creative
Commons Attribution License ( which permits unrestricted use, distribution, and repro-
duction in any medium, provided the original work is properly cited.
Research
Pulse-pressure variation and hemodynamic
response in patients with elevated pulmonary
artery pressure: a clinical study
Moritz Wyler von Ballmoos
1
, Jukka Takala
1
, Margareta Roeck
1
, Francesca Porta
1
, David Tueller
1
, Christoph C Ganter
1
,
Ralph Schröder
1
, Hendrik Bracht
1
, Bertram Baenziger
2
and Stephan M Jakob*
1
Abstract
Introduction: Pulse-pressure variation (PPV) due to increased right ventricular afterload and dysfunction may
misleadingly suggest volume responsiveness. We aimed to assess prediction of volume responsiveness with PPV in
patients with increased pulmonary artery pressure.
Methods: Fifteen cardiac surgery patients with a history of increased pulmonary artery pressure (mean pressure, 27 ± 5
mm Hg (mean ± SD) before fluid challenges) and seven septic shock patients (mean pulmonary artery pressure, 33 ±
10 mm Hg) were challenged with 200 ml hydroxyethyl starch boli ordered on clinical indication. PPV, right ventricular
ejection fraction (EF) and end-diastolic volume (EDV), stroke volume (SV), and intravascular pressures were measured
before and after volume challenges.
Results: Of 69 fluid challenges, 19 (28%) increased SV > 10%. PPV did not predict volume responsiveness (area under
the receiver operating characteristic curve, 0.555; P = 0.485). PPV was ≥13% before 46 (67%) fluid challenges, and SV
increased in 13 (28%). Right ventricular EF decreased in none of the fluid challenges, resulting in increased SV, and in
44% of those in which SV did not increase (P = 0.0003). EDV increased in 28% of fluid challenges, resulting in increased
SV, and in 44% of those in which SV did not increase (P = 0.272).
Conclusions: Both early after cardiac surgery and in septic shock, patients with increased pulmonary artery pressure
respond poorly to fluid administration. Under these conditions, PPV cannot be used to predict fluid responsiveness.
The frequent reduction in right ventricular EF when SV did not increase suggests that right ventricular dysfunction
contributed to the poor response to fluids.
Introduction
A main goal of cardiovascular support is to restore and
maintain sufficient cardiac output. Whereas prompt
treatment of hypovolemia is necessary to sustain tissue
perfusion, too much volume administration may result in
edema formation and impaired tissue perfusion, with
consequent organ dysfunction and increased risk of death
[1-5]. Because blood volume cannot reliably be assessed
clinically [6-11], the hemodynamic response to a volume
challenge is commonly used to guide fluid management.
Pulse-pressure variation (PPV), reflecting variations in
stroke volume, has been advocated to discriminate
between patients whose stroke volume increases in
response to volume expansion and those who do not
respond [12]. Conversely, PPV due to increased right ven-
tricular afterload and right ventricular dysfunction may
misleadingly suggest volume responsiveness [13-15].
Increased pulmonary artery pressure and moderate or
transient right ventricular dysfunction are not rare in
intensive care patients requiring hemodynamic support.
For example, transient right ventricular dysfunction
occurs after cardiac surgery [16,17], and high pulmonary
artery pressures and dysfunction of both ventricles are
common in septic shock [18,19].
We hypothesized that PPV does not predict volume
responsiveness in the presence of increased pulmonary
* Correspondence:
1
Department of Intensive Care Medicine, Bern University Hospital and
University of Bern (Inselspital), Freiburgstrasse 10, 3010 Bern, Switzerland
Full list of author information is available at the end of the article
Wyler von Ballmoos et al. Critical Care 2010, 14:R111
/>Page 2 of 9
artery pressure, and that right ventricular dysfunction
may contribute to this. To test this hypothesis, we mea-
sured PPV and the hemodynamic response to clinically
indicated fluid challenges in patients with septic shock
and in postoperative cardiac surgery patients with
increased pulmonary artery pressure.
Materials and methods
The study was approved by the Ethics Committee of the
Canton of Bern. Written informed consent was obtained
from 20 cardiac surgery patients with a preoperative his-
tory of increased pulmonary artery pressure, and from
both an independent physician and a close family mem-
ber of 10 patients in septic shock.
Inclusion criteria
Cardiac surgery patients were included if they had an
increased pulmonary artery pressure, as estimated during
a preoperative echocardiogram (peak pulmonary artery
pressure, ≥40 mm Hg) or a history of right ventricular
myocardial infarction or right heart failure, and a clinical
indication for a pulmonary artery catheter periopera-
tively, as judged by the patient's cardiac anesthetist, who
was not involved in the study.
Patients with septic shock had septic shock defined as
three of four systemic inflammatory-response syndrome
criteria: (a) hyperthermia (≥38°C) or hypothermia
(≤5.6°C); (b) tachycardia (heart rate, ≥90 beats/min); (c)
tachypnea (respiratory rate, ≥20 breaths/min) or need for
mechanical ventilation; and (d) leukocytosis (white blood
cell count, ≥10 × 10
3
per microliter) or leucopenia (white
blood cell count, ≤3 × 10
3
per microliter), and mean
blood pressure < 60 mm Hg, despite volume resuscita-
tion, or need for vasopressors to keep mean blood pres-
sure ≥60 mm Hg. In addition, the patient had to have a
clinically indicated pulmonary artery catheter ordered by
the clinical team treating the patient.
All patients were receiving controlled mechanical ven-
tilation with a tidal volume of 8-10 ml/kg and a ventila-
tory frequency that resulted in a normal arterial pCO
2
.
Exclusion criteria
Patients with severe mitral valve insufficiency were
excluded.
Measurement of cardiac output, stroke volume, right-
ventricular end-diastolic volume and ejection fraction, and
blood pressures
A volumetric pulmonary artery catheter (Edwards
Combo V Catheter, Edwards Lifesciences LLC, Irvine,
CA, USA) and cardiac output monitor (Vigilance,
Edwards Lifesciences) were used to measure cardiac out-
put, pulmonary artery pressures, and right ventricular
ejection fraction and end-diastolic volume. Systemic and
pulmonary artery and central venous pressures were
recorded with quartz pressure transducers and displayed
continuously on a multimodular monitor (Merlin; Hewl-
ett Packard, Geneva, Switzerland). The pressure trans-
ducers were zeroed to the level of the heart. Heart rate
was measured from the electrocardiogram (ECG), which
was continuously monitored. Only the variables routinely
available by using the patient-monitoring devices were
made available to and were used by the clinical team.
For the study purposes, the intravascular pressures and
heart rate were also recorded at 50 Hz on a computer
using AcqKnowledge software (version 3.8.1; Biopac Sys-
tems, Goleta, CA, USA), and variables from the continu-
ous cardiac-output monitor/mixed venous oxygen-
saturation monitor (Vigilance; Edwards Lifesciences)
were recorded with a frequency of 0.5 Hz on the same
computer by using the serial output from the monitor
and a proprietary research software (Edwards Life-
sciences) and analyzed off-line.
Study protocol
If the intensivist in charge of the care of the patient con-
sidered a volume challenge to be clinically indicated, 200
ml of hydroxyethyl starch (Voluven 6%, Fresenius Kabi
AG, Stans, Switzerland) were infused over a 10-minute
period. The study personnel performed hemodynamic
measurements immediately before and between 15 and
20 minutes after the end of the volume challenge. The
ventilator airway-pressure signal on the ventilator screen
and the end-tidal CO
2
signal displayed on the monitor
were visually observed, and fluid challenges were
included only if signs of spontaneous respiratory efforts
were absent.
The semicontinuous cardiac-output values were
obtained from the values captured from the serial port of
the device (equivalent to STAT mode). For each variable,
artifact-free 2-minute mean values were used for analysis.
The main reason(s) that the clinician in charge of the
patient considered the fluid challenge necessary was
recorded.
Assessment of pulse-pressure variation
PPV analysis was performed on the arterial pressure
curve of 20 consecutive heart beats by using the following
algorithm (20): PPV (%) = 100 × (Pp
max
- Pp
min
)/((Pp
max
+
Pp
min
)/2). Only recordings made during volume-con-
trolled mechanical ventilation were analyzed. Each beat-
to-beat tracing of intravascular central venous and pul-
monary artery pressures was independently assessed by
two senior investigators (SJ and JT, blinded for the
response to volume challenge) to verify the absence of
any spontaneous respiratory activity.
Wyler von Ballmoos et al. Critical Care 2010, 14:R111
/>Page 3 of 9
Evaluation of volume response
Changes in stroke volume (SV) were used to define
response to volume challenge. An increase in stroke vol-
ume exceeding 10% after the volume challenge was con-
sidered a positive response. The volume challenge should
increase the SV as a result of acutely increased preload in
a heart operating on the steep portion of the cardiac-
function curve [20,21]. The results were therefore ana-
lyzed in two ways: including all volume challenges, and
including only those resulting in an increase in central
venous pressure (CVP) of > 1 mm Hg. The directional
changes in right ventricular ejection fraction and end-
diastolic volume in response to volume challenge were
separately analyzed for the responders and nonre-
sponders.
Statistics
To assess differences in proportions between groups of
patients, Fisher's Exact test was used. The effect of a vol-
ume challenge on hemodynamic variables was assessed
with ANOVA for repeated measurements by using one
within-subject factor (hemodynamic variable) and two
between-subject factors (responder versus nonresponder
with respect to stroke volume, and diagnosis). With this
approach, a different response of a given hemodynamic
variable in responders versus nonresponders is indicated
by a fluid challenge-responder interaction, and a differ-
ence in the behavior of responders versus nonresponders
in the two patient groups is indicated by a fluid challenge/
responder/diagnosis interaction. Receiver operating
characteristic (ROC) curves were constructed to evaluate
the predictive value of PPV. Best predictive threshold was
defined as the highest sum of sensitivity and specificity.
Data are presented as median and interquartile range
(demographics and ventilator settings), as percentage
(proportional data), and as mean ± SD (hemodynamic
variables). A P value < 0.05 was considered statistically
significant.
Results
Four cardiac surgery patients and two septic shock
patients were excluded from the data analysis because of
cardiac dysrhythmia during the study. Further, one car-
diac surgery and one septic shock patient were excluded
because of continuous spontaneous respiratory activity.
Accordingly, 15 postoperative cardiac surgery patients
and seven patients with septic shock were analyzed.
Patient data are indicated in Table 1.
Sixty-nine fluid challenges were performed (44 in car-
diac surgery patients and 25 in septic shock patients; one
to eight per patient). The most common indications for
fluid challenge were hypotension and peripheral vaso-
constriction (Additional file 1).
Baseline hemodynamics (before the first fluid chal-
lenge) were similar in cardiac surgery and septic patients
(Table 2). Overall, the fluid challenges increased stroke
volume, CVP, pulmonary artery occlusion pressure
(PAOP), and systemic and pulmonary arterial pressures
(Table 3).
Nineteen (28%) of the 69 fluid challenges increased SV
in 12 patients: in cardiac surgery patients, 12 of 44 fluid
challenges (27%; seven patients) and in septic shock,
seven of 25 fluid challenges (28%; five patients). If only
fluid challenges that increased CVP by > 1 mm Hg are
considered (31 of 44 fluid challenges in cardiac surgery
and 22 of 25 in septic shock), SV increased in 15 (28%) of
53 fluid challenges.
Pulse-pressure variation and volume responsiveness
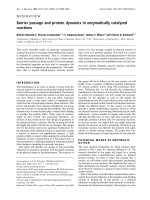
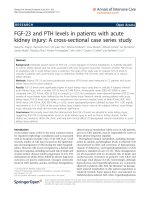
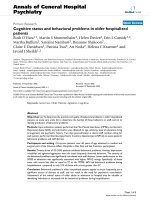
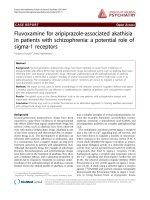
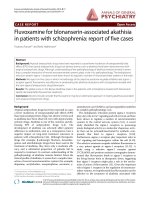
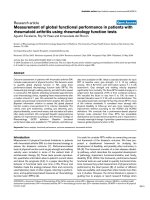
PPV did not predict an increase in SV. The area under the
ROC curve (AUC; Figures 1,2,3) was 0.555 for the whole
patient cohort, 0.539 for the cardiac surgery patients, and
0.587 for the septic shock patients (all P > 0.05).
Inclusion of only the first fluid challenge from each
patient (n = 22) revealed 23% responders (n = 5). The area
under the ROC curve for predicting a positive response
by PPV was 0.447 in this case (P = 0.724). Inclusion of
only those fluid challenges with CVP increase did not
improve the prediction of increase in SV (AUC, 0.509).
The threshold value for best prediction (albeit not signifi-
cant) for all volume challenges was 21%.
The data were further analyzed by using a PPV thresh-
old of ≥13%, based on other studies [22-26], and the mean
threshold of 12.5% reported in a systematic review [27].
PPV was ≥13% before 46 (66%) fluid challenges: in 27
(60%) of those in cardiac surgery and in 19 (76%) in septic
shock. SV increased in 13 (28%) fluid challenges: in seven
(26%) in cardiac surgery and in six (32%) in septic shock.
PPV was < 13% before 24 fluid challenges, and SV
increased in six (25%) of them. The absolute PPV before
all fluid challenges was 15 ± 13 mm Hg in cardiac surgery
patients and 21 ± 18 mm Hg in sepsis patients (ns).
Right ventricular ejection fraction decreased in none of
the fluid challenges resulting in increased SV, and in 44%
of those in which SV did not increase (P = 0.0003). EDV
increased in 28% of fluid challenges resulting in increased
SV and in 45% of those in which SV did not increase (P,
not significant).
Discussion
The main finding of this study was the lack of association
between PPV and volume responsiveness in patients with
increased pulmonary artery pressure. This was the case
both in postoperative cardiac surgery patients and in
patients with septic shock, despite the very different
underlying circulatory pathology. Enhanced pulse-pres-
sure variation was present before most of the clinically
Wyler von Ballmoos et al. Critical Care 2010, 14:R111
/>Page 4 of 9
indicated fluid challenges. Despite this, only about one of
four fluid challenges resulted in increased stroke volume.
The association was no better if only those fluid chal-
lenges were considered that were preceded by pulse-pres-
sure variation of ≥13%, a threshold proposed by several
authors, and approximately the mean value (12.5%) found
in a recent systematic review [27].
Our results are in sharp contrast to those of several pre-
vious studies in septic and postoperative patients, in
which pulmonary artery pressure was either not
increased or not reported [6,22-26,28-33], or in which
pulmonary artery pressure was markedly less increased
[12,34-36]. Recently, Mahjoub et al. [15] reported a fail-
ure to predict fluid responsiveness by PPV in patients
who had echocardiographic findings suggesting right
ventricular systolic dysfunction without overt signs of
right ventricular failure. We selected patients at relevant
risk of acute right ventricular dysfunction due to
increased pulmonary artery pressure. Our finding of
reduced right ventricular ejection fraction in almost half
of the nonresponders and in none of the responders sup-
ports the concept that right ventricular dysfunction con-
tributed to the poor predictive value of PPV. Admittedly,
the reliability of right ventricular ejection fraction estima-
tion by using thermodilution catheters is controversial.
Because we did not perform concomitant echocardiogra-
phy, it is conceivable, conversely, that the presence and
severity of right ventricular dysfunction might have been
underestimated.
Failure to induce an increase in preload and failure to
detect changes in stroke volume would be the most obvi-
ous alternative explanations for this controversial finding.
We consider these explanations unlikely. First, any acute
increase in central venous pressure in response to volume
loading suggests an increase in preload and should result
in an increase in stroke volume if the heart is operating in
the volume-responsive part of the cardiac-function curve
[20,21,37]. The increase in central venous pressure in 76%
Table 1: Patient characteristics and ventilator settings during the study
Cardiac surgery (n = 15) Septic shock (n = 7)
Age (years) 76 (68 to 79) 72 (61 to 73)
SAPS II 31 (24 to 35) 74 (49 to 100)
SOFA 14 (13 to 15)
Tidal volume (ml/kg) 9 (8 to 10) 9 (8 to 10)
PEEP (cm H
2
O) 5 (5 to 5) 7.5 (7.5 to 10)
Inspiratory plateau pressure (cm H
2
O) 21 (17 to 26) 24 (18 to 37)
Main diagnosis (cardiac surgery) and source of sepsis (n) Aortic valve stenosis (9)
Coronary artery disease (5)
Mitral valve insufficiency (1)
Abdominal (4)
Lung (1)
Unknown (2)
Data are presented as median (interquartile range).
PEEP, positive end-expiratory pressure; SAPS, simplified acute physiology score; SOFA, sequential organ-failure assessment.
Table 2: Baseline hemodynamic characteristics
Cardiac surgery Sepsis
Stroke volume (ml/m
2
)
28 ± 9 33 ± 5
Pulmonary artery occlusion pressure (mm Hg) 14 ± 4 15 ± 5
Central venous pressure (mm Hg) 12 ± 5 13 ± 6
Mean pulmonary arterial pressure (mm Hg) 27 ± 5 33 ± 10
Mean arterial pressure (mm Hg) 70 ± 10 62 ± 8
Heart rate (beats/min) 92 ± 5 107 ± 27
Right ventricular end-diastolic volume (ml/m
2
)
103 ± 21 120 ± 15
Right ventricular ejection fraction 27 ± 9 30 ± 5
Pulse-pressure variation 20 ± 20 27 ± 37
Values are expressed as mean ± SD.
Wyler von Ballmoos et al. Critical Care 2010, 14:R111
/>Page 5 of 9
Table 3: Hemodynamic changes in patients with (responders) and without (nonresponders) increase in stroke volume after a volume
challenge
Cardiac surgery Sepsis P value
Before After Before After V V/R V/R/D
Stroke volume (ml/m
2
)
0.001 0.699
All 30 ± 9 31 ± 7 34 ± 6 36 ± 7
Responders 24 ± 4 29 ± 4 32 ± 5 37 ± 7
Nonresponders 32 ± 9 32 ± 8 35 ± 6 35 ± 7
Pulmonary artery occlusion pressure (mm Hg) 0.001 0.280 0.701
All 13 ± 3 14 ± 4 16 ± 4 18 ± 4
Responders 12 ± 1 14 ± 2 13 ± 4 18 ± 3
Nonresponders 13 ± 4 15 ± 4 16 ± 4 18 ± 4
Central venous pressure (mm Hg) 0.001 0.724 0.593
All 12 ± 4 13 ± 4 12 ± 5 14 ± 5
Responders 12 ± 3 13 ± 4 10 ± 3 12 ± 3
Nonresponders 12 ± 4 13 ± 4 13 ± 5 15 ± 5
Mean pulmonary arterial pressure (mm Hg) 0.001 0.158 0.175
All 26 ± 4 28 ± 5 33 ± 7 35 ± 6
Responders 27 ± 3 29 ± 3 32 ± 6 34 ± 7
Nonresponders 26 ± 5 27 ± 5 34 ± 7 35 ± 6
Mean arterial pressure (mm Hg) 0.001 0.206 0.255
All 67 ± 8 70 ± 9 58 ± 7 60 ± 7
Responders 69 ± 7 74 ± 7 61 ± 7 63 ± 9
Nonresponders 66 ± 9 69 ± 10 57 ± 7 59 ± 5
Heart rate (beats/min) 0.071 0.438 0.343
All 92 ± 5 92 ± 4 116 ± 22 114 ± 22
Responders 91 ± 4 91 ± 4 120 ± 24 117 ± 24
Nonresponders 92 ± 5 92 ± 5 114 ± 22 113 ± 22
Right ventricular end-diastolic volume (ml/m
2
)
0.245 0.385 0.378
All 103 ± 26 101 ± 25 122 ± 23 122 ± 24
Responders 103 ± 38 101 ± 34 124 ± 20 122 ± 21
Nonresponders 103 ± 21 101 ± 22 121 ± 25 122 ± 26
Right ventricular ejection fraction (%) 0.108 0.055 0.836
All 30 ± 10 32 ± 10 30 ± 6 29 ± 6
Responders 26 ± 9 28 ± 9 27 ± 5 28 ± 6
Nonresponders 32 ± 10 33 ± 10 31 ± 6 30 ± 6
Pulse-pressure variation (%) 0.307 0.573 0.386
All 22 ± 18 20 ± 17 34 ± 29 33 ± 28
Responders 22 ± 17 15 ± 8 38 ± 32 38 ± 38
Nonresponders 22 ± 19 22 ± 19 32 ± 29 30 ± 24
Values are expressed as mean ± SD. Bold indicated significant P values (P < 0.05).
V, Effect of volume; V/R, volume-response interaction; V/R/D, volume-response-diagnosis interaction.
Wyler von Ballmoos et al. Critical Care 2010, 14:R111
/>Page 6 of 9
of fluid challenges strongly suggests that preload acutely
increased in the majority of fluid challenges; in those
without a relevant increase in central venous pressure,
the fluid challenge apparently failed to increase the
stressed volume, possibly due to vasodilation. Second, the
percentage of responders versus nonresponders (27% ver-
sus 73%) was the same when all fluid challenges were
considered. Because no clinically applicable method pro-
vides an accurate beat-to-beat measurement of cardiac
output, we chose to use the continuous thermodilution
method. We used the 1-minute values provided by the
software, so this method does not induce a clinically rele-
vant delay in the measured values. Hence, relevant rapid
changes should not have been missed. We also eliminated
all phases of spontaneous respiration by evaluating all
individual tracings, and used tidal volumes large enough
(9 ml/kg on average (range, 8 to 10 ml/kg)) to result in rel-
evant intrathoracic pressure changes [36,37].
The potential of increased pulmonary artery pressure
to interfere with the predictive value of pulse-pressure
variation has been addressed previously, but its clinical
relevance has been considered small [13,14]. This view is
in sharp contrast to the frequent occurrence of high pul-
monary artery pressures in the early postoperative period
after cardiac surgery [16,17], as well as in septic shock
[18,19]. Because the use of the pulmonary artery catheter
has decreased, moderate or transient but relevant
increases in pulmonary artery pressures may easily be
overlooked. Our results suggest that under these condi-
tions, PPV may erroneously suggest volume responsive-
ness. The recent study of Mahjoub et al. [15] supports
this concept. Those authors considered the risk of false-
positive prediction of fluid responsiveness by PPV high
Figure 1 Receiver operating characteristic (ROC) curves for pre-
diction of ≥10% increase in stroke volume by pulse-pressure vari-
ation in all patients. Solid line, all fluid challenges; dotted line, fluid
challenges with concomitant increase in central venous pressure; thin
solid line, line of identity.
Figure 2 Receiver operating characteristic (ROC) curves for pre-
diction of ≥10% increase in stroke volume by pulse-pressure vari-
ation in cardiac surgery patients. Solid line, all fluid challenges;
dotted line, fluid challenges with concomitant increase in central ve-
nous pressure; thin solid line, line of identity.
Figure 3 Receiver operating characteristic (ROC) curves for pre-
diction of ≥10% increase in stroke volume by pulse-pressure vari-
ation in septic shock patients. Solid line, all fluid challenges; dotted
line, fluid challenges with concomitant increase in central venous pres-
sure; thin solid line, line of identity.
Wyler von Ballmoos et al. Critical Care 2010, 14:R111
/>Page 7 of 9
enough to warrant echocardiography before performing
fluid challenge based on increased PPV.
The dynamic association between volume status and
PPV has been advocated as an alternative to predict
which patients will respond to fluid administration
[12,14]. We tested this in a clinical context in which fluid
infusion is unavoidable (that is, in patients with septic
shock and in patients immediately after cardiac surgery).
Instead of selecting patients with a specific condition
believed to reflect fluid responsiveness, we chose situa-
tions in which clinicians considered volume expansion
with fluids necessary. Although PPV has been well vali-
dated in the context of hypovolemia [38,39], the presence
of pure hypovolemia is probably less common and more
difficult to treat in patients with septic shock or after car-
diac surgery, when pulmonary artery pressures are
increased. In these situations, complex heart-lung inter-
actions may be present as a consequence of either com-
promised myocardial function in cardiac surgery patients
or both diastolic and systolic biventricular dysfunction
and acute changes in pulmonary vascular resistances in
patients with septic shock. Previous studies in cardiac
surgery patients in whom PPV predicted volume respon-
siveness either have been performed right after induction
of anesthesia [23,24,28-30], have included patients with
normal pulmonary artery pressure [24,26,30,31], or have
not reported pulmonary artery pressure [22,23,28,29,32].
In studies on sepsis patients, pulmonary artery pressure
was less increased than in the present study [12,34-36]
(average mean pulmonary artery pressure, 24 to 26 mm
Hg before fluid challenge versus 33 mm Hg in this study)
or was not reported [25,33].
We believe that our findings are real, especially consid-
ering the persisting large PPV values. These increased
PPV values cannot be explained by relative hypovolemia,
but are rather the consequence of an impeded right sys-
tolic function, as a consequence of intrathoracic pressure
changes in a situation in which the right ventricle is
already at the flat part of preload dependence. Hence,
PPV had no predictive value for volume responsiveness.
Furthermore, clinical use of PPV to predict volume
responsiveness may misleadingly suggest volume respon-
siveness when increased pulmonary artery pressure com-
promises right ventricular function, and further volume
expansion may be harmful.
We therefore performed a second, experimental study.
In the accompanying article [40], we assess the effect of
acutely increased pulmonary artery pressure on volume-
responsiveness prediction with PPV.
A limitation of this study is the lack of airway-pressure
signal recording concomitant with the hemodynamic sig-
nals. Our approach does not guarantee 100% exclusion of
data from patients with spontaneous respiratory activity,
although respiratory efforts with an influence on PPV
should mostly be detectable in central venous and pulmo-
nary artery pressure tracings. Recording airway-pressure
signals would also have enabled us to define whether PPV
was the result of an increase in PP during inspiration, a
decrease during expiration, or both.
Another potential confounder is the use of a colloid
rather than a crystalloid. It has been suggested that col-
loids may have effects on cardiac function independent of
their volume-expanding effect. However, this should have
tended to increase fluid responsiveness rather than to
decrease it.
Conclusions
We conclude that both early after cardiac surgery and in
septic shock, patients with increased pulmonary artery
pressure respond poorly to fluid administration. Under
these conditions, PPV cannot be used to predict fluid
responsiveness. We suggest that right ventricular dys-
function contributed to the poor response to fluids.
Key messages
• Septic shock and post-cardiac surgery patients with
increased pulmonary artery pressure respond poorly
to fluid administration.
• Pulse-pressure variation does not predict fluid
responsiveness in septic shock and post-cardiac sur-
gery patients with increased pulmonary artery pres-
sure.
• Right ventricular dysfunction may contribute to
poor fluid response in such patients.
Additional material
Abbreviations
AUC: area under the curve; CVP: central venous pressure; ECG: electrocardio-
gram; EDV: end-diastolic volume; EF: ejection fraction; PAOP: pulmonary artery
occlusion pressure; PEEP: positive end-expiratory pressure; PPV: pulse-pressure
variation; ROC: receiver operating characteristic; SAPS: simplified acute physiol-
ogy score; SIRS: systemic inflammatory response syndrome; SOFA: sequential
organ-failure assessment; SV: stroke volume. SvO
2
: mixed venous oxygen satu-
ration.
Competing interests
The Department of Intensive Care Medicine has, or has had in the past,
research contracts with Abbott Nutrition International, B. Braun Medical AG,
CSEM SA, Edwards Lifesciences Services GmbH, Kenta Biotech Ltd, Maquet Crit-
ical Care AB, Omnicare Clinical Research AG, and Orion Corporation; and
research & development/consulting contracts with Edwards Lifesciences SA
and Maquet Critical Care AB. The money is/was paid into a departmental fund;
no author receives/received individual fees. The past contract with Edwards
Lifesciences is unrelated to and did not influence the current study.
Authors' contributions
MWvB analyzed the data and drafted the manuscript. JT and SMJ designed and
supervised the study, performed the statistics, and critically revised the manu-
Additional file 1 Clinical indications for fluid challenges. A table listing
clinical indications for fluid challenges.
Wyler von Ballmoos et al. Critical Care 2010, 14:R111
/>Page 8 of 9
script. MR, FP, DT, CCG, RS, HB, and BB performed the study. All authors read and
approved the final manuscript.
Acknowledgements
We are indebted to Torsten Konrad, Michael Lensch, and Natalie Araya for their
skillful technical assistance and to Jeannie Wurz for careful editing of the man-
uscript.
Author Details
1
Department of Intensive Care Medicine, Bern University Hospital and
University of Bern (Inselspital), Freiburgstrasse 10, 3010 Bern, Switzerland and
2
Department of Anesthesiology and Pain Therapy, Bern University Hospital and
University of Bern (Inselspital), Freiburgstrasse 10, 3010 Bern, Switzerland
References
1. Balogh Z, McKinley BA, Cocanour CS, Kozar RA, Valdivia A, Sailors RM,
Moore FA: Supranormal trauma resuscitation causes more cases of
abdominal compartment syndrome. Arch Surg 2003, 138:637-642.
discussion 642-633
2. Mehta RL, Clark WC, Schetz M: Techniques for assessing and achieving
fluid balance in acute renal failure. Curr Opin Crit Care 2002, 8:535-543.
3. Kreimeier U, Peter K: Strategies of volume therapy in sepsis and
systemic inflammatory response syndrome. Kidney Int Suppl 1998,
64:S75-S79.
4. Mythen MG, Salmon JB, Webb AR: The rational administration of
colloids. Blood Rev 1993, 7:223-228.
5. Schadt JC, Ludbrook J: Hemodynamic and neurohumoral responses to
acute hypovolemia in conscious mammals. Am J Physiol 1991,
260:H305-H318.
6. Marx G, Cope T, McCrossan L, Swaraj S, Cowan C, Mostafa SM, Wenstone R,
Leuwer M: Assessing fluid responsiveness by stroke volume variation in
mechanically ventilated patients with severe sepsis. Eur J Anaesthesiol
2004, 21:132-138.
7. Matejovic M, Krouzecky A, Rokyta R Jr, Novak I: Fluid challenge in patients
at risk for fluid loading-induced pulmonary edema. Acta Anaesthesiol
Scand 2004, 48:69-73.
8. Roeck M, Jakob SM, Boehlen T, Brander L, Knuesel R, Takala J: Change in
stroke volume in response to fluid challenge: assessment using
esophageal Doppler. Intensive Care Med 2003, 29:1729-1735.
9. Hamilton-Davies C, Mythen MG, Salmon JB, Jacobson D, Shukla A, Webb
AR: Comparison of commonly used clinical indicators of hypovolaemia
with gastrointestinal tonometry. Intensive Care Med 1997, 23:276-281.
10. Edouard AR, Degremont AC, Duranteau J, Pussard E, Berdeaux A, Samii K:
Heterogeneous regional vascular responses to simulated transient
hypovolemia in man. Intensive Care Med 1994, 20:414-420.
11. Shippy CR, Appel PL, Shoemaker WC: Reliability of clinical monitoring to
assess blood volume in critically ill patients. Crit Care Med 1984,
12:107-112.
12. Michard F, Boussat S, Chemla D, Anguel N, Mercat A, Lecarpentier Y,
Richard C, Pinsky MR, Teboul JL: Relation between respiratory changes in
arterial pulse pressure and fluid responsiveness in septic patients with
acute circulatory failure. Am J Respir Crit Care Med 2000, 162:134-138.
13. Teboul JL, Vieillard-Baron A: Clinical value of pulse pressure variations in
ARDS: still an unresolved issue? Intensive Care Med 2005, 31:499-500.
14. Michard F, Teboul JL: Using heart-lung interactions to assess fluid
responsiveness during mechanical ventilation. Crit Care 2000,
4:282-289.
15. Mahjoub Y, Pila C, Friggeri A, Zogheib E, Lobjoie E, Tinturier F, Galy C,
Slama M, Dupont H: Assessing fluid responsiveness in critically ill
patients: false-positive pulse pressure variation is detected by Doppler
echocardiographic evaluation of the right ventricle. Crit Care Med 2009,
37:2570-2575.
16. Robitaille A, Denault AY, Couture P, Belisle S, Fortier A, Guertin MC, Carrier
M, Martineau R: Importance of relative pulmonary hypertension in
cardiac surgery: the mean systemic-to-pulmonary artery pressure
ratio. J Cardiothorac Vasc Anesth 2006, 20:331-339.
17. Viitanen A, Salmenpera M, Heinonen J: Right ventricular response to
hypercarbia after cardiac surgery. Anesthesiology 1990, 73:393-400.
18. Parker MM, McCarthy KE, Ognibene FP, Parrillo JE: Right ventricular
dysfunction and dilatation, similar to left ventricular changes,
characterize the cardiac depression of septic shock in humans. Chest
1990, 97:126-131.
19. Vincent JL, Reuse C, Frank N, Contempre B, Kahn RJ: Right ventricular
dysfunction in septic shock: assessment by measurements of right
ventricular ejection fraction using the thermodilution technique. Acta
Anaesthesiol Scand 1989, 33:34-38.
20. Guyton AC, Lindsey AW, Kaufmann BN: Effect of mean circulatory filling
pressure and other peripheral circulatory factors on cardiac output.
Am J Physiol 1955, 180:463-468.
21. Magder S, De Varennes B: Clinical death and the measurement of
stressed vascular volume. Crit Care Med 1998, 26:1061-1064.
22. Auler JO Jr, Galas F, Hajjar L, Santos L, Carvalho T, Michard F: Online
monitoring of pulse pressure variation to guide fluid therapy after
cardiac surgery. Anesth Analg 2008, 106:1201-1206.
23. Cannesson M, Desebbe O, Rosamel P, Delannoy B, Robin J, Bastien O,
Lehot J-J: Pleth variability index to monitor the respiratory variations in
the pulse oximeter plethysmographic waveform amplitude and
predict fluid responsiveness in the operating theatre. Br J Anaesth 2008,
101:200-206. Epub 2008 Jun 2
24. Cannesson M, Slieker J, Desebbe O, Bauer C, Chiari P, Hénaine R, Lehot J-J:
The ability of a novel algorithm for automatic estimation of the
respiratory variations in arterial pulse pressure to monitor fluid
responsiveness in the operating room. Anesth Analg 2008,
106:1195-1200.
25. Feissel M, Teboul JL, Merlani P, Badie J, Faller J-P, Benjelid K:
Plethysmographic dynamic indices predict fluid responsiveness in
septic ventilated patients. Intensive Care Med 2007, 33:993-999.
26. Wyffels PA, Durnez PJ, Helderweirt J, Stockman WMA, De Kegel D:
Ventilation-induced plethysmographic variations predict fluid
responsiveness in ventilated postoperative cardiac surgery patients.
Anesth Analg 2007, 105:448-452.
27. Marik PE, Cavallazzi R, Vasu T, Hirani A: Dynamic changes in arterial
waveform derived variables and fluid responsiveness in mechanically
ventilated patients: a systematic review of the literature. Crit Care Med
2009, 37:2642-2647.
28. Cannesson M, Attof Y, Rosamel P, Desebbe O, Joseph P, Metton O, Bastien
O, Lehot J-J: Respiratory variations in pulse oximetry plethysmographic
waveform amplitude to predict fluid responsiveness in the operating
room. Anesthesiology 2007, 106:1105-1111.
29. Preisman S, Kogan S, Berkenstadt H, Perel A: Predicting fluid
responsiveness in patients undergoing cardiac surgery: functional
haemodynamic parameters including the Respiratory Systolic
Variation Test and static preload indicators. Br J Anaesth 2005,
95:746-755.
30. Hofer CK, Müller SM, Furrer L, Klaghofer R, Genoni M, Zollinger A: Stroke
volume and pulse pressure variation for prediction of fluid
responsiveness in patients undergoing off-pump coronary artery
bypass grafting. Chest 2005, 128:848-854.
31. Bendjelid K, Suter PM, Romand JA: The respiratory change in preejection
period: a new method to predict fluid responsiveness. J Appl Physiol
2004, 96:337-342.
32. Kramer A, Zygun D, Hawe H, Easton P, Ferland A: Pulse pressure variation
predicts fluid responsiveness following coronary artery bypass
surgery. Chest 2004, 126:1563-1568.
33. Vieillard-Baron A, Chergui K, Rabiller A, Peyrouset O, Page B, Beauchet A,
Jardin F: Superior vena caval collapsibility as a gauge of volume status
in ventilated septic patients. Intensive Care Med 2004, 30:1734-1739.
34. Michard F, Chemla D, Richard C, Wysocki M, Pinsky MR, Lecarpentier Y,
Teboul JL: Clinical use of respiratory changes in arterial pulse pressure
to monitor the hemodynamic effects of PEEP. Am J Respir Crit Care Med
1999, 159:935-939.
35. Natalini G, Rosano A, Taranto M, Faggian B, Vittorielli E: Arterial versus
plethysmographic dynamic indices to test responsiveness for testing
fluid administration in hypotensive patients: a clinical trial. Anesth
Analg 2006, 103:1478-1484.
36. De Backer D, Heenen S, Piagnerelli M, Koch M, Vincent JL: Pulse pressure
variations to predict fluid responsiveness: influence of tidal volume.
Intensive Care Med 2005, 31:517-523.
37. Magder S: Clinical usefulness of respiratory variations in arterial
pressure. Am J Respir Crit Care Med 2004, 169:151-155.
Received: 29 October 2009 Revised: 15 March 2010
Accepted: 11 June 2010 Published: 11 June 2010
This article is available from: 2010 Wyler von Ballmoos, et al.; licensee BioMed Central Ltd. This is an open access article distributed under the terms of the Creative Commons Attribution License ( which permits unrestricted use, distribution, and reproduction in any medium, provided the original work is properly cited.Critica l Care 2010, 14:R 111
Wyler von Ballmoos et al. Critical Care 2010, 14:R111
/>Page 9 of 9
38. Berkenstadt H, Friedman Z, Preisman S, Keidan I, Livingstone D, Perel A:
Pulse pressure and stroke volume variations during severe
haemorrhage in ventilated dogs. Br J Anaesth 2005, 94:721-726.
39. Fujita Y, Yamamoto T, Sano I, Yoshioka N, Hinenoya H: A comparison of
changes in cardiac preload variables during graded hypovolemia and
hypervolemia in mechanically ventilated dogs. Anesth Analg 2004,
99:1780-1786.
40. Daudel Fritz, Tueller David, Krähenbühl Stefanie, Jakob Stephan M, Takala
Jukka: Pulse pressure variation and volume responsiveness during
acutely increased pulmonary artery pressure: an experimental study.
Crit Care 2010 in press.
doi: 10.1186/cc9060
Cite this article as: Wyler von Ballmoos et al., Pulse-pressure variation and
hemodynamic response in patients with elevated pulmonary artery pres-
sure: a clinical study Critical Care 2010, 14:R111