Báo cáo y học: "A steady state analysis indicates that negative feedback regulation of PTP1B by Akt elicits bistability in insulin-stimulated GLUT4 translocation" potx
Bạn đang xem bản rút gọn của tài liệu. Xem và tải ngay bản đầy đủ của tài liệu tại đây (1.03 MB, 16 trang )
Theoretical Biology and Medical
Modelling
BioMed Central
Open Access
Research
A steady state analysis indicates that negative feedback regulation
of PTP1B by Akt elicits bistability in insulin-stimulated GLUT4
translocation
Lopamudra Giri†, Vivek K Mutalik† and KV Venkatesh*
Address: Department of Chemical Engineering and School of Biosciences and Bioengineering, Indian Institute of Technology Bombay, Powai,
Mumbai-400076, India
Email: Lopamudra Giri - ; Vivek K Mutalik - ; KV Venkatesh* -
* Corresponding author †Equal contributors
Published: 03 August 2004
Theoretical Biology and Medical Modelling 2004, 1:2
doi:10.1186/1742-4682-1-2
Received: 22 June 2004
Accepted: 03 August 2004
This article is available from: />© 2004 Giri et al; licensee BioMed Central Ltd.
This is an open-access article distributed under the terms of the Creative Commons Attribution License ( />which permits unrestricted use, distribution, and reproduction in any medium, provided the original work is properly cited.
Insulin signaling pathwayGLUT4TranslocationEnzyme cascadeFeedback loopsBistable switch
Abstract
Background: The phenomenon of switch-like response to graded input signal is the theme
involved in various signaling pathways in living systems. Positive feedback loops or double negative
feedback loops embedded with nonlinearity exhibit these switch-like bistable responses. Such
feedback regulations exist in insulin signaling pathway as well.
Methods: In the current manuscript, a steady state analysis of the metabolic insulin-signaling
pathway is presented. The threshold concentration of insulin required for glucose transporter
GLUT4 translocation was studied with variation in system parameters and component
concentrations. The dose response curves of GLUT4 translocation at various concentration of
insulin obtained by steady state analysis were quantified in-terms of half saturation constant.
Results: We show that, insulin-stimulated GLUT4 translocation can operate as a bistable switch,
which ensures that GLUT4 settles between two discrete, but mutually exclusive stable steady
states. The threshold concentration of insulin required for GLUT4 translocation changes with
variation in system parameters and component concentrations, thus providing insights into possible
pathological conditions.
Conclusion: A steady state analysis indicates that negative feedback regulation of phosphatase
PTP1B by Akt elicits bistability in insulin-stimulated GLUT4 translocation. The threshold
concentration of insulin required for GLUT4 translocation and the corresponding bistable
response at different system parameters and component concentrations was compared with
reported experimental observations on specific defects in regulation of the system.
Background
In living systems, extracellular information is processed
through signal transduction machinery to appropriately
regulate cellular function. This information processing
machinery is made up of a complex web of enzyme cascades, allosteric interactions and feedback loops.
Page 1 of 16
(page number not for citation purposes)
Theoretical Biology and Medical Modelling 2004, 1:2
Depending on their regulatory design these signaling networks elicit diverse responses, but display many common
operating principles. A recurring theme in signaling systems is switch-like responses to graded or transient input
signal. Various mechanisms are known to generate such
all-or-none responses [1]. Bistability is one such system
level property, in which, the system switches between two
discrete stable steady states without being able to rest in
an intermediate state. Bistable systems exhibit hysteresis
wherein, the value of input stimulus required for system
transition from one state to another is quite different from
the value required for reverse transition. Both computational and experimental analyses have shown that bistability plays a significant role in cellular differentiation and
cell cycle progressions [2-5], production of biochemical
memory [6], microbial metabolic systems [7], lateral signal propagation [8] and protein translocations [9]. Existence of bistability in cellular regulation has been
attributed to nonlinearity embedded in positive feedback
loop or double negative feedback loop [10]. Here, we
present steady state simulation results of metabolic insulin signaling pathway comprising of positive feedback
loops and show that this system can convert graded inputs
into switch-like bistable output response.
Insulin is the most potent anabolic peptide hormone
known that elicits myriad biological responses by specifically binding to insulin receptor and simultaneously stimulating multiple signaling pathways to regulate growth,
differentiation and metabolism. Insulin maintains glucose homeostasis by stimulating the uptake, utilization
and storage of glucose in muscle and adipose tissue, and
inhibits hepatic glucose production [11]. Defects in any of
the pathway components lead to disturbance in growth,
differentiation, and in the homeostasis of glucose and
lipid levels. This leads to disease conditions such as type 2
diabetes, hypertension, obesity and a cluster of abnormalities characterized by insulin resistance or deficiency. In
such a condition, normal circulating concentration of
insulin is insufficient to elicit appropriate response
[12,13]. Studies over the last century have identified the
major insulin signaling components involved in the regulation of glucose uptake into cells and its various defects
in diseased states.
A wide family of glucose-transporter proteins localized in
the plasma membrane, facilitate uptake of glucose from
the blood into tissues. Among different isoforms, only
glucose transporter isoform-4 (GLUT4) is specifically
expressed to promote glucose uptake in insulin sensitive
tissues, viz. muscle and adipose, and in response to insulin, GLUT4 gets translocated to the plasma membrane
from intracellular vesicles [14]. The biological action of
insulin is initiated by binding to the tyrosine kinase receptor and its subsequent activation. The activated tyrosine
/>
kinase receptor undergoes autophosphorylation and catalyzes the phosphorylation of several intracellular substrates including the insulin-receptor substrate (IRS)
proteins (Fig. 1). The activated IRS isoform-1 protein further activates downstream components to elicit translocation of GLUT4 [11]. There are several downstream kinases
like PI-3 kinase, Akt (or protein kinase B) and protein
kinase C-ζ (PKC-ζ) demonstrated to be potentially capable of phosphorylating upstream proteins like IRS-1 and
tyrosine phosphatase 1B (PTP1B) thus serving as negative
and positive feedback loops respectively [15]. Other than
feedback loops, crosstalk between multitudes of signal
transduction pathways have also been reported, thus making the insulin-signaling pathway a highly intricate network [11].
Although studies on various cell lines, transgenic and
knock-out mice, have helped to uncover and characterize
the different components involved in insulin signaling
pathway, there are many voids in our understanding of
the precise molecular mechanisms of signal transduction
and cellular effects of insulin [16,17]. The major hurdles
are complexity of insulin signaling pathway and technical
problems like experimental methodology employed for
system level quantification. For example, depending upon
different techniques employed, quantification of GLUT4
translocation in response to insulin binding yielded different results in the same cell type [18]. Recent technical
developments however have helped in studying the localization and translocation of signaling proteins and overall
quantification of signaling processes in single cells has
been possible [19]. In such a scenario, it is pertinent to ask
questions regarding the design principles involved in
intracellular regulation. For example, what does a particular regulatory structure accomplish and how does it help
in exhibiting different physiological responses. Based on
available experimental data, computational and mathematical analysis can answer some of these questions and
possibly propose new experiments and hypotheses. Earlier mathematical modeling studies of insulin signaling
pathways have focused on subsystems of the pathway, like
insulin receptor binding kinetics [20,21], receptor recycling [22] and GLUT4 translocation [23-25]. Recently a
comprehensive dynamic model of metabolic insulin signaling pathway was presented, which involved most of the
known signaling components [26]. Although the model
correlated well with the published experiment data,
authors did not discuss the system level regulatory design
of insulin signaling system.
In the present work, we have developed a steady state
model of insulin signaling to generate dose response
curves for fractional translocation of GLUT4 to varying
input insulin stimuli. One of the main objectives was to
investigate the effect of inherent signaling structure made
Page 2 of 16
(page number not for citation purposes)
Theoretical Biology and Medical Modelling 2004, 1:2
Insulin
Receptor
/>
Insulin
Plasma
membrane
P
P
P
P
PTP1B
IRS-1
P
P
IRS-1
IRS-1
P
PI3-K
PI3-K
PTP1B
PI (3, 4) P2
PTP1B
Insulin
receptor
recycling
P
PI (3,4,5)P3
SHIP 2
PI (4, 5) P2
PTEN
PDK1
PDK1
PI (3,4,5)P3
Akt
Akt
P
P
PKC
PKC
GLUT4
Translocation
GLUT4 containing
vesicle
GLUT4
Plasma
membrane
Figure 1
(GLUT4) representation cell membrane
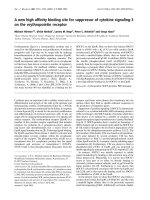
Simplified translocation toof molecular mechanism involved in insulin signaling pathway that regulates glucose transporter
Simplified representation of molecular mechanism involved in insulin signaling pathway that regulates glucose
transporter (GLUT4) translocation to cell membrane. Some of the details like, other isoforms of insulin receptor substrate and multiphosphorylation of insulin receptor substrate are not shown here. Nomenclature: GLUT4: Glucose-transporter isoform 4; IRS-1: Insulin receptor substrate-1; PI3K: Phosphatidylinositol-3-kinase; PI (3, 4, 5) P3: Phosphatidylinositol
(PI)-3, 4, 5-tiphosphate; PDK1: phosphosinsositide-dependent kinase 1; Akt: Protein kinase Akt or protein kinase B (PKB);
PKC: Protein kinase C-ς; PTP1B: Protein tyrosine phosphatase 1B; PTEN: 3' lipid phosphatase; SHIP2: 5' lipid phosphatase;
Detailed description of signaling events are given in the methods section. Letter 'P' indicates phosphorylated species.
Page 3 of 16
(page number not for citation purposes)
Theoretical Biology and Medical Modelling 2004, 1:2
up of phosphorylation cycles, allosteric interactions and
feedback loops on the system level response of insulin on
GLUT4 translocation. Furthermore, we were interested in
examining whether the regulatory design consisting of
positive feedback loops in insulin signaling pathway
exhibits bistable response. We solved the steady state
equations for the entire metabolic insulin pathway
including the positive feedback loops numerically, and
found that GLUT4 gets translocated to the plasma membrane in an all-or-none manner in response to a varying
concentration of input insulin stimuli. We show that
GLUT4 translocation switches between the on-state and
off-state and exhibits hysteresis in its response to increasing and decreasing input insulin concentration. This
input-output relationship was then studied at various
concentration of signaling components and system
parameters in order to monitor the range over which this
response persisted. We discuss these results by comparing
with the known specific defects in regulation of the system
(insulin dependent diseases) that lead to improper glucose uptake into the cell.
Methods
Figure 1 shows a simplified representation of molecular
mechanisms involved in insulin signaling pathway. The
metabolic insulin-signaling pathway used for the steady
state simulation in the present work is shown in Fig. 2.
This schematic representation is a compilation of various
interactions in insulin pathway which have been very well
reviewed [11-27]. We have used the framework of Goldbeter and Koshland [28] to model the insulin system at
steady state and accordingly an equivalent rate constant
and Michaelis-Menten constant nomenclature scheme is
applied. The detailed list of the steady state equations for
covalent modification cycles, equilibrium relationships
for allosteric interactions, mass balance equations for
total species and parameters used in the simulations are
provided in Appendix. All component enzyme concentrations are represented with respect to whole cell volume.
Most of the kinetic/equilibrium constants are taken from
the literature. In this analysis, the reactants like ATP and
PPi concentrations are assumed to be constant. In the following paragraphs we present the system considered and
assumptions made during the analysis.
Insulin initiates its biological action by interacting with
the insulin receptor, which belongs to a superfamily of
tyrosine kinase receptors. On binding to the first insulin
molecule, the receptor gets auto-phosphorylated and is
dephosphorylated by phosphatase PTP1B [12]. The phosphorylated insulin receptor can either bind with another
insulin molecule or undergoes dissociation. Binding of
the second insulin molecule does not affect the phosphorylation state of the receptor. Here we have assumed that
the concentration of unbound phosphorylated receptor is
/>
negligible. Thus, phosphorylated receptors can exist as
species bound to either singly or doubly bound molecules
of insulin. Insulin bound phosphorylated receptor rapidly
gets internalized into the endosomal apparatus of the cell
before it gets dephosphorylated by PTP1B and incorporated into intracellular receptor pool [29]. However recent
studies indicate that, PTP1B might interact with insulin
receptor directly and deactivate it without internalization
[30]. We have assumed that, the membrane bound phosphorylated insulin-receptor and its internalized form,
both get dephosphorylated by PTP1B. The rate equation
for intracellular receptor at steady state is represented as
kp
( PTP ) ( XIPi + XI2Pi )
Kmr
− kd ( Xi ) + ks = 0
[1]
where kp is rate constant and Kmr is Michaelis-Menten
constant for dephosphorylation of internalized insulin
receptors XIPi and XI2Pi. The term kd is first order degradation rate constant and ks is zero order synthesis rate constant of intracellular receptor Xi. The receptor exocytosis
and endocytosis are assumed to be at quasi-equilibrium
because of their faster time scales than the synthesis and
degradation of receptors [26].
The phosphorylated active receptors further catalyze
phosphorylation of several intracellular substrates including the IRS proteins, GAB-1, Shc and c-Cab1 [16]. Among
these, IRS-1 protein is known to participate in the regulation of GLUT4 translocation. In the present study we have
assumed that, at steady state the twice-bound phosphorylated receptor catalyses the phosphorylation of IRS-1
protein while neglecting the activation of GAB-1, Shc, cCab1.
The phosphorylated active IRS-1 further binds and activates PI3 kinase and this association is assumed to occur
with a stoichiometry of 1:1. Activated PI3 kinase further
phosphorylates phosphatidylinositol-(4,5)-bisphosphate
(PI-4,5-P2) to form phosphatidylinositol -3,4,5-triphosphate, (PIP3). The dephosphorylation of PIP3 to form PI4,5-P2 is catalyzed by phosphatase PTEN, whereas, PIP3 is
dephosphorylated to form PI-3,4-P2 by phosphatase
SHIP2. Active PIP3 then is known to interact allosterically
with phosphosinsositide-dependent kinase 1 (PDK1) and
which in turn appears to phosphorylate kinase Akt (or
protein kinase B) and protein kinase C-ζ (PKC-ζ) [11].
However, as the interaction due to PDK1 is unclear, active
PIP3 is assumed to play a role in phosphorylation of Akt
and PKC-ζ. Since the parameters affecting the modification-demodification of Akt and PKC-ζ are considered to
be similar, their modification is represented as a single
enzyme cascade (Fig. 2).
Page 4 of 16
(page number not for citation purposes)
Theoretical Biology and Medical Modelling 2004, 1:2
/>
Figure 2
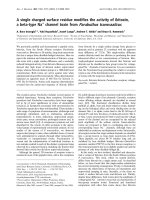
Schematic representation of metabolic Insulin signaling pathway used for the steady state analysis
Schematic representation of metabolic Insulin signaling pathway used for the steady state analysis. Nomenclature: I, Insulin; X, unbound surface insulin receptor; XI, unphosphorylated once-bound surface receptor; XIP, phosphorylated
once-bound surface receptor; XI2P, phosphorylated twice-bound surface receptor; Xi represents intracellular receptor pool;
XIPi and XI2Pi are internalized form of XIP and XI2P; phosphatase PTP catalyzes the dephosphorylation of AP, XIP, XIPi and
XI2Pi. A, unphosphorylated IRS-1; AP, phosphorylated IRS-1; B, inactive PI3-kinase; APB, phosphorylated IRS-1 and PI3-kinase
complex; CP3, lipid PI[3,4,5]P3; CP2, lipid PI[4,5]P2; CP2', lipid PI[3,4]P2; phosphatase SHIP2 catalyzes dephosphorylation of
CP3 to form CP2', phosphatase PTEN catalyzes dephosphorylation of CP3 to form CP2; F, inactive Akt and PKC-ς; FP, phosphorylated Akt and PKC-ς; E8 dephosphorylates FP; E6 phosphorylates CP2' to form CP3; FP activates GLUT4 from intracellular location to plasma membrane. GC and GM represent GLUT4 in cytoplasm and on plasma membrane respectively. Kd1 to Kd3
are dissociation constants; Kd4 and Kd5 are distribution coefficients; Kmr, Km, Km1to Km8 are Michaelis-Menten constants; k,
kp, kd, ks, k0, k1 to k13 are reaction rates as shown in the figure.
The downstream elements of Akt and PKC-ζ, which effect
GLUT4 translocation, are also unknown [11-13]. There-
fore, we have assumed that phosphorylated Akt and PKCζ directly activate the GLUT4 translocation to the plasma
Page 5 of 16
(page number not for citation purposes)
Theoretical Biology and Medical Modelling 2004, 1:2
/>
membrane. In the basal state, GLUT4 slowly recycles
between the plasma membrane and intracellular vesicular
compartment. The phosphorylated Akt and PKC-ζ favor
GLUT4 translocation (exocytosis) to the plasma membrane and thus increase glucose uptake as a response to
insulin binding to the receptor [14]. Here, total GLUT4
(Gt) is assumed to be sum of GLUT4 concentration in the
cytosol (GC) and on the membrane (GM). The rate equation for GLUT4 species in cytoplasm at steady state is represented by,
FP
k13 ( GC ) − k12 ( GM ) − k9 + k10 ( GC ) + k11
( GC ) = 0
Ft
[ 2]
where, k9 is the basal zero order synthesis rate of GLUT4,
k10 is basal first order degradation rate, k11 is the insulinactivated GLUT4 exocytosis, k12 and k13 are basal first
order rate of exocytosis and endocytosis, respectively. As
assumed by Sedaghat, et al. [26], the basal equilibrium
distribution of cell surface GLUT4 and GLUT4 in the
intracellular pool are taken as 4% and 96%.
The insulin signaling pathway has been shown to consist
of multiple feedback loops [15]. Active Akt is known to
phosphorylate and thereby negatively regulate the
upstream phosphatase PTP1B. This phosphorylation
impairs the ability of PTP1B to dephosphorylate insulin
receptor and IRS-1 by 25% [31]. This represents overall
positive feedback loop as Akt inhibits signal attenuation
enzyme PTP1B. The resulting circuit also represents a double negative feedback loop, in which phosphorylated protein negatively regulate the phosphatase that
dephosphorylates it. To incorporate these feedback loops
we assumed that active Akt affects the total active PTP1B
enzyme and thus inhibits the dephosphorylation of the
receptor and IRS-1. The feedback effect of Akt on PTP1B
was incorporated by following relationship
kf
PTPt =
( PTP )max
k f + AktP
[ 3]
where, [PTP]max is maximum PTP1B concentration, PTPt is
the total active PTP1B concentration after incorporating
the effects of feedback, AktP represents the phosphorylated Akt concentration influencing the PTPase activity,
and kf represents the half saturation constant quantifying
feedback. The value of kf was estimated based on the
assumption that 25% of PTP1B is inactivated by total AktP
[31]. Thus, kf is appropriately calculated so that the first
term [kf /[kf + AktP]] is equal to 0.75. In absence of feedback effects, PTPt equals PTPmax.
Matlab (The MathWorks Inc. USA). The accuracy of the
simulation was verified by numerically checking the mass
balance of all species. The steady state modeling of entire
insulin signaling was evaluated including the feedback
loops and estimating the fractions of GLUT4 translocated
to the plasma membrane for a particular concentration of
insulin. Thus, the overall action of insulin on GLUT4
translocation is quantified as,
f =
GM
Gt
[4]
where, f is fractional GLUT4 on plasma membrane, GM is
GLUT4 concentration on plasma membrane and Gt is
total GLUT4 concentration with respect to whole cell
volume.
Results
Bistability in GLUT4 translocation to plasma membrane
Fig. 3A shows the predicted dose response curve of steady
state fraction of GLUT4 bound to the plasma membrane
at different concentrations of insulin. The predicted dose
response curve indicates that, there are three steady states
exist between 0.01 nM and 0.05 nM of insulin for GLUT4
translocation (curve b, Fig 3A). Out of these three steady
states, GLUT4 gets distributed between two discrete stable
steady states, either at plasma membrane or in the cytosol
without settling in an intermediate unstable state, thus
showing a typical hysteresis response. Due to hysteresis,
the dose response curve appears to split and we obtain
two distinct half-maximal concentrations (K0.5, insulin
concentration required for 50% of GLUT4 to reside on the
plasma membrane). This represents two threshold concentrations of insulin required for GLUT4 translocation
switching on (GLUT4 translocation to plasma membrane
at 0.05 nM) and switching off (GLUT4 translocation from
to plasma membrane at 0.01 nM).
The observed hysteresis is characteristic of a bistable
response obtained due to negative feedback regulation of
upstream signal attenuation enzyme PTP1B by downstream kinase Akt. Experimental data available in the literature indicates a subsensitive response of insulin,
requiring ~130 fold change in insulin concentration for
the maximal GLUT4 translocation to plasma membrane
[32]. Our results show an ultrasensitive response in insulin-stimulated GLUT4 translocation due to bistability (~4fold change in insulin concentration); however, the half
saturation values match with that of experimental data.
The response was ultrasensitive (Hill coefficient ~3.1) and
not bistable in absence of feedback loops (curve a, Fig
3A).
The set of equations given in 'appendix' and in 'methods'
section were solved numerically using fsolve program of
Page 6 of 16
(page number not for citation purposes)
Theoretical Biology and Medical Modelling 2004, 1:2
/>
Figure 3
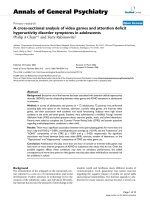
Hysteresis and bistability in insulin-stimulated GLUT4 translocation
Hysteresis and bistability in insulin-stimulated GLUT4 translocation. A. Dose response curve of insulin stimulated
fractional GLUT4 on plasma membrane. Curve 'a' is sigmoidal dose response curve [~Hill coefficient of 3.1] obtained in
absence of feedback loop. Curve 'b' represents hysteresis in insulin-stimulated fractional GLUT4 on plasma membrane in presence of feedback loop which impairs the ability of PTPase by 25%. Arrows indicate the switching-on [up arrow] and switchingoff [down arrow] GLUT4 translocation. B. A simulated type 2 diabetic condition represented by dose response curve of insulin-stimulated fractional GLUT4 on plasma membrane at higher phosphatase PTP1B concentration. Curve 'a' is typical bistable
response obtained in presence of positive feedback loops [PTP1B conc. 0.039 nM]. Curve 'b' represents dose response curve
when PTPase concentration was increased by 3 fold [PTP1B conc. 0.098 nM]. A 3-fold increase in the PTPase concentration
increased the half-maximal concentration by 100 fold and the response looses bistability.
Page 7 of 16
(page number not for citation purposes)
Theoretical Biology and Medical Modelling 2004, 1:2
Effect of system component concentration on GLUT4
translocation
To examine the influence of pathological conditions arising due to variations in protein expression levels on final
output response of insulin, we varied the concentration of
individual signaling components IRS-1, PI3K, lipids, PKCζ, Akt and phosphatases, PTP1B, PTEN and SHIP2 over a
wide range. For each case, the dose response curve of fractional GLUT4 on the plasma membrane at various insulin
concentrations was obtained and the response was quantified in-terms of half saturation constant. To illustrate
this, we consider a case of increase in PTP1B concentration. Fig. 3B shows the dose response curves for insulin
stimulated GLUT4 translocation at plasma membrane at
two different concentrations of PTP1B. At high PTP1B
concentration, the bistable dose response curve becomes
monostable (but, still ultrasensitive) and shifts to the
right. This indicates a nullifying effect of negative feedback regulation on PTP1B by Akt and higher requirement
of insulin for maximal translocation of GLUT4. Thus, in
Fig 3B curve 'a' and curve 'b' can be characterized by two
and one half saturation values respectively.
Fig. 4A and 4B show the distinct half saturation constant
values obtained for switching-on and switching-off of
GLUT4 translocation at various concentrations of IRS-1
and Akt respectively. Such an increase or decrease in the
half-maximal concentration of insulin characterizes the
decrease and increase in insulin sensitivity found in
diseased conditions. The threshold concentration of insulin required for switching-on GLUT4 translocation
decreases with increase in IRS-1 concentration. This
implies that, increase in IRS-1 concentration amplifies the
input signal and beyond a certain concentration of IRS-1
[~3 nM], the system looses bistability. Similar results were
obtained for variations in lipid, PI3K and insulin receptor
concentration (results not shown). GLUT4 translocation
at various concentrations of Akt shows that the system
becomes monostable when Akt concentration is
decreased. However, the degree of bistability (i.e., difference between half maximal concentrations for switch-on
and off) increases with increase in Akt concentration and
furthermore, the threshold value to activate GLUT4 translocation decreases.
To study the effect of signal attenuation enzymes such as
phosphatases on the output response, the concentrations
of PTP1B, PTEN and SHIP2 were altered over a wide
range, keeping other parameters constant. Fig. 4C and 4D
show the influence of variation in concentrations of
PTP1B and PTEN on half saturation constant of insulin.
Increase in PTP1B and PTEN concentration results in a
drastic increase in the threshold concentration of insulin
required to switch-on or switch-off GLUT4 translocation.
This illustrates that more insulin than physiological con-
/>
centration is required at higher phosphatase (PTP1B or
PTEN) concentrations to translocate GLUT4 from cytoplasm to plasma membrane. For example, around 16-fold
change in the insulin concentration is observed for a 1.5fold increase in PTP1B concentration from 0.039 nM to
0.06 nM. The system looses bistability beyond a narrow
range of PTP1B concentration between 0.02 nM to 0.05
nM. Thus, the response of GLUT4 translocation to insulin
is particularly sensitive to PTP1B concentration.
Influence of feedback on GLUT4 translocation
The feedback effect of active Akt on PTP1B was studied by
increasing the Akt concentration (Fig. 5A) and by changing the percentage feedback at a fixed Akt concentration
(Fig. 5B). As shown in Fig. 5A, increase in Akt concentration amplifies the signal by maintaining bistable
response. Similarly, by increasing the percentage feedback
at a fixed Akt concentration, (Fig. 5B) the degree of bistability dramatically increased, while not influencing the
threshold concentration required for switching-on the
response. The bistable response was not observed when
percentage feedback was smaller or in absence of feedback
loops. In absence of receptor internalization, 65% inhibition of PTP1B by Akt was required to display a bistable
response, whereas, inclusion of receptor internalization
demonstrated bistability even at 25% inhibition of
PTP1B.
The steady state analysis of metabolic insulin-signaling
pathway demonstrated signal amplification as signal
propagates down the cascades. The amount of insulin
required for 50% activation of insulin receptor, IRS-1,
PIP3, Akt, PKC-ζ and GLUT4 was estimated to decrease in
presence or absence of feedback loops (results not
shown).
Effect of system parameter values on GLUT4 translocation
In addition to genetic variation at the protein expression
levels in diseased conditions, mutational changes can also
alter the system parameters and thereby modify the final
output response. To examine the influence of system
parameter values on insulin-stimulated GLUT4 translocation, we have analyzed the performance of insulin signaling pathway to variations in key parameter values such as,
dissociation constant and Michaelis-Menten constant.
Increase in dissociation constant quantifying the interaction between insulin-receptor and phosphorylated IRS-1PI3K shows an increase in the half saturation constant
indicating higher requirement of insulin over the physiological concentration (Fig. 6A and 6B). The system
becomes monostable at very low values of dissociation
constants. Similarly, decrease in the Michaelis-Menten
constant of the dephosphorylation cycles, also increases
the half saturation constant, thus decreasing the insulin
sensitivity (Fig. 6C). Simulation results indicate that, the
Page 8 of 16
(page number not for citation purposes)
Theoretical Biology and Medical Modelling 2004, 1:2
/>
Half-maximal concentration of insulin required for 50% GLUT4 translocation at elevated levels of signaling components
Figure 4
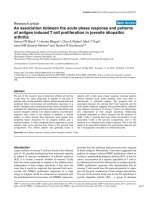
Half-maximal concentration of insulin required for 50% GLUT4 translocation at elevated levels of signaling
components. Curve 'a' shows half maximal concentration of insulin required to switch-on GLUT4 translocation. Curve 'b'
shows half maximal concentration of insulin required to switch-off GLUT4 translocation. Arrow indicates physiological concentration of particular signaling components. A. Half saturation constant at various concentration of IRS-1. Simulated results indicate increased insulin sensitivity when IRS-1 overexpressed. B. Half saturation constant at various concentration of Akt.
Simulated results indicate increased insulin sensitivity when Akt overexpressed and loss of bistability when Akt concentration
decreased below 0.01 nM. C. Half saturation constant at various concentration of PTP1B. Simulated results indicate decreased
insulin sensitivity when PTP1B overexpressed. D. Half saturation constant at various concentration of PTEN. Simulated results
indicate decreased insulin sensitivity when PTEN overexpressed.
alterations in binding constant of allosteric interactions
and Michaelis-Menten constants in modification-demodification cycles in the insulin-signaling pathway can result
in insulin resistance or diabetes.
Discussion
In this work we have demonstrated that, the dose
response curves of fractional GLUT4 concentration on
plasma membrane at various concentration of insulin
Page 9 of 16
(page number not for citation purposes)
Theoretical Biology and Medical Modelling 2004, 1:2
/>
Figure 5
Influence of feedback effects on bistable insulin-stimulated GLUT4 translocation
Influence of feedback effects on bistable insulin-stimulated GLUT4 translocation. A. Bistable response with
increase in the concentration of Akt representing increased non-linearity due to zero order ultrasensitivity. Dose response
curves obtained at different Akt concentrations: Curve 'a', 0.01 nM; Curve 'b', 0.03 nM; Curve 'c', 0.05 nM. B. Influence of percentage of feedback effects on dose response curve of insulin-stimulated GLUT4 translocation. The percentage feedback represents the percentage by which the dephosphorylation ability of PTP1B is impaired. Dose response curves obtained: Curve 'a'
in absence of feedback; Curve 'b' 25% feedback effect; Curve 'c' 67% feedback effect; Curve 'd' 90% feedback effect.
Page 10 of 16
(page number not for citation purposes)
Theoretical Biology and Medical Modelling 2004, 1:2
/>
Figure key
Effect of6 system parameter values on GLUT4 translocation
Effect of key system parameter values on GLUT4 translocation. Curve 'a' shows half maximal concentration of insulin
required to switch-on GLUT4 translocation. Curve 'b' shows half maximal concentration of insulin required to switch-off
GLUT4 translocation. Arrow indicates parameter used in the simulation. A. Half maximal concentration of insulin required for
GLUT4 translocation at different values of dissociation constant [Kd2] for binding of second molecule of insulin to phosphorylated insulin bound receptor. Simulated results indicate decreased insulin sensitivity when Kd2 increased. B. Half maximal concentration of insulin required for GLUT4 translocation at different values of dissociation constant [Kd3] for binding of
phosphorylated IRS-1 to PI3K species. Simulated results indicate decreased insulin sensitivity when Kd3 increased. C. Half maximal concentration of insulin required for GLUT4 translocation at different values of Michaelis-Menten constant [Km2] for
dephosphorylation of phosphorylated IRS1 by PTP1B. Simulated results indicate decreased insulin sensitivity when MichaelisMenten constant [Km2] was decreased due to increased affinity with dephosphorylating enzyme.
Page 11 of 16
(page number not for citation purposes)
Theoretical Biology and Medical Modelling 2004, 1:2
exhibit hysteresis-a property of bistable systems. The
analysis of bistable response in presence of feedback
loops was done at varying concentration of signaling
components and system parameters in physiological
range. The overall response of insulin demonstrated signal amplification as the signal propagates down the cascade, thus requiring less insulin for GLUT4 translocation.
The insulin sensitivity increased by increasing the concentration of proteins that amplify the insulin action and
decreasing the concentration of proteins that attenuate
insulin-signaling pathway. This indicates that the bistability and the half saturation constant are dependent on the
component concentrations and system parameters.
It is known that defects in insulin signaling pathway leads
to pathological conditions like diabetes, wherein normal
or elevated levels of insulin produces impaired biological
response. This characteristic decrease or increase in insulin sensitivity is mainly attributed to post-receptor defects
including mutational changes in protein expression levels
or other parameters like dissociation constants and
Michaelis-Menten constants [13,33]. Numerous experimental studies like targeted deletions/mutations of signaling components have yielded insights about the disease
states. In the present work, to study the influence of pathological conditions on final output response of insulin,
the concentration of individual signaling components
was varied over a wide range, by keeping other parameters
constant. The predicted results are consistent with various
reported experimental observations and thus validate our
steady state model. (i) Decreased concentration of
phosphorylated insulin receptor and IRS-1 are observed
in muscle from morbidly obese subjects [34] and those
with diabetes [35]. This decreased phosphorylation can be
either due to decrease in protein concentration itself or
impaired phosphorylation event. (ii) Increase in the level
and activity of several tyrosine phosphatases (PTP1B) was
found to be associated with insulin resistance and reduced
insulin sensitivity [12,13,33,36]. (iii) Overexpression of
PI3K and its downstream targets Akt and PKC in cell culture models increased GLUT4 translocation [12]. (iv)
Decrease in the association of PI3K with phosphorylated
IRS-1 and subsequent activation appears to be a characteristic abnormality in type 2 diabetes and obesity [13,3335]. (v) Single gene knockout experiments have shown
that, mice with PTP1B knockout [37], mice with SHIP2
knockout [38] and targeted deletion of PTEN in murine
lever [39], all results in hypersensitivity towards insulin.
In the present work, though we have not done in-silico perturbation analysis by deleting a particular protein, we
have changed the concentration of specific protein over
wide range to bring about the similar effect of deficiency.
Thus, our simulation results show that the insulin sensitivity dramatically increased when we decreased the concentration of phosphatases like PTP1B, PTEN and SHIP2.
/>
Increase in the concentration of Akt, makes the signal
amplification increased along with slight increase in the
degree of bistability. This effect is brought about by the
enhanced nonlinearity in the feedback loop due to zero
order ultrasensitivity [28] imposed by increasing the concentration of Akt or percentage feedback. At high Akt concentration (or when overexpressed), the system can
respond in constitutively active mode or might also function as a memory module. That is, once insulin switches
on the system, the high Akt concentration or percentage
feedback by itself can keep the switch on even after insulin
is removed. This may be the reason for the experimental
observation of insulin independent GLUT4 translocation
to plasma membrane when Akt is overexpressed [12,40].
This insulin independent translocation of GLUT4 is
thought to be due to activation of PI3K independent pathway or by amplification of residual signal. Our analysis
indicates that the inherent feedback structure present in
the insulin-signaling pathway by itself can induce this
phenomenon.
Does GLUT4 translocation show a bistable response to
insulin in-vivo?
Bistability has been shown to be the outcome of regulatory structure with feedback loops and non-linearity in
the system [41]. The non-linearity in the system is brought
about by an ultrasensitive response typically obtained
through enzyme cascades. Such ultrasensitive responses
exhibit steep dose response curves with Hill coefficient
greater than one [1]. The cascade systems use energy for
their operation and are optimally operated under zero
order sensitivity (i.e., cascades operating under saturating
interconvertable enzymes) requiring minimum energy
[42,43]. Presence of feedback loops may further optimize
the requirement of energy. Enzyme cascades and multiple
positive feedback loops are observed in insulin-signaling
pathway. Experimental results have shown that the dose
response curve of insulin-stimulated glucose uptake is
subsensitive with a Hill coefficient of about 0.8 [calculated from ref. [32]]. Thus the question arises as to what
may be the significance of the cascade signaling system
with positive feedback loops in insulin signaling pathway.
The reason for this discrepancy may be because, the experimental data represents a profile of glucose uptake in
ensemble of cells [32], and furthermore, glucose uptake
may not be proportional to the amount of GLUT4 on cell
surface [18].
Recently, bistability has been experimentally demonstrated in many cellular regulation systems [10]. Experiments on cellular differentiation and cell-cycle
progression have shown that, to demonstrate bistability it
is essential to measure the amount of input required to
switch-on the system from a low activity state to a high
activity state, and amount of input required to hold-on
Page 12 of 16
(page number not for citation purposes)
Theoretical Biology and Medical Modelling 2004, 1:2
the system in high activity state [3-5]. Reynolds et al. [8],
have shown experimentally that, the reaction network of
PTPase inhibition by activated epidermal growth factor
receptor (EGFR, a receptor tyrosine kinase, RTK) through
reactive oxygen species, can generate highly amplified and
switch like bistable response to a threshold concentration
of ligand stimulus. In this system, PTPase is a negative
regulator of active RTK and thus, PTPase inhibition by
reactive oxygen species serves as a positive feedback loop.
Our simulation results indicate that similar bistable
response can be obtained in insulin-stimulated GLUT4
translocation because of the positive feedback loops
(inhibitory action of Akt on PTP1B). Though experimental verification of this property is awaited, there are indications that insulin signaling pathway possesses many
requisite components to exhibit bistable response. The
simulation results presented here showed that, the ultrasensitivity in absence of feedback effects and the regulatory structure of feedback loops are main reasons for a
bistable response. Other than the positive feedback loops
considered in the present work, Insulin signaling system is
also known to contain many feedback loops which have
not been entirely characterized [15]. One possible reason
for having so many interlocking positive feedback and
negative feedback loops may be to cause oscillations in
GLUT4 translocation or to make the bistability of GLUT4
translocation – more robust.
Recently, it has been shown that insulin stimulation in a
variety of cell types elicit a rapid production of hydrogen
peroxide and which reversibly inhibit PTP1B enhancing
propagation of the early insulin signal [44]. This regulatory mechanism was also found to be essential for PI3K
mediated Akt activation, GLUT4 translocation to plasma
membrane and insulin-stimulated glucose uptake [45].
However, unlike EGFR system [8] existence of bistable
behavior is yet to be shown in insulin signaling system. In
insulin signaling pathway other than GLUT4, proteins like
Akt and PKC get translocated to plasma membrane and
such inter-compartmental translocations can also exhibit
switch like bistable response [9].
It is becoming clear that quantification studies have to be
performed in single cell rather than cell populations [19].
This is true especially while addressing the system level
questions like ultrasensitivity, bistability and oscillations
[4-7,46]. Recently, this was also found to be of immense
value in case of insulin signaling pathway to uncover the
PIP3 activation mode [47]. Simultaneous measurement of
PIP3 production and GLUT4 insertion in individual
3T3L1 adipocytes suggested that a threshold for PIP3 signals exists. Below this threshold, GLUT4 transporters are
minimally inserted into the plasma membrane and their
insertion increases once this threshold is overcome. In
/>
summary, it is essential to show through experiments that,
the stimulus-response curve for insulin-stimulated
GLUT4 translocation exhibits hysteresis, – a distinctive
splitting in stimulus response curve. There should be a
particular concentration of insulin, which is not sufficient
to translocate GLUT4 to plasma membrane, but is sufficient to maintain GLUT4 on plasma membrane.
What may be the significance of such a bistable behavior
in GLUT4 translocation? Though there is no obvious
answer to this question yet, it is known that, bistability
can maintain a biological response even when the input
stimulus is brief and the high activity level is maintained
only as long as the system requires. Insulin binding to its
cell surface receptor is rapidly followed by internalization
of insulin-receptor complex. This internalization of receptor has been implicated in receptor down regulation,
attenuation of insulin sensitivity and insulin clearance
from the circulation [12,13]. Thus a brief input stimulation should be sufficient to balance the translocation of
GLUT4 to plasma membrane and its reversal depending
on glucose concentration. Additionally, due to small
absolute stimulus concentrations, the probability of noise
occurrence is high. A bistable response having distinct
threshold concentration to switch-on and switch-off
offers advantage in handling noise.
In cellular regulation, different structural motifs such as
enzyme cascades, feedforward control and multiple feedback loops yield complex regulatory networks. These are
shown to be responsible for exhibiting system level properties including bistability and robustness [10,48,49].
Other than multiple feedback loops, structural regulatory
motifs like multisite covalent modification cycles have
been shown to induce bistability [50]. The interconnections between these regulatory motifs at the system level
may elicit a multistable response to particular stimuli,
which have to be theoretically uncovered and demonstrated through experiments.
Abbreviations used
GLUT4: Glucose-transporter isoform 4;
IRS: Insulin-receptor substrate;
PI3K: Phosphatidylinositol-3-kinase;
PIP3: Phosphatidylinositol (PI)-3,4,5-tiphosphate (PI3,4,5-P3);
Akt: Protein kinase Akt or protein kinase B (PKB);
PKC: Protein kinase C;
PTP1B: Protein tyrosine phosphatase 1B;
Page 13 of 16
(page number not for citation purposes)
Theoretical Biology and Medical Modelling 2004, 1:2
PTEN: 3' lipid phosphatase;
/>
It = I + XI + XIP + 2XI2P + PTP.XIP + A.XI2P + XIPi + 2XI2Pi
+ PTP.XIPi + PTP.XI2Pi [A1]
SHIP2: 5' lipid phosphatase;
Competing Interests
Xt = X + Xi + XI + XIP + XI2P + XIPi + XI2Pi + PTP.XIP +
A.XI2P + PTP.XIPi + PTP.XI2Pi [A2]
None declared.
At = A + AP + APB + A.XI2P + PTP.AP + APB.CP2
[A3]
Author's Contributions
LG, VKM and KVV conceived and designed the experiments. LG performed the experiments. LG, VKM and KVV
analyzed the data. VKM and KVV conceptualize the manuscript. All authors have read and approved the final
manuscript
CP2t = CP2 + CP3 + CP2' + APB.CP2 + PTEN.CP3 +
SHIP2.CP3 + SHIP2.CP3 + E6.CP2' + F.CP3 [A4]
Ft = F + FP +CP3F + E8.FP
[A5]
SHIP2t = SHIP2 + SHIP2.CP3
[A6]
Appendix
Equilibrium relationships, rate equations, mass balance equations and model parameters used for simulation of metabolic insulin signaling system at steady
state (refer Fig. 2 for nomenclature and interaction
details). Equations were solved simultaneously, for evaluating fractional GLUT4 translocation at a particular insulin concentration, using fsolve function of Matlab (The
MathWorks Inc. USA). Most of the values of model
parameters for steady state analysis are taken from Sedaghat et al. [26]. Nomenclature, parameter values are:
Component concentrations
It, total insulin concentration varied over a wide range; Xt,
total receptor = 0.003 nM; At, total IRS-1= 0.01 nM, Bt,
total PI3-Kinase = 0.5 nM, PTENt, total PTEN= 0.007 nM;
CP2t, total lipid = 0.01 nM; SHIP2t, total SHIP2 = 0.001
nM; Ft, total Akt+PKC-ξ = 0.02 nM, PTPmax, total PTP1B=
0.039 nM; Gt, total GLUT4 = 9 nM; E6t, total E6 = 0.001
nM; E8t, total E8 = 0.001 nM;
Rate constants
k0 = 2500 min-1; k = 0.2 min-1; k1= 4.16 min-1; k2 = 1.4
min-1; k3 = 50 min-1 (assumed); k4 = 42.1 min-1; k5 = 2.8
min-1; k6 = 3 min-1; k7 = 20 min-1 (assumed); k8 = 6.9 min1; k = 0.11 min-1; k
-1
-1
9
10 = 0.0012 min ; k11 = 3.47 min
(assumed); k12 = 6.96*10-3 min-1; k13 = 0.17 min-1; kp =
0.461 min-1 ; kd = 1.67 × 10⁻¹⁸ min-1 ; ks = 1.67*10-25 nM
min -1;
Dissociation constants
Kd1= 3.33 nM; Kd2 = 333.3 nM; Kd3 = 0.014 nM;
Distribution coefficients
Kd4 = 9 nM; Kd5 = 0.1 nM;
Michaelis-Menten constants
Kmr, Km1 to Km8 = 10-4 nM
The total molar balances for different species are given
below.
PTENt = PTEN + PTEN.CP3
[A7]
PTPt = PTP + PTP.XIP + PTP.AP + PTP.XIPi + PTP.XI2Pi
[A8]
Bt = B + APB + CP2.APB
E6t = E6 + E6.CP2'
E8t = E8 + E8.FP
Gt = GM + GC
[A9]
[A10]
[A11]
[A12]
Equilibrium relationships
Kd1 =
Kd2 =
Kd3 =
I( X )
( XI )
I ( XIP )
( XI2P )
B ( AP )
( APB )
Kd4 =
X
Xi
Kd5 =
( XIP + XI2P )
( XIPi + XI2Pi )
[A13]
[A14]
[A15]
[A16]
[A17]
Rate expression with pseudo-steady state representation of complexes for modification-demodification
cycles
Receptor autophosphorylation and dephosphorylation
cycle
Page 14 of 16
(page number not for citation purposes)
Theoretical Biology and Medical Modelling 2004, 1:2
/>
16.
XIP
k0 ( XI ) = k ( PTP )
Km
17.
[A18]
IRS-1 phosphorylation and dephosphorylation cycle
18.
19.
k1
( XI2 P )( A )
Km1
= k2
( PTP )( AP )
Km2
20.
[A19]
Phosphorylation and Dephosphorylation of PI-4,5-P2,
PI-3,4-P2 and PIP3
21.
22.
k3
k5
( APB )( CP 2 )
Km3
= k4
( SHIP 2 )( CP 3 )
Km5
( PTEN )( CP 3 )
[A20]
Km4
= k6
24.
( E6 ) ( CP 2’ )
[A21]
Km6
Phosphorylation and Dephosphorylation of Akt + PKC
k7
( F )( CP 3 )
Km7
= k8
( E8 ) ( FP )
Km8
2.
3.
4.
5.
6.
7.
8.
9.
10.
11.
12.
13.
14.
15.
25.
26.
[A22]
References
1.
23.
Ferrell JE Jr: Tripping the switch fantastic: how a protein
kinase cascade can convert graded inputs into switch-like
outputs. Trends Biochem Sci 1996, 21:460-466.
Bagowski CP, Ferrell JE Jr: Bistability in the JNK cascade. Curr Biol
2001, 11:1176-1182.
Becskei A, Seraphin B, Serrano L: Positive feedback in eukaryotic
gene networks: cell differentiation by graded to binary
response conversion. EMBO J 2001, 20:2528-2535.
Pomerening JR, Sontag ED, Ferrell JE Jr: Building a cell cycle oscillator: hysteresis and bistability in the activation of Cdc2. Nat
Cell Biol 2003, 5:346-351.
Sha W, Moore J, Chen K, Lassaletta AD, Yi CS, Tyson JJ, Sible JC:
Hysteresis drives cell-cycle transitions in Xenopus laevis egg
extracts. Proc Natl Acad Sci USA 2003, 100:975-980.
Xiong W, Ferrell JE Jr: A positive-feedback-based bistable
memory module that governs a cell fate decision. Nature 2003,
426:460-465.
Ozbudak EM, Thattai M, Lim HN, Shraiman BI, Oudenaarden AV:
Multistability in the lactose utilization network of Escherichia
coli. Nature 2004, 427:737-740.
Reynolds AR, Tischer C, Verveer PJ, Rocks O, Bastiens PIH: EGFR
activation coupled to inhibition of tyrosine phosphatases
causes lateral signal propagation. Nature Cell Biol 2003,
5:447-453.
Teruel MN, Meyer T: Parallel signal-cell monitoring of receptor-triggered membrane translocation of a calcium-sensing
protein module. Science 2002, 295:1910-1912.
Ferrell Jr JE: Self-perpetuating states in signal transduction:
positive feedback, double-negative feedback and bistability.
Curr Opin Chem Biol 2002, 14:140-148.
Saltiel AR, Kahn CR: Insulin signaling and the regulation of glucose and lipid metabolism. Nature 2001, 414:799-806.
Nystrom FH, Quon MJ: Insulin signalling: Metabolic pathways
and mechanisms for specificity. Cell Signal 1999, 11:563-574.
Shepherd PR, Kahn BB: Glucose transporters and insulin action:
implication for insulin resistance and diabetes mellitus. N Engl
J Med 1999, 341:248-257.
Bryant NJ, Govers R, James DE: Regulated transport of the glucose transporter GLUT4. Nat Rev Mol Cell Biol 2002, 3:267-277.
Johnston AM, Pirola L, Obberghen EV: Molecular mechanisms of
insulin receptor substrate protein-mediated modulation of
insulin signaling. FEBS Lett 2003, 546:32-36.
27.
28.
29.
30.
31.
32.
33.
34.
35.
36.
37.
38.
Saltiel AR, Pessin JE: Insulin signaling pathways in time and
space. Trends Cell Biol 2002, 12:65-71.
Watson RT, Kanzaki M, Pessin JE: Regulated membrane trafficking of the insulin-responsive glucose transporter 4 in
adipocytes. Endocrine Rev 2004, 25:177-204.
Kandror KV: A long search for GLUT4 activation. Sci STKE
2003:PE5.
Meyer T, Teruel MN: Fluorescence imaging of signaling
networks. Trends Cell Biol 2003, 13:101-106.
Shymko RM, Dumont E, De Meyts P, Dumont JE: Timing-dependence of insulin-receptor mitogenic versus metabolic signalling: a plausible model based on coincidence of hormone and
effector binding. Biochem J 1999, 339:675-683.
Wanant S, Quon MJ: Insulin receptor binding kinetics: modeling and simulation studies. J Theor Biol 2000, 205:355-364.
Quon MJ, Campfield LA: A mathematical model and computer
simulation study of insulin receptor regulation. J Theor Biol
1991, 150:59-72.
Quon MJ: Advances in kinetic analysis of insulin-stimulated
GLUT-4 translocation in adipose cells. Am J Physiol 1994,
266:E144-E150.
Holman GD, Lo Leggio L, Cushman SW: Insulin-stimulated
GLUT4 glucose transporter recycling. A problem in membrane protein subcellular trafficking through multiple pools.
J Biol Chem 1994, 269:17516-17524.
Quon MJ, Campfield LA: A mathematical model and computer
simulation study of insulin-sensitive glucose transporter
regulation. J Theor Biol 1991, 150:93-107.
Sedaghat AR, Sherman A, Quon MJ: A mathematical model of
metabolic insulin signaling pathways. Am J Physiol Endocrinol
Metab 2002, 283:E1084-E1101.
Elmendorf JS: Signals that regulate GLUT4 translocation. J
Membr Biol 2002, 190:167-174.
Goldbeter A, Koshland DE Jr: An amplified sensitivity arising
from covalent modification in biological systems. Proc Natl
Acad Sci USA 1981, 78:6840-6844.
Di Guglielmo GM, Drake PG, Baass PC, Authier F, Posner BI,
Bergeron JJM: Insulin receptor internalization and signaling.
Mol Cell Biochem 1998, 182:59-63.
Shi K, Egawa K, Maegawa H, Nakamura T, Ugi S, Nishio Y, Kashiwagi
A: Protein-Tyrosine Phosphatase 1B Associates with Insulin
Receptor and Negatively Regulates Insulin Signaling without
Receptor Internalization. J Biochem 2004, 136:89-96.
Ravichandran LV, Chen H, Li Y, Quon MJ: Phosphorylation of
PTP1B at Ser (50) by Akt impairs its ability to dephosphorylate the insulin receptor. Mol Endocrinol 2001, 15:1768-1780.
Stagsted J, Hansen T, Roth RA, Goldstein A, Olsson L: Correlation
between insulin receptor occupancy and tyrosine kinase
activity at low insulin concentrations and effect of major histocompatibility complex class I-derived peptide. J Pharmacol
Exp Ther 1993, 267:997-1001.
Pessin JE, Saltiel AR: Signaling pathways in insulin action:
molecular targets of insulin resistance. J Clin Invest 2000,
106:165-169.
Goodyear LJ, Giorgino F, Sherman LA, Carey J, Smith RJ, Dohm GL:
Insulin receptor phosphorylation, insulin receptor substrate1 phosphorylation, and phosphatidylinositol 3-kinase activity
are decreased in intact skeletal muscle strips from obese
subjects. J Clin Invest 1995, 95:2195-2204.
Bjornholm M, Kawano Y, Lehtihet M, Zierath JR: Insulin receptor
substrate-1 phosphorylation and phosphatidylinositol 3kinase activity in skeletal muscle from NIDDM subjects after
in vivo insulin stimulation. Diabetes 1997, 46:524-527.
Ahmad F, Azevedo JL, Cortright R, Dohm GL, Goldstein BJ: Alterations in skeletal muscle protein-tyrosine phosphatase activity and expression in insulin-resistant human obesity and
diabetes. J Clin Invest 1997, 100:449-458.
Elchebly M, Payette P, Michaliszyn E, Cromlish W, Collins S, Loy AL,
Normandin D, Cheng A, Himms-Hagen J, Chan CC, Ramachandran C,
Gresser MJ, Tremblay ML, Kennedy BP: Increased insulin sensitivity and obesity resistance in mice lacking the protein tyrosine phosphatase-1B gene. Science 1999, 283:1544-1548.
Clément S, Krause U, Desmedt F, Tanti JF, Behrends J, Pesesse X, Sasaki T, Penninger J, Doherty M, Malaisse W, Dumont JE, Le MarchandBrustel Y, Erneux C, Hue L, Schurmans S: The lipid phosphatase
SHIP2 controls insulin sensitivity. Nature 2001, 409:92-7.
Page 15 of 16
(page number not for citation purposes)
Theoretical Biology and Medical Modelling 2004, 1:2
39.
40.
41.
42.
43.
44.
45.
46.
47.
48.
49.
50.
/>
Stiles B, Wang Y, Stahl A, Bassilian A, Lee WP, Kim YJ, Sherwin R,
Devaskar S, Lesche R, Magnuson MA, Wu H: Liver-specific deletion of negative regulator PTEN results in fatty liver and
insulin hypersensitivity. Proc Natl Acad Sci USA 2004,
101:2082-2087.
Cong LN, Chen H, Li Y, Zhou L, McGibbon MA, Taylor SI, Quon MJ:
Physiological role of Akt in insulin-stimulated translocation
of GLUT4 in transfected rat adipose cells. Mol Endocrinol 1997,
11:1881-1890.
Angeli D, Ferrell JE Jr, Sontag ED: Detection of multistability,
bifurcations, and hysteresis in a large class of biological positive-feedback systems. Proc Natl Acad Sci USA 2004,
101:1822-1827.
Shacter E, Chock PB, Stadtman ER: Energy consumption in a
cyclic phosphorylation/dephosphorylation cascade. J Biol Chem
1984, 259:12260-12264.
Goldbeter A, Koshland DE Jr: Energy expenditure in the control
of biochemical systems by covalent modification. J Biol Chem
1987, 262:4460-4471.
Mahadev K, Zilbering A, Zhu L, Goldstein BJ: Insulin-stimulated
hydrogen peroxide reversibly inhibits protein tyrosine phosphatase 1B in-vivo and enhances the early insulin action
cascade. J Biol Chem 2001, 276:21938-21942.
Mahadev K, Wu X, Zilbering A, Zhu L, Todd J, Lawrence R, Goldstein
BJ: Hydrogen peroxide generated during cellular insulin stimulation is integral to activation of the distal insulin signaling
cascade in 3T3-L1 adipocytes. J Biol Chem 2001,
276:48662-48669.
Ferrell JE Jr, Machleder EM: The biochemical basis of an all-ornone cell fate switch in Xenopus oocytes. Science 1998,
280:895-898.
Tengholm A, Meyer T: A PI3-kinase code for insulin-triggered
insertion of glucose transporters into the plasma
membrane. Curr Biol 2002, 12:1871-1876.
Bhalla US, Ram PT, Iyengar R: MAP kinase phosphatase as a locus
of flexibility in a mitogen-activated protein kinase signaling
network. Science 2002, 297:1018-1023.
Venkatesh KV, Bhartiya S, Ruhela A: Multiple feedback loops are
key to dynamic performance of tryptophan regulation in
Escherichia coli. FEBS Lett 2004, 563:234-240.
Markevich NI, Hoek JB, Kholodenko BN: Signaling switches and
bistability arising from multisite phosphorylation in protein
kinase cascades. J Cell Biol 2004, 164:353-359.
Publish with Bio Med Central and every
scientist can read your work free of charge
"BioMed Central will be the most significant development for
disseminating the results of biomedical researc h in our lifetime."
Sir Paul Nurse, Cancer Research UK
Your research papers will be:
available free of charge to the entire biomedical community
peer reviewed and published immediately upon acceptance
cited in PubMed and archived on PubMed Central
yours — you keep the copyright
BioMedcentral
Submit your manuscript here:
/>
Page 16 of 16
(page number not for citation purposes)