Báo cáo y học: " A rational treatment of Mendelian genetics" ppsx
Bạn đang xem bản rút gọn của tài liệu. Xem và tải ngay bản đầy đủ của tài liệu tại đây (544.98 KB, 17 trang )
BioMed Central
Page 1 of 17
(page number not for citation purposes)
Theoretical Biology and Medical
Modelling
Open Access
Research
A rational treatment of Mendelian genetics
John W Porteous*
Address: Department of Molecular and Cell Biology, Institute of Medical Sciences, University of Aberdeen, Foresterhill, Aberdeen AB25 2ZD,
Scotland, UK
Email: John W Porteous* -
* Corresponding author
Abstract
Background: The key to a rational treatment of elementary Mendelian genetics, specifically to an
understanding of the origin of dominant and recessive traits, lies in the facts that: (1) alleles of genes
encode polypeptides; (2) most polypeptides are catalysts, i.e. enzymes or translocators; (3) the
molecular components of all traits in all cells are the products of systems of enzymes, i.e. of fluxing
metabolic pathways; (4) any flux to the molecular components of a trait responds non-linearly
(non-additively) to graded mutations in the activity of any one of the enzymes at a catalytic locus
in a metabolic system; (5) as the flux responds to graded changes in the activity of an enzyme, the
concentrations of the molecular components of a trait also change.
Conclusions: It is then possible to account rationally, and without misrepresenting Mendel, for:
the origin of dominant and recessive traits; the occurrence of Mendel's 3(dominant):1(recessive)
trait ratio; deviations from this ratio; the absence of dominant and recessive traits in some
circumstances, the occurrence of a blending of traits in others; the frequent occurrence of
pleiotropy and epistasis.
1. Background
The currently favoured explanation for the origin of Men-
del's dominant and recessive traits is untenable [1]. The
primary error in this current attempted explanation is the
assumption that there is a direct, proportional, relation-
ship in a diploid cell between a series of allegedly domi-
nant and recessive alleles written as (AA + 2Aa + aa) and
the dominant, hybrid and recessive traits written as (AA +
2Aa + aa). This assumption (Figure 2, in reference [1])
incorporates four fundamental faults:
(i) A failure to distinguish between the parameters and the
variables of any system of interacting components, specif-
ically between the determinants (alleles in modern termi-
nology) and what is determined (the form of the trait or
characteristic expressed in a cell or organism). Thus,
because Mendel defined the terms dominant and recessive
for traits or characters, it was illegitimate (and illogical) to
call alleles dominant or recessive, and to represent them
by the same letters used by Mendel to represent traits [1].
(ii) A trait series written as (AA + 2Aa + aa) suggests, incor-
rectly, that dominant and recessive traits comprise two
aliquots, (A + A) or (a + a), of dominance or recessivity.
(iii) A failure to take account of the long established fact
that the first non-nucleotide product of the expression of
an allele is a polypeptide and that most polypeptides are
enzymes or membrane-located translocators.
(iv) A failure to note that the components of all tangible
traits comprised the molecular products of metabolic
Published: 31 August 2004
Theoretical Biology and Medical Modelling 2004, 1:6 doi:10.1186/1742-4682-1-6
Received: 11 June 2004
Accepted: 31 August 2004
This article is available from: />© 2004 Porteous; licensee BioMed Central Ltd.
This is an open-access article distributed under the terms of the Creative Commons Attribution License ( />),
which permits unrestricted use, distribution, and reproduction in any medium, provided the original work is properly cited.
Theoretical Biology and Medical Modelling 2004, 1:6 />Page 2 of 17
(page number not for citation purposes)
pathways, i.e., the products of sequences of enzyme-cata-
lysed reactions.
Correction of the first two of these four faults has already
been achieved (section 4 in reference [1]) by writing an
allele series as (UU + 2Uu + uu) and the corresponding
trait series as (A + 2H + a). In these statements (U) and (u)
are normal and mutant (not dominant and recessive) alle-
les respectively. Mendel's notation (A) and (a) is used to
represent dominant and recessive traits but (H) replaces
Mendel's implausible notation (Aa) for a hybrid class of
trait [1]. Mutations at another gene locus, in the same or
a different cell, will be written as (WW + Ww + ww); the
corresponding trait series will appear as (B + 2H + b).
Mendel's notation (Aa) for a hybrid trait will be used in
this article only when referring directly to Mendel's paper
[2].
2. A rational explanation of Mendel's
observations
Our stated task was to explain logically how an allele
series (UU + 2Uu + uu) is expressed as a series of qualita-
tively distinguishable F2 traits (A + 2H + a) when F1
hybrids (H) are allowed to self-fertilise [1]. This is very
simply achieved by correcting faults (iii) and (iv) in four
successive steps (sections 2.1–2.4) based on a paper pub-
lished 23 years ago [3]. A fifth step (section 2.5) allows us
to go beyond that paper to explain how the trait ratio
3(dominant):1(recessive) sometimes occurs and some-
times does not. A sixth step (section 2.6), consistent with
the earlier ones, explains why dominance and recessivity
are not always observed. Section 2.7 validates an earlier
section. Section 2.8 accounts for some aspects not dealt
with in textbooks and reviews of genetics.
The treatment in this section 2 is extended in section 3 to
account for quantitatively different traits, in section 4 to
illustrate some implications of the present treatment, and
in section 5 to account for pleiotropy and epistasis. Sec-
tion 6 defines the conditions that must be met if a rational
account is to be given for the occurrence of dominant and
recessive traits.
2.1. A generalised metabolic system
If: the first non-nucleotide product of expression of an
allele is a polypeptide and most polypeptides are enzymes
[3,4], it follows that most mutations at any one gene locus
will result in the formation of a mutant enzyme at a cata-
lytic locus in a metabolic pathway. This is true even if the
functioning enzyme is composed of more than one
polypeptide, each specified by different genes. It then fol-
lows that we need to ask how the concentration of a nor-
mal molecular component of a trait will be affected by a
mutation of any one enzyme within a metabolic system. In
short, a systemic approach, outlined below, is obligatory.
This is the key to an understanding of the origin of domi-
nant and recessive traits, as first pointed out in the follow-
ing two sentences: "When as geneticists, we consider
substitutions of alleles at a locus, as biochemists, we con-
sider alterations in catalytic parameters at an enzyme step.
- The effect on the phenotype of altering the genetic
specification of a single enzyme - - - is unpredictable from
a knowledge of events at that step alone and must involve
the response of the system to alterations of single enzymes
when they are embedded in the matrix of all other enzymes."
([3]; p.641).
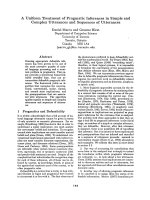
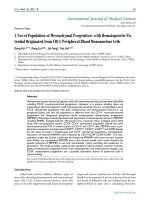
Accounting for Mendel's observation of a 3(domi-nant):1(recessive) trait ratio in his F2 populations of plantsFigure 2
Accounting for Mendel's observation of a 3(domi-
nant):1(recessive) trait ratio in his F2 populations of plants.
Mendel's notations for a dominant trait, a hybrid and a reces-
sive trait were (A), (Aa) and (a) respectively. For reasons
given in the preceding paper [1], a hybrid trait is represented
in Figure 2 by (H). The molecular components of all traits are
synthesised by a metabolic pathway. When the activity of any
one enzyme in a metabolic pathway is changed in discrete
steps, the flux to a trait component responds in non-linear
(non-additive) fashion [3]. If the flux response is quasi-hyper-
bolic, as shown here, the hybrid trait (H) will be indistinguish-
able from the trait (A) expressed in the wild-type cell or
organism, even when the enzyme activity in the hybrid (H)
has been reduced to 50% of the wild-type activity. Trait (a),
will be distinguishable from both traits (A) and (H) only if the
enzyme activity is further reduced to a sufficient extent.
Under these circumstances the trait series (A + 2H + a)
becomes (3A + a); Mendel's 3(dominant):1(recessive) trait
ratio is accounted for without introducing arbitrary and
inconsistent arguments [1].
0
50
100
0 50 100
Relative enzyme activity
Flux to trait component
A
, H
a
Mendel's traits
uu uU UU
Allele constitution
Theoretical Biology and Medical Modelling 2004, 1:6 />Page 3 of 17
(page number not for citation purposes)
2.2 Metabolic systems and steady states
Metabolic processes are facilitated by a succession of cata-
lysed steps; i.e. by enzyme-catalysed transformations of
substrates to products or by carrier-catalysed translocation
of metabolites across membranes. Because enzymes and
membrane-located carriers (or porters) are saturable cata-
lysts that exhibit similar kinetics it is convenient in this
article to refer only to enzymes and to represent both
kinds of catalysts by the letter E. Any segment of a
sequence of enzyme-catalysed reactions can then be writ-
ten as shown in Figure 1.
There are ten important features of any such system.
(1) Each enzyme, E
1
to E
6
, is embedded within a meta-
bolic pathway, i.e. within a system of enzymes.
(2) All components of this system except the external
metabolites X
0
and X
6
are enclosed by a membrane.
(3) E
1
and E
6
may then represent membrane-located
enzymes or translocators.
(4)X
0
and X
6
interact with only one enzyme, whereas each
internal metabolite (S
1
, S
2
, S
3
, S
4
, S
5
) interacts with two
flanking enzymes.
(5) In a haploid cell there will be one specimen of an
enzyme molecule (E) at each catalytic locus. In a diploid
cell there will be two specimens of enzyme molecules
(two allozymes) at each catalytic locus: one specified by
the maternal allele, the other by the paternal allele, at the
corresponding gene locus or loci. The effective catalytic
activity at each metabolic locus in a diploid will be, in the
simplest case, the sum of the two individual activities. It is
the single effective enzyme activity (v) at each catalytic
locus that concerns us here, irrespective of whether the
cell is haploid, diploid or polyploid.
(6) The catalytic activity (v) at any one metabolic locus
can be left at its current value or changed to and main-
tained at a new value by the experimentalist, e.g. by suita-
ble genetic manipulation of an allele. Each allele in these
circumstances is therefore an internal parameter of the sys-
tem; it is accessible to modification by the direct and sole
intervention of the experimentalist [1].
(7) Because X
0
and X
6
are external to the system in Figure
1, their concentrations can be fixed, and maintained at a
chosen value, by the direct intervention of the experimen-
talist; they are external parameters of the metabolic system.
(8) In contrast to X
0
and X
6
, the concentrations of metab-
olites S
1
to S
5
within the system cannot be fixed and main-
tained at any desired value solely by the direct
intervention of the experimentalist. The concentrations of
S
1
to S
5
are internal variables of the system. (If a fixed
amount of any one of these metabolites were to be
injected through the membrane into the system, contin-
ued metabolism would ensure that the new intracellular
metabolite concentration could not be maintained).
(9) By the same arguments, each reaction rate (v) and the
flux (J) through the system are also variables of the
system.
(10) The magnitude of each variable of the system is
determined at all times by the magnitudes of all the
parameters of the system and of its immediate environ-
ment. The variables comprise the concentrations (s
1
, s
2
, s
3
,
s
4
,s
5
) of the intracellular metabolites shown in Figure 1
and any other intracellular metabolites; the individual
reaction rates v
1
, v
2
, v
3
, v
4
, v
5
, v
6
; and the flux J through this
system of enzyme-catalysed steps.
It follows that, provided we maintain the concentrations
of X
0
and X
6
constant, the system depicted (Figure 1) will,
in time, come to a steady state such that:
v
1
= v
2
= v
3
= v
4
= v
5
= v
6
= J (the flux through this system).
At the same time the concentration of each intracellular
metabolite S
1
to S
5
will settle to an individual steady value.
2.3. The response of the system variables to a change in
any one system parameter
In a metabolic system, the product of any one enzyme-cat-
alysed reaction is the substrate for the immediately
adjacent downstream enzyme (Figure 1). If, for any rea-
son, the concentration of the common intermediate
metabolite of two adjacent enzymes is changed (for
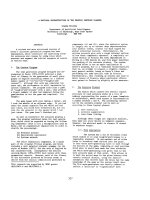
A segment of a model metabolic pathwayFigure 1
A segment of a model metabolic pathway. This diagram
shows those features, discussed in the text, that permit a sys-
temic analysis of the response of any variable of a metabolic
system (e.g. a flux J or the concentration of any intracellular
metabolite S) to changes in any one parameter of the system
(e.g. an enzyme activity). Each S is an intracellular metabolite;
each X is an extracellular metabolite. In a diploid cell, every E
stands for a pair of enzymes (allozymes), each specified by
one of the two alleles at a gene locus. Each E is then a locus
of catalytic activity within a system of enzymes; each v stands
for the individual reaction rates catalysed jointly by a pair of
allozymes in a diploid cell. Either or both allozymes at such a
locus may be mutated.
E
1
E
2
E
3
E
4
E
5
E
6
X
0
S
1
S
2
S
3
S
4
S
5
X
6
(J)
v
1
v
2
v
3
v
4
v
5
v
6
Theoretical Biology and Medical Modelling 2004, 1:6 />Page 4 of 17
(page number not for citation purposes)
example by mutation of one of the two adjacent
enzymes), the concentration of the other adjacent enzyme
will not change but its activity will change in accordance
with the known response of an enzyme activity (at con-
stant enzyme concentration) to a change in the concentra-
tion of its substrate or product. In other words, no matter
how complicated that system may be, the activity of any
one enzyme depends, at all times, on the activity of the
adjacent enzyme; and this is true for every pair of adjacent
enzymes throughout the system (up to the point in the
system where a terminal product is formed).
[This last statement is obviously still true for the system in
Figure 1 if we omit the words in parentheses but only
because the extracellular product X
6
is a terminal product.
X
6
is not an intermediate metabolite, flanked by two adja-
cent enzymes; it is not a substrate that is further metabo-
lised by the system depicted. There are instances where an
intracellular terminal product is formed. We must
therefore add the words in parentheses if the statement is
to apply generally].
A finite change (by mutation) in any one allele at a locus
will change the activity (v) of one enzyme at the corre-
sponding metabolic locus; but, for reasons just stated in
the first paragraph of this section 2.3, the activity (v) of
each of the other enzymes will alter, the flux (J) will
change, and the concentrations of all the metabolites (S
1
-
S
5
) will also change, some more than others, until the sys-
tem settles to a new steady state.
Thus, finite changes in the magnitude of any one of the
internal or external parameters of the system will shift the
original values of all the variables of the system to a new set
of steady-state values. But, providing the external parame-
ters X
0
and X
6
are kept constant, we can be sure that a
change in any one selected internal parameter (an allele or
an enzyme) would be the sole cause of any changes in the
system variables. In short, we are obliged to adopt a
whole-system (a systemic) approach if we want to under-
stand how the flux to a trait component responds to a
change in any one internal or external parameter of the
system, no matter how that change in a parameter value is
brought about. We are here concerned with changes in
any one internal parameter such as a mutation in one or
both alleles of a diploid cell.
Suppose the activity of any one of the enzymes E
1
to E
6
in
Figure 1 were to be changed stepwise (e.g. by a series of
mutations of one or both alleles at a locus in a diploid) so
that the residual activity of the enzyme was decreased in
successive steps to, say, 75%, 60%, 45%, 25%, 0% of its
initial activity. How would the flux (flow) through the
whole series of enzymes vary; i.e. how would the flux (to
a trait component) respond, and how would the concen-
tration of that molecular component of a trait respond,
when any one enzyme activity was changed by mutation
in a series of finite steps?
It was shown, by experiment, that graded changes in the
activity of any one of four different enzymes in the
arginine pathway resulted in a non-linear (quasi-hyper-
bolic) response of the flux to arginine in constructed het-
erokaryons of Neurospora crassa ([3], Figures 1a,1b,1c,1d).
Similar non-linear (non-additive) flux responses were
observed when a series of mutations occurred in a single
enzyme in four other metabolic pathways in four different
diploid or polyploid systems ([3], Figures 1e,1f,1g,1h).
Similar flux responses were observed during genetic
down-modulation of any one of five enzymes involved in
tryptophan synthesis in Saccharomyces cerevisiae [5]. The
same quasi-hyperbolic response of a defined flux to a
series of graded changes in one enzyme activity was
observed in a haploid cell [6]. We can therefore dismiss
the possibility that these non-linear responses (of a flux-
to-a-trait-component) were restricted to the systems inves-
tigated by Kacser and Burns [3] or were in some way
related to the ploidy of the cells and organisms they
studied.
On the contrary, the various flux responses are a funda-
mental biochemical property of the fluxing metabolic sys-
tem. It does not matter how the graded changes in activity
of any one enzyme are brought about. Mutation is one
way but not the only one. Graded replacement of a defec-
tive gene that expressed the chloride translocator in the
cystic fibrosis mouse produced continuously non-additive
responses of various functions associated with chloride
transport, including the duration of the survival of the
mouse [7]. Induced synthesis of graded concentrations of
a single membrane-located enzyme resulted in continu-
ously non-linear changes in growth rate, glucose oxida-
tion, the uptake and phosphorylation of α-methyl glucose
by Escherichia coli cells [8].
Stepwise decreases in cytochrome c oxidase activity (by
titrating rat muscle mitochondria with an enzyme-specific
inhibitor) had little effect on respiration until the enzyme
activity was decreased to about 25% of normal; further
decreases in this one enzyme activity caused a precipitous,
continuously non-linear, decrease in mitochondrial respi-
ration [9]. Other examples of non-linear (non-additive)
responses of a defined flux to a change in activity of one
enzyme in a metabolising system have been recorded
[10], [[11], Figures 6.2,6.3,6.4,6.6.6.7,6.8]. The results of
these various "genetic" and "biochemical" experiments
illustrate the generality of the statement by Kacser and
Burns [3] quoted in section 2.1 of this article.
Theoretical Biology and Medical Modelling 2004, 1:6 />Page 5 of 17
(page number not for citation purposes)
2.4. A rational explanation for the origin of dominant and
recessive traits
How did the observations of non-linear responses of indi-
vidual fluxes to graded changes in any one enzyme activity
lead to a rational explanation for the origin of Mendel's
dominant and recessive trait classes [2]? For reasons
already given, we cannot arrive at the answers to this ques-
tion by relying on the illogical and illegitimate idea that
alleles are themselves dominant or recessive. Such entities
have never existed and do not now exist. Alleles can only
be normal or abnormal (i.e. normal or mutant). If the
ploidy of the cell cannot explain the non-additive
response of a flux to mutations in an allele, it is equally
certain that naming alleles as dominant or recessive will
not provide the explanation [1]. We need to focus atten-
tion on the universally observed non-linear (often quasi-
hyperbolic) responses of the flux-to-a-trait-component
(and the concomitant change in concentration of that
component) when the activity of any one enzyme, within
a metabolic system of enzymes, is changed (decreased or
increased), in stages, by any means available (including
down-modulation by mutation and up-modulation by
increasing the gene dose).
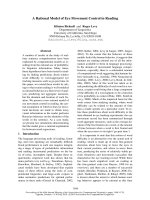
Biochemistry and genetics merged thirty years agoFigure 6
Biochemistry and genetics merged thirty years ago. The symbol indicates the catalysed translocation of an extracellu-
lar substrate or substrates (X
3
) and the subsequent intracellular catalysed transformations, including scavenging pathways, that
form nucleoside triphosphate (NTP) precursors for the transcription process. Similarly, indicates the catalysed
translocation of the extracellular substrates (X
2
) and the subsequent synthesis from (X
2
), and other intracellular substrates, of
the amino acid (AA) precursors for the translation process. The enzymes subsumed as E
Ts
and E
Tl
are involved in the final
stages of the expression (transcription and translation) of genes g1, g2, g3, g4 - - etc as polypeptides (P
1
, P
2
, P
3
, P
4
- - etc). In
diploid cells a pair of proteins will be synthesised from each pair of alleles at a gene locus. Those pairs of polypeptides (pro-
teins) that are catalytically active in a diploid cell are represented by the single symbols E
1
, E
2
, E
3
, E
4
- - - etc in this Figure 6.
Further details are given in Section 5.5.
Theoretical Biology and Medical Modelling 2004, 1:6 />Page 6 of 17
(page number not for citation purposes)
In this Section 2.4, and in Sections 2.5–2.7, consideration
of the role of allele pairs (uu,uU,UU) in determining the
outcome of mutations or changes in gene dose is set aside;
this role will be considered in Section 2.8. For the
moment, attention is focussed on what can be learned
from the non-linear response of a flux – to the molecular
component(s) of a trait – when the activity of one enzyme
in a metabolic system is changed in graded steps by muta-
tion or by changes in gene dose. Figures 1a,1b,1c,1d in
Reference [3] showed that the flux to the normal trait
component (arginine), and thus the concentration of
arginine, was not significantly diminished before any one
of four enzyme activities was decreased by more than
50%. In Figures 1b,1d the enzyme activity was decreased
to about 15% of normal activity in Neurospora crassa
before any significant diminution in the flux to arginine
(and in the concentration of arginine) was detectable [3];
any further diminution of either enzyme activity caused a
continuous but precipitous fall in the production of this
trait component. Similar characteristics were displayed by
a diploid (Figure 1h in Reference [3]). Figure 2 represents
these observations. Flux response plots with these charac-
teristics are quasi-hyperbolic and asymmetric in the sense
that, over low ranges of enzyme activity, the flux (and the
metabolite concentrations in that fluxing pathway)
respond markedly to small increases or decreases in
enzyme activity; on the other hand, over high ranges of
enzyme activity, substantial changes in activity have a
small, if any, effect on the flux to a trait component and
on the concentrations of the molecular components of a
defined trait. A change in any "Flux-to-trait-component"
implies a change in the concentrations of those metabolic
products that typify a defined trait.
It was shown that a dominant trait (A) corresponded to
the normal (100%) activity of the enzyme that was subse-
quently mutated to give lower activities [3]; i.e., the plot-
ting co-ordinate (wild-type enzyme activity versus trait A)
defined the terminus of the asymptote of the flux response
plot depicted in Figure 2. A hybrid (H) must then corre-
spond to any point on the asymptote of Figure 2 that
would not allow us (and would not have allowed Men-
del) to distinguish a F1 hybrid (H) from its parent that dis-
played a dominant trait (A). A recessive (a) must then
correspond to any point on the steeply falling part of the
flux-response plot (Figure 2) that would allow us (or
would have allowed Mendel) to distinguish the dominant
trait (A) and the hybrid (H) from the recessive trait (a),
e.g. dominant trait red flowers and hybrid red flowers
from the recessive trait white flowers [1]. Note especially
that a recessive trait would not necessarily correspond to
zero flux (a complete metabolic block and a complete
absence of the normal, downstream, metabolic products)
in Figure 2.
The paper by Kacser and Burns [3] thus explains, for the
first time in 115 years, how recessive traits arise from a suf-
ficient decrease, by mutation, in one enzyme activity
when that enzyme is embedded in a metabolic system.
The explanation depends on recognising that when
graded changes occur by mutation (in one, both or all of
the allozymes at any one metabolic locus in biochemical
pathways) there will be a non-linear response of the flux
to the molecular component(s) of a defined trait; and
concurrently a non-linear response of the concentrations
of the normal molecular components of a trait (section
2.3).
Section 2.9 in reference [1] showed that it was difficult to
understand how Mendel's recessive traits (a) were dis-
played in 1/4 of his F2 population of plants (A + 2Aa + a)
when these same recessive traits were not displayed in
Mendel's hybrids (Aa). We have replaced Mendel's
implausible idea that his F1 hybrids (Aa) displayed only
trait (A). We have substituted the plausible idea – based
on experimental evidence [3] – that, under certain condi-
tions, the F1 hybrid trait (H) is indistinguishable from trait
(A). In the treatment advocated here, there is no problem
in understanding how 1/4 of the individual plants in the
F2 population of genetically related plants (A + 2H + a)
displayed the recessive trait (a). We can now also see why
Mendel emphasised the need to study crosses between
parental plants that displayed readily distinguishable trait
forms, e.g. red flowers (A) in one parent and white flowers
(a) in the other [1]. Figure 2 shows that this distinction
would be possible only if the activity of one enzyme in the
dominant trait plant was sufficiently diminished in the
recessive trait plant.
Note too that trait dominance and trait recessivity are not
independent phenomena (nor are they opposite, one to
the other). We cannot define a dominant trait except as an
alternative to a recessive trait; both traits must be observ-
able before we can identify either of them. The statements
in these last two sentences were obvious in Mendel's
original paper [2] but they have been inexplicably over-
looked by many later authors.
2.5. Mendel's 3(dominant):1(recessive) trait ratio occurs
sometimes, not always
Does this explanation for the origin of dominant and
recessive traits also account for the occurrence of Mendel's
3(dominant):1(recessive) trait ratio? The answer is yes.
Does it also explain why this ratio is not always observed?
The answer is again, yes (although the original authors [3]
did not pose or answer these two questions).
If the flux response plot is sufficiently asymmetric
(approaches a hyperbolic plot, as in Figure 2), the concen-
tration of molecular components of a defined trait will
Theoretical Biology and Medical Modelling 2004, 1:6 />Page 7 of 17
(page number not for citation purposes)
not be measurably different (when the activity of one
enzyme is decreased by, say, 50%) from the concentra-
tions of those same molecular components when the
enzyme activity was 100%.
If the trait displayed by the hybrid (H) is indistinguishable
from the trait (A), as in Figure 2, the trait distribution in
the F2 population (A + 2H + a) becomes 3(A) + (a); i.e. the
trait ratio in this population will be 3(dominant):1(reces-
sive). This explanation for the occurrence of the 3:1 trait
ratio in Mendel's, or any other F2 population of cells or
organisms, depends entirely on an experimentally
observed, sufficiently asymmetric, response of the flux (to
the molecular components of defined trait) when changes
occur in enzyme activity at any one metabolic locus in a
fluxing biochemical pathway (Figure 1). It does not
depend on the naïve and illegitimate assumption that
alleles are either dominant or recessive (Sections 3.2, 3.3,
4 in Reference [1]).
Figure 2 illustrates one of a family of regularly non-linear
(non-additive) response plots which exhibit various
degrees of asymmetry [3]. Is the flux response always suf-
ficiently asymmetric for the 3:1 trait ratio to be observed?
It is not. A flux response was observed in one particular
(diploid) metabolic system (Reference [3], Figure 1f) that
was still clearly non-linear (non-additive) but not as
asymmetric as that shown in Figure 2. As in Figure 2, so in
Figure 3, a recessive trait (b) can be clearly distinguished
from the dominant trait (B) because the concentrations of
the molecular components of this trait were sufficiently
different when one enzyme activity in the metabolic sys-
tem is decreased to a sufficient extent. The trait displayed
by the hybrid (H) is now distinguishable (rather than indis-
tinguishable) from the dominant trait (B) expressed in a
genetically related normal cell or organism when, as in
Figure 2, the enzyme activity is decreased to an arbitrarily
chosen 50% of the normal activity. The 3(domi-
nant):1(recessive) trait ratio will not then be observed
(Figure 2). A blend of traits (B) and (b) is possible in the
hybrid (H), for example when traits (B) and (b) are distin-
guished by colour differences.
2.6. Dominant and recessive traits are not always observed
It is well known that dominance and recessivity are not
universally observed. Are they therefore of no signifi-
cance? Some authors have been tempted to think so. Their
view is understandable because, before the work of Kacser
and Burns [3], we lacked any credible explanation for the
occurrence of dominant and recessive traits.
Can we now see why dominance and recessivity are not
always observed? The answer is again, yes. Examination of
Figure 2 and Figure 3 shows that it will be possible to
observe dominant and recessive traits in genetically
related organisms only when the enzyme activity at a met-
abolic locus is decreased from 100% to an activity
approaching, but not necessarily reaching, 0% activity.
When the response plot is of the kind shown in Figure 2,
it would be possible to decrease the expressed enzyme
activity at a metabolic locus by at least 75%, perhaps by
85%, without eliciting any detectable change in trait from
that displayed by the wild-type or normal organism. In
other words some mutations will not, apparently, display
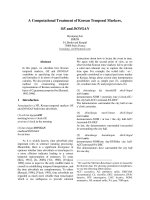
Mendel's 3(dominant):1(recessive) trait ratio does not always occurFigure 3
Mendel's 3(dominant):1(recessive) trait ratio does not always
occur. Mendel's notation for a dominant trait, a hybrid and a
recessive trait were (B), (Bb) and (b) respectively. For rea-
sons given in the preceding paper [1], the hybrid is repre-
sented in Figure 3 by (H). When graded changes are made in
any one enzyme in a metabolic pathway the response of the
flux through that pathway is always non-linear (non-additive)
but not always quasi-hyperbolic (Figure 2). Consequently
when the enzyme activity at one metabolic locus is decreased
in the heterozygote to (say) 50% of wild-type, the trait dis-
played by the hybrid (H) is now distinguishable from the trait
(B) displayed by the wild type cell or organism and from the
trait (b) displayed by the homozygously mutant cell or organ-
ism. Mendel's 3(dominant):1(recessive trait ratio will not be
observed. The explanation is consistent with the explanation
for the observation of the 3:1 trait ratio in Figure 2 and
achieves what the currently favoured explanation of Mendel's
observations cannot achieve [1].
0
50
100
0 50 100
Relative enzyme activity
Flux to trait component
ww wW WW
Allele constitution
Mendel's traits
B
H
b
Theoretical Biology and Medical Modelling 2004, 1:6 />Page 8 of 17
(page number not for citation purposes)
Mendelian dominance and recessivity (dominant and
recessive traits).
Only if the effective enzyme activity is decreased by at
least 95% in this instance (Figure 2), would clear domi-
nance and recessivity be noted. This is an extreme case;
Figure 3 illustrates the other extreme. Between these
extremes, various degrees of asymmetry of flux response
plots may be observed (Figure 1 in Reference [3]). Never-
theless, unless: (i) the change in enzyme activity is meas-
ured, (ii) it is realised that there is a non-additive
relationship between a change in any one enzyme activity
at a metabolic locus and a change in expressed trait, and
(iii) the shape of the flux response plot (Figure 2, Figure
3) is revealed by plotting, it is simply not possible to state
that the system under investigation does or does not dis-
play Mendelian dominance and recessivity. Terms such as
semi-dominance merely indicate that the flux response
plot is not quite asymmetric enough to be sure that a 50%
reduction in enzyme activity produces a trait that is indis-
tinguishable from the dominant trait.
2.7. Is the Kacser & Burns treatment universally
applicable?
The change in the concentrations a normal metabolites has
been treated in the present article as the source of a change
in trait. This accords with the treatment in Figure 1 of ref-
erence [3]. Allowance should, however, be made for the
possibility that the change in concentration of a metabo-
lite is, in reality, a change in the concentration of a
"signalling" metabolite (e.g. an allosteric activator or
inhibitor of another enzyme in the pathway that gener-
ated the "signalling" metabolite, or in another pathway).
Such mechanisms merely shift the cause of the change in
metabolite concentration to another part of the matrix of
intracellular metabolic pathways. In other words, the Kac-
ser and Burns approach remains a valid explanation for
the origin of dominant and recessive traits.
2.8. Accounting for all the plotting points in Figures 2 and 3
In Figure 2, the relative enzyme activities (100, 50, 0)
would be expressed from the series of allele pairs UU, Uu,
uu in a diploid cell (Section 1) only if the mutant allele (u)
was expressed as a catalytically inactive polypeptide. The
same considerations apply to the relative enzyme activi-
ties expressed from the allele pairs WW, Ww, ww in Figure
3.
It is obvious that the continuously non-linear response
plots (Figures 2, 3; and References [3-10]]) could not be
constructed if these three allele pairs were the only ones
available to express a corresponding series of enzyme
activities. Figure 1 in Reference [3] showed that more than
three distinct enzyme activities were observed in experi-
mental practice in any one system. It is easy to see how rel-
ative enzyme activities other than 0, 50, 100 could be
observed in a polyploid or heterokaryon (Figure
1a,1b,1c,1d,1e in Reference [3]). To account for the
occurrence in a diploid of relative enzyme activities in
addition to those taking values of 0, 50, 100 (in Figures 2
and 3, and in Figures 1f,1g,1h of Reference [3]), we need
to allow for allele pairs in addition to the three (UU, Uu,
uu or WW, Ww, ww) in which the mutant alleles (u or w)
express a catalytically inactive polypeptide.
The restriction to just three allele pairs in a diploid may be
traced to Sutton [1]. He wrote Mendel's F2 trait series (A +
2Aa + a), incorrectly, as (AA + 2Aa + aa) and the number
of distinguishable chromosome pairs as (AA + 2Aa + aa),
so establishing a false one-for-one relationship between
pairs of chromosomes (AA or aa) and dominant or reces-
sive traits (AA or aa). Sutton's notation for chromosome
pairs was later transferred to allele pairs. In this article,
dominant and recessive traits are represented, as Mendel
did, by (A) and (a) respectively; alleles have been repre-
sented by different letters (e.g. UU, Uu, uu) in order to dis-
tinguish alleles (parameters) from traits (variables). We
should allow for the situation where (U
†
) is a mutant of
(U) that would express an allozyme activity lower than
that expressed from (U) but not so low as that expressed
from (u); and where (u*) would be a mutant of (U) that
expresses an allozyme activity greater than that expressed
by (u) = 0 in the traditional treatment but not so great as
to merit the notation (U). The outcome of different
hypothetical crosses that involve different mutations of
one both alleles at a given locus in genetically related dip-
loid parents would then be as follows:
(1) Repeated crosses (Uu × Uu) would give, on average,
the allele series (UU + 2Uu + uu) thus permitting expres-
sion of no more than three distinctive enzyme activities at
the corresponding metabolic locus.
(2) The cross (Uu* × Uu) would give the allele series (UU
+ Uu + Uu* + uu*) in which two of the allele pairs differ
from those in the progeny of the first cross; and in which
three different heterozygotes are formed.
(3) The cross (U
†
u × Uu) would give the allele series (UU
†
+ Uu + U
†
u + uu) in which only one allele pair in the prog-
eny populations is identical with one of the allele pairs in
the progeny from the second cross.
(4) The cross (UU
†
× Uu) would give, on average, the allele
series (UU
†
+ UU + Uu + U
†
u) which has only two allele
pairs in common with the progeny of the third of these
crosses of genetically related parents.
(5) The cross (U
†
u × Uu*) would give, on average, the
allele series (UU
†
+ U
†
u* + Uu + uu*).
Theoretical Biology and Medical Modelling 2004, 1:6 />Page 9 of 17
(page number not for citation purposes)
In the second and fourth crosses it was assumed that the
two heterozygous parents did possess exactly the same
normal allele (U) at this particular locus so, among their
progeny, the allele pair (UU) occurred. Analogously,
among the progeny from the third cross, the allele pair
(uu) occurred. But, importantly, in each of crosses (2), (3)
and (4) three different heterozygotes occurred in each
progeny population (a heterozygote is defined in a dip-
loid by the occurrence of allele pairs other than those rep-
resented here by UU or uu). The allele pairs in the
heterozygotes in any one progeny population of these
crosses (2), (3) and (4) are not all identical with those in
the progeny of another of these crosses. The parents in the
fifth cross did not share an identical allele; no two alleles
of a pair are then identical in the progeny. The allele pair
(Uu) occurs in all of the progeny of these five crosses but
only because one of two parents carried this allele pair or
because one parent carried allele (U) and the other carried
allele (u).
Cross (1) typifies events in self-fertilising organisms but is
not typical of sexual reproduction in other organisms (cf
Figure 2 in reference [1]). Male and female parents that are
identically heterozygous at any locus must be rare. Crosses
(2)-(5) between two heterozygous parents will produce,
under the circumstances noted above, truly homozygous
allele pairs (such as UU and uu) but they will also
produce, on average, three different heterozygotes among
their progeny (four heterozygotes in the fifth cross).
The consequences are then as follows: From each locus in
a diploid cell that expresses catalytic polypeptides, alloz-
ymes (pairs of enzymes) will be expressed; one from the
gamete donated by the male parent the other from the
gamete donated by the female parent. For simplicity, it
will be assumed here that the combined allozyme activity
at each catalytic locus in the metabolic pathways of the
cell is the sum of the activities the two allozymes at each
such locus.
The traditional allele series (UU + 2Uu + uu) in a diploid
will then generate the enzyme series (EE + 2Ee + ee) at one
metabolic locus in different, genetically related, individu-
als. This enzyme series provides two extreme combined
allozyme activities, namely 100% (EE) and 0% (ee). There
are no allele pairs at this locus that could provide <0% or
>100% enzyme activity. All other allele pairs, e.g. (UU
†
),
(U
†
u), (U
†
u*), (Uu*), (uu*), would provide combined
allozyme activities that lie between the 100% and 0% val-
ues just described. Only if (u) happens to be a null
mutant, will the heterozyote (Uu) express a single enzyme
activity (v) equal to 50% of the maximum available from
(UU). Only in this circumstance will the allele pair (uu)
express two inactive polypeptides; the enzyme activity will
then be zero at a metabolic locus and a "metabolic block"
will occur at that locus.
Assembling the data from, for example, the second and
third of the three hypothetical crosses between the genet-
ically related parents described above gives an allele series
(UU, UU
†
, U
†
u, Uu, Uu*, uu*, uu). They would contribute
seven different allozyme pairs (EE, EE
†
, E
†
e, Ee, Ee*, ee*,
ee) at one metabolic locus and seven different, single,
enzyme activities (v), one from each pair of allozymes.
Given a range of enzyme activities in excess of the tradi-
tional three, a sufficient number of co-ordinates will be
available to establish a continuously non-additive plot of
the response of one defined flux (J) against changes in
enzyme activity (v) at one metabolic locus in genetically
related cells or organisms (Figures 2, 3). There is no guar-
antee that all of these mutants will be generated in every
case but since (U
†
) and (u*) each represent only one of
several possible mutations of allele (U), we may be rea-
sonably confident of observing traits expressed from allele
pairs in addition to, or instead of, those expressed from
the two traditional mutant pairs (Uu) and (uu). Assem-
bling sets of enzyme activity and flux (or metabolite con-
centration) data from the progeny of different but
genetically related parents then creates the non-linear flux
response plots illustrated in Figures 2 and 3. All plotting
points in the idealised Figures 2 and 3 should be regarded
as tokens for the experimental plots published earlier [3].
This simple explanation for the occurrence of more than
three co-ordinates for a plot of flux response against
changes in enzyme activity (or gene dose) means that it is
no longer acceptable to base arguments and conclusions
on the assumed presence of only one heterozgote (Uu) in
a diploid allele series at a locus, and on only one corre-
sponding hybrid trait. Furthermore, statements that all
heterozygotes express 50% (and only 50%) of the pheno-
type expressed from the homozygous wild-type are based
on the false idea that the mutant allele (u) always pro-
duces a totally inactive enzyme. Figures
1a,1b,1c,1d,1e,1f,1g,1h of Reference [3] depended upon
the availability of 5, 6 or 7 plotting points relating the flux
response to experimentally determined changes in
enzyme activity (effectively to changes in allele constitu-
tion at a locus). In addition to the traditional heterozygote
(Uu), there must be a number of heterozygotes (e.g. UU
†
,
U
†
u, Uu*, uu*), and a corresponding a range of enzyme
activities (v), that account for the response of a flux (J) to
a change in enzyme activity at one metabolic locus (Fig-
ures 1, 2, 3). In Figure 2, some of these additional hetero-
zygotes will establish the asymptote of the flux response
plot. The trait expressed from any such heterozygote
would be indistinguishable from the trait expressed from
the normal allele pair (UU); they could have accounted
for the occurrence of Mendel's hybrids (Aa) which
Theoretical Biology and Medical Modelling 2004, 1:6 />Page 10 of 17
(page number not for citation purposes)
appeared to display only the dominant trait (A). This is
further evidence that the traditional treatment of elemen-
tary Mendelian genetics is inadequate and misleading [1].
3. Quantifiable differences between any two
forms of a trait
Differences in traits are generally and usefully described
by qualitative terms:
hirsute/bald; red flowers/white flowers; lithe/obese; mus-
cular/"skinny"; slow/fleet; albino/black. Such descriptive
terms do, however, disguise the obvious fact these appar-
ently qualitative differences in outward appearance are
based on quantitative differences in the concentrations of
molecular products that contribute to the outward
appearance or function of a cell or organism.
These comments apply to the apparently qualitative dif-
ferences examined by Mendel (Table 1 in reference [1])
and to those traits forms typified by a trait series (A + 2H
+ a) where (A) indicates the dominant trait form, (a) the
recessive trait form and (H) a hybrid trait that may be
indistinguishable (Figure 2) from the dominant traits (A)
or distinguishable (Figure 3) from the dominant trait (B).
It should not therefore be supposed that the paper by Kac-
ser and Burns [3] provided an explanation only for the
occurrence of qualitative differences between any two
traits. On the contrary, a continuously variable response
of each of several defined fluxes was brought about when
mutations of alleles at one locus changed the activity of
one enzyme in a metabolic pathway (or when changes in
gene dose changed the concentration and thus the activity
of one enzyme in a metabolic pathway).
The flux responses were labelled "Flux to arginine", "Flux
to biomass", "Flux to melanin", "Flux to products", "Flux
to DNA repair" (Figure 1 in reference [3]). The molecular
compositions of "arginine", "biomass", "melanin", and
"products" (of ethanol metabolism) were not changed.
Their concentrations were changed as graded mutations at
a gene locus caused graded changes in one enzyme activity
in those pathways that created arginine, biomass, mela-
nin, or the products (of ethanol metabolism). Similarly, a
change in the "flux to DNA repair" was achieved by graded
increases in the dose of the gene specifying the synthesis
of the "repair enzyme" that excises covalently-linked adja-
cent thymines in DNA and allows incorporation of
thymidine in place of the excised pyrimidines. This
"repair enzyme" activity is absent in Xeroderma pigmento-
sum patients.
Additional examples of quantitative changes in the con-
centration of molecular components of a trait will be
found in other publications [5-11]. None of these changes
provide any justification for representing a trait by
twinned letters, e.g. (AA) or (aa). The single letters (A) and
(a) stood for qualitative differences in trait form in Men-
del's work; they stand equally well for quantitative
changes in a trait in modern work. The non-linear
response plots of Kacser and Burns [3] apply to quantita-
tive and to apparently qualitative changes in the pheno-
type that arise from mutations of any one enzyme at a
metabolic locus in a biochemical pathway.
4. Implications of the systemic approach of
Kacser and Burns [3]
Figure 2 shows the response of the phenotype to changes
in enzyme activity at a metabolic locus or to changes in
gene dose at the corresponding gene locus. It follows, if
the response plot takes this form, that increasing the dose
of this particular gene in a wild-type haploid cell (or the
dose of the normal homozygous alleles in a wild-type dip-
loid or polyploid cell) is unlikely to produce a detectable
change in the phenotype (e.g. an increase in the concen-
tration of the trait component produced by a metabolic
pathway; or a change in cell function associated with that
pathway). It was demonstrated that it was necessary,
under these circumstances, to increase concurrently the
gene dose at each of no fewer than five loci if significant
increases in the flux (and in the concentration of meta-
bolic product) was to be achieved [5]. The systemic
approach to a rational explanation of the origins of dom-
inant and recessive traits [3] has obvious implications for
biotechnologists.
Figure 2 (representing several plots in Reference [3]) also
suggests that somatic recessive conditions (in contrast to
so-called dominant conditions) could be ameliorated by
partial gene replacement therapy. Experiments in the
cystic fibrosis mouse model support this suggestion [7];
they show that the systemic approach to the origins of
dominant and recessive traits has implications for medical
genetics.
It was pointed out (section 2.6) that substantial decreases
in the dose of normal alleles at any one locus (or in the
enzyme activity at the corresponding metabolic locus)
may not elicit detectable changes in the trait(s) of the cell.
In other words, given a response plot approximating to
that shown in Figure 2, traits – including associated cell
functions – are inherently buffered against substantial
increases or decreases in the dose of any one gene, or
against substantial changes in enzyme activity at the cor-
responding metabolic locus. This appears to be the prob-
able origin of the so-called "robustness" or buffering of
chemotaxis against changes in enzyme kinetic constants
[12-15].
Theoretical Biology and Medical Modelling 2004, 1:6 />Page 11 of 17
(page number not for citation purposes)
This proposed explanation for metabolic buffering is
quite general; it does not depend on the particular kinetic
mechanisms that have been suggested to account for this
buffering [12]; it also suggests that there is no need to pos-
tulate the presence of diagnostic "biological circuits" as
the source of this buffering of the phenotype against
mutations at a single locus.
Attempts to improve the concentration of metabolic prod-
ucts by increasing the gene dose at one locus above that
available in the wild-type or normal cell could be success-
ful, at least to some self-limiting extent, if a response plot
like Figure 3 applies. Induced synthesis of one membrane-
located enzyme activity to between 20% and 600% of
wild-type activity illustrates the possibility [8]. In this
instance, plots like Figure 3 applied only to changes in the
uptake and phosphorylation of α-methyl glucoside;
changes in growth rates and glucose oxidation gave
response plots like Figure 2. The explanation for the differ-
ence may lie in the suggestion [3] that shorter pathways
will yield response plots like Figure 3, while the longer the
pathway, the more likely is it that markedly asymmetric
plots like Figure 2 will be observed.
5. Expansions of the present treatment
5.1. Why mutating one enzyme in a metabolic pathway
may alter more than one trait; and mutating more than
one enzyme may annul these changes in more than one
trait
If the explanation for the origin of dominant and recessive
traits depends on realising that fluxing metabolic path-
ways generate the molecular components of all traits, and
that mutating any one enzyme in these pathways alters
the flux and the concentrations of those normal metabolic
products that are molecular components of a trait, other
genetic phenomena could perhaps also be explained.
Only two of the thirteen texts surveyed [1] gave a defini-
tion, in their glossaries, of pleiotropy and epistasis. Both
agreed that pleiotropy was a phenomenon where a change
at one gene locus brought about a change in more than
one trait. Both attributed epistasis to an interaction
between genes or their alleles. Neither of these descrip-
tions of pleiotropy and epistasis is particularly revealing.
The following account, like those preceding it, does not
depend on the fiction that all mutations generate inactive
enzymes. Figure 1 is elaborated as shown in Figure 4. One
pathway, like that shown in Figure 1, is now coupled to
another analogous pathway by the conserved metabolite
pair (p, q). The sum of the concentrations of (p) and (q) is
constant (is conserved) but the ratio of the two concentra-
tions (p/q) is a free variable. All the characteristics of the
metabolic system in Figure 1 (Section 2), apply to each of
the two fluxing pathways in Figure 4. Claims in the bio-
chemical literature in the past that changes in the ratio (p/
q) controlled metabolic fluxes were and remain untena-
ble; one variable of a system cannot be said to control
another variable of the system.
Figure 1 may also be elaborated as shown in Figure 5. An
input flux from X
1
to S
4
divides into two output fluxes
[16]. Of the input flux, a proportion (α) enters one of the
two output fluxes (J
a
) and a proportion (1-α) enters the
other output flux (J
b
). The magnitude of (α) is determined
by the magnitudes of the activities of all the enzymes of
the metabolic system; (α) is a systemic characteristic [17].
Again, all the characteristics of the model metabolic sys-
tem in Figure 1 (Section 2), apply to each of the two path-
ways that generate fluxes J
a
and J
b
shown in Figure 5.
5.2. The origin of pleiotropy explained
It will be obvious that a mutation of any one enzyme in
either of the two pathways of Figure 4 will cause changes
in the fluxes through both of the coupled pathways (and
the concentrations of metabolites in both pathways). Sim-
ilarly, a mutation in any one enzyme of the input flux of
Figure 5 will affect the concentrations of metabolites in
both output fluxes J
a
and J
b
. Pleiotropy (a change in more
than one trait as a consequence of a single mutation),
when it is detected, is thus seen to depend on mutating an
enzyme within a metabolic pathway, on the consequen-
tial changes in metabolite concentrations, and on the
structure and interdependence of biochemical pathways.
Only if one of the enzymes in the input pathway shows
zero activity will both output fluxes (J
a
and J
b
) cease (Fig-
ure 5).
5.3. The origin of epistasis explained
Given a steady input flux from X
1
to S
4
(Figure 5), a muta-
tion of one of the enzymes (E
5a
, E
6a
or any other enzyme
Accounting for the occurrence of pleiotropyFigure 4
Accounting for the occurrence of pleiotropy. One
unbranched pathway is coupled to another by a conserved
metabolite pair p and q. Such coupling is not uncommon in
cellular systems and is one source of pleiotropy. Mutation of
any one enzyme in one pathway will affect both fluxes (J
a
and
J
b
) to a trait component and the concentrations of those trait
components. See also Figure 5. Figure 4, like Figure 1, illus-
trates the need to adopt a systemic approach in attempts to
understand the responses of a metabolising system to
changes in any enzyme activity brought about by mutation.
S
1a
S
2a
S
3a
S
4a
(J
a
)
p q
(J
b
) S
4b
S
3b
S
2b
S
1b
Theoretical Biology and Medical Modelling 2004, 1:6 />Page 12 of 17
(page number not for citation purposes)
in this output limb) would decrease flux J
a
and increase
flux J
b
. The concentrations of metabolites in pathway J
a
would decrease and those in pathway J
b
would increase, a
further example of a pleiotropic response to a single muta-
tion. But suppose that, following the mutation of E
5a
, a
mutation occurred in E
6b
or any other enzyme in this alter-
native output limb. Clearly, the effect of the first mutation
on the cell characteristics would be at least partly nullified
by the second mutation – a phenomenon known as
epistasis and sometimes attributed in genetic texts to an
interaction between genes but shown here to depend on
mutations of one or more enzymes, and on the structure
and interdependence of metabolic pathways. Only if the
activity of one of the enzymes in one of the two output
pathways is diminished to zero by mutation, will the
products of that output limb downstream from the muta-
tion be lost.
If the fluxes proceeded in the opposite direction to that
shown in Figure 5 (so that two pathways merged into
one), mutation of an enzyme in one of the input fluxes
followed by a mutation of an enzyme in the other input
pathway could again elicit epistatic responses in the
system.
5.4. Are pleiotropy and epistasis always detectable?
Particular but common metabolic structures (Figures 4, 5)
provide the potential for pleiotropy and epistasis; i.e.
changes in concentrations of normal metabolites when an
enzyme is mutated within a metabolic pathway. Whether
pleiotropy or epistasis is detected, or not, will depend on
the severity of the mutation and on the nature of the flux
response plots (Figures 2, 3) as demonstrated in section 2.
5.5. Biochemistry and genetics are not separable topics
Beadle and Tatum [18] isolated a series of mutants of Neu-
rospora crassa and tested their ability to grow on basal
medium or on basal medium supplemented with differ-
ent metabolites or cofactors. Wild-type Neurospora crassa
grew on basal medium. Different isolated mutants would
grow only if the basal medium was supplemented with
the specific product of an enzyme rendered partially or
fully inactive in one of the mutants. These brilliant
observations led to the paradigm "one gene, one func-
tion" [19,20], later to "one gene, one enzyme". These
observations [18] made explicit what was implied by the
observations of Garrod [21-24]] on inborn errors of
metabolism namely: metabolism is catalysed by a
sequence (or system) of different enzymes; and a suffi-
cient decrease (by mutation) in the activity of any one
enzyme may cause a change in the trait(s) or characteris-
tic(s) of the system (e.g. the ability to grow, to accumulate
cell mass [18]).
Beadle [20] expressed surprise that Garrod's work had
received so little attention. He wrote: "It is a fact both of
interest and historical importance that for many years
Garrod's book had little influence on genetics. It was
widely known and cited by biochemists, and many genet-
icists in the first two decades of the century knew of it and
the cases so beautifully described in it. Yet in the standard
textbooks written in the twenties and thirties - - - - few
mention its cases or even give a reference to it. I have often
wondered why this was so. I suppose most geneticists
were not yet inclined to think of hereditary traits in chem-
ical terms. Certainly, biochemists with a few notable
exceptions such as the Onslows, Gortner and Haldane
were not keenly aware of the intimate way in which genes
direct the reactions of living systems that were the subject
of their science."
This lack of attention to the implications of Garrod's work
is all the more surprising when it is recalled that Bateson
[[25], p.133] pointed out that alkaptonuria (a change in
concentration of the normal metabolite, homogentisic
acid, and one of Garrod's inborn errors of metabolism)
was an example of a Mendelian recessive trait or character;
see also [[26], p.19]. In other words, some important
aspects of genetics depended on recognising the role of
changes in an enzyme activity, within a metabolic system,
in effecting a change in a trait.
The aphorism "one gene, one enzyme" was refined to
"one allele, one polypeptide" after the elucidation of the
Accounting for the occurrence of pleiotropy and epistasisFigure 5
Accounting for the occurrence of pleiotropy and epistasis.
Mutation of any one of enzymes E
2
, E
3
, E
4
would affect both
fluxes J
a
and J
b
to separate trait components. Mutation of any
one of enzymes E
5a
, E
6a
, etc would decrease flux J
a
to a trait
component but increase J
b
to another trait component; the
concentrations of trait components in pathway J
a
would
decrease, those in pathway J
b
would increase. Epistasis would
occur if a subsequent mutation occurred in any one of
enzymes E
5b
, E
6b
etc. A branched metabolic pathway is thus a
potential source of pleiotropy and epistasis; see the text for
further discussion. This diagram, like that in Figure 4, empha-
sises the importance of adopting a systemic approach in
understanding the potential effect, on a trait or traits, of a
mutation in any one enzyme in enzyme-catalysed systems.
v
6a
S
5a
S
6a
(J
a
)
v
5a
E
6a
v
2
v
3
v
4
E
5a
X
1
S
2
S
3
S
4
E
2
E
3
E
4
v
5b
E
5b
v
6b
S
5b
S
6b
(J
b
)
E
6b
Theoretical Biology and Medical Modelling 2004, 1:6 />Page 13 of 17
(page number not for citation purposes)
structure of DNA [27,28] and the rapid advances made in
the next 10 or 15 years in elucidating the mechanisms of
expression of diploid alleles as pairs of polypeptides or
proteins [29-32]] most of which are enzymes [3,4]. These
more recent discoveries (Figure 6) emphasise what was
implied by the work of Beadle and Tatum [18]: the
molecular components of dominant and recessive traits or
characteristics, in all biological forms, are generated by
fluxing metabolic pathways catalysed by sequences or sys-
tems of enzymes. Dominant and recessive traits are not
the direct product of the expression of alleles as suggested
by the currently favoured explanation of Mendel's obser-
vations (Figure 2 in Reference [1]); they are produced indi-
rectly by a system of enzymes (Figures 1, 4, 5, 6).
Figure 6 depicts the direct relationship between any one
gene (g1, g2, g3, g4) and the synthesis of individual
polypeptides (P
1
, P
2
, P
3
, P
4
) most of which, but not all, are
enzymes (E
1
, E
2
, E
3
, E
4
). All polypeptides, catalytic and
non-catalytic, are synthesised in this way.
X
1
, X
2
and X
3
in Figure 6 are immediately identified as
extracellular parameters of a cell system. X
3
stands for
those substrates that lead, through a series of enzyme-cat-
alysed reactions, to the synthesis of nucleoside
triphosphates (NTPs) and their subsequent incorporation
into mRNA. Note that mRNA is a terminal product of this
pathway. It is a coding entity, a proxy for DNA. Each
mRNA specifies the order of incorporation of individual
amino acids into a polypeptide, but no individual mRNA
molecule participates as a substrate in the subsequent
steps of the catalysed formation of a polypeptide. The
control of the overall expression of a gene as a polypeptide
is therefore necessarily treated in Metabolic Control Anal-
ysis as a cascade of two fluxing metabolic pathways, one
that starts at X
3
, the other that starts at X
2
[33].
X
2
stands for those extracellular substrates that lead,
through a series of enzyme-catalysed reactions, to the syn-
thesis de novo of amino acids (AAs) and their subsequent
incorporation, along with any existing amino acids, into a
polypeptide (P). In a haploid cell, one polypeptide is syn-
thesised from each gene locus. In a diploid, one polypep-
tide is synthesised from each of two alleles at a gene locus.
If these pairs of polypeptides are catalytically active, each
enzyme in a diploid cell (E
1
, E
2
, E
3
, etc) consists of a pair
of allozymes, one of each pair specified by the allele
derived from the male parent, the other specified by allele
derived from the female parent. Each pair of allozymes,
whether normal or mutated, exhibits only one measura-
ble activity (v) at a catalytic locus in a metabolic pathway.
If the pairs of polypeptides (P) synthesised by a diploid
cell are not catalytically active they will not, of course, play
a direct role in catalysing a metabolic pathway. They may
have other important functions (e.g. as hormones) and
may be components of traits.
X
1
stands for all those initial extracellular substrates feed-
ing the matrix of inter-dependent biochemical pathways
that typify all functioning cells. It is these pathways that
generate the non-protein, non-polyribonucleotide,
molecular products of all cell traits.
Each of these three major fluxing pathways (Figure 6) is
catalysed by a succession of enzyme-catalysed reactions as
shown in Figure 1. The flux through any one of these path-
ways will respond to a mutation of any one enzyme in the
pathway as shown in Figures 2, 3; any change in these
fluxes could change the concentrations of the intermedi-
ate metabolites or the final product (section 2.3); but,
provided mutations do not alter the specificity of an
enzyme, they will not change the existing molecular struc-
ture or composition of these metabolites.
Most attention is concentrated on the pathway initiated
by X
1
for the simple reason that this pathway stands for all
the matrix of interdependent biochemical fluxes that gen-
erate such a wide range of the non-protein (and non-
polyribonucleotide) molecular components of cell traits
(e.g. skin pigments, membrane lipids, chlorophyll, xan-
thocyanins, non-peptide hormones, neural transmitters,
chitin, serum cholesterol, peptidoglycans, etc, etc).
If any one of the three major pathways shown in Figure 6
is coupled to another pathway (Figure 4) or contains a
branch (Figure 5) there will be, potentially detectable,
pleiotropic and epistatic responses to mutations of any of
the pathway enzymes (section 5.3). Such pathway
coupling and branching is a common feature of the path-
ways that start with one of the extracellular substrates typ-
ified by X
1
.
If the implications of the work of Beadle and Tatum [18]
were not fully realised at the time, Figure 6 might have
suggested that a fresh approach to an understanding of the
origins of dominant and recessive traits was needed. The
currently favoured explanation for Mendel's findings ([1],
Figure 2) does not take account of the biochemical path-
ways of the synthesis of enzymes (Figure 6) established
30–40 years ago, does not acknowledge that the molecu-
lar components of all traits are synthesised by systems of
enzymes, does not take account of the change in concen-
tration of molecular components of traits when any one
enzyme is mutated, and fails to distinguish the system
parameters (alleles) from the system variables (traits).
Note that changes in the concentrations of external
metabolites (whether they are substrates like X
1
, X
2
, X
3
in
Figure 6, or extracellular inhibitors or activators of intrac-
Theoretical Biology and Medical Modelling 2004, 1:6 />Page 14 of 17
(page number not for citation purposes)
ellular enzymes) may effect changes in intracellular
metabolism and consequently modify the effects of a
mutation. This topic is not immediately relevant in the
present article but is a notable feature of Metabolic Con-
trol Analysis. Descriptions of the role of the Combined
Response Coefficient (R) in permitting extracellular
effectors to modulate intracellular metabolism (and thus
the effects of a mutation) will be found elsewhere [11,34-
36].
If pleiotropic and epistatic responses to a mutation are as
common as is suggested (sections 5.1–5.4), the question
then arises: how do we account for Mendelian segregation
of traits during sexual reproduction? The answer lies in the
fact that a mutation at a biochemical locus, within the
matrix of interdependent pathways, has its most obvious
effect on the most closely associated pathways. Distant
pathways (on the scale of cellular dimensions) will be less
obviously affected. Kacser and Burns (Reference [3],
p.649) pointed out that "This apparent independence of
most characters makes simple Mendelian genetics possi-
ble, but conceals the fact that there is universal pleiotropy.
All characters should be viewed as 'quantitative' since, in
principle, variation anywhere in the genome affects every
character." Section 3 in the present article emphasised the
importance of quantitative changes in cell traits. The con-
siderations in this paragraph are germane to the apparent
absence of a detectable change of phenotype in some so-
called 'knock-out' experiments.
6. Conditions that must be met to explain
dominance and recessivity
The explanation advocated in this article for the origins of
dominant and recessive traits from normal and mutant
alleles in a diploid is based on:
(i) An obligatory distinction, by notation and nomencla-
ture, between the variables (traits) and the parameters
(alleles and enzymes) of genetic/biochemical systems.
(ii) The contention that the molecular components of all
traits are the products of fluxing metabolic systems (Fig-
ures 1, 4, 5, 6).
(iii) Experimental evidence for an inevitable non-linear
response of a flux (through a metabolic system of
enzymes) to graded changes in the activity of any one of
those enzymes [3], evidence that is supported by a
number of independent observations [5-11].
(iv) A demonstration that dominant and recessive traits
arise from changes in the concentration of the normal
molecular components of a defined trait.
(v) The argument that changes in concentration of a trait
component may nevertheless be revealed as a qualitative
change in that trait.
(vi) A demonstration that both alleles (normal or mutant)
at a locus in a diploid are generally expressed. If the nor-
mal allele expresses a catalytically active polypeptide,
many mutants of this allele will express an enzyme with
lower activity; a mutated enzyme with zero activity is an
extreme case.
(vii) The demonstration that an explanation of Mendel's
observations cannot be based on an allele series contain-
ing only three terms (e.g. uu, 2uU, UU) one of which is a
unique heterozygote (uU).
(viii) A demonstration that dominant and recessive traits
cannot be generated by those polypeptides that are not
enzymes embedded in a system of enzymes.
(ix) Rejection of the unjustified traditional claim that a
hybrid (H) expresses a dominant trait (A) because the
(allegedly) recessive allele (u) in a heterozygote (Uu) is
always completely ineffective or because the allegedly
dominant allele (U) suppresses the allegedly recessive
allele (u) in the heterozygote [1].
(x) Rejection of the traditional, unsubstantiated and
implausible claim that one so-called dominant allele in a
heterozygote is as effective as two such alleles in the wild-
type cell [1].
It was also shown that pleiotropy and epistasis can be
explained by taking a similar system approach to that used
in explaining the origin of dominant and recessive traits.
It is then apparent that, to account rationally for Mendel's
observations of dominant and recessive traits, a minimum
of four conditions must be met.
(i) Alleles must be distinguished by notation, nomencla-
ture and concept from traits; functions of components of
the genotype must be distinguished from properties of
components of the phenotype. Traits alone may be dom-
inant or recessive.
(ii) Alleles cannot be called "dominant" or "recessive".
(When alleles are so called, the flaws present in the current
attempts to explain Mendel's observations will inevitably
re-appear [1]).
(iii) It must be shown how dominant traits become distin-
guishable from recessive traits in the same cell or organ-
ism (Figure 2, 3).
Theoretical Biology and Medical Modelling 2004, 1:6 />Page 15 of 17
(page number not for citation purposes)
(iv) It must be shown how a hybrid trait sometimes
becomes indistinguishable from the dominant trait and
sometimes does not (Figures 2, 3). The first circumstance
will account for Mendel's 3(dominant):1(recessive) trait
ratio; the second for exceptions to this ratio.
If all four conditions are be met; the first two conditions
must first be met. The treatment given in sections 2–5
meets each of these requirements.
7. Conclusions
Kacser and Burns [3] provided the basis for a rational
explanation for the origin of dominant and recessive traits
that arose from mutations of alleles at any one gene locus
in a diploid or polyploid cell (sections 2.3, 2.4). Inherent
in this explanation, as set out above (sections 2.5, 2.6), are
further explanations for the occurrence of the 3(domi-
nant):1(recessive) trait ratio in some situations in a dip-
loid (Figure 2), for the absence of this trait ratio from
other situations (Figure 3), for the absence of dominant
and recessive traits in yet others and for the appearance of
a blend of parental traits in some heterozygotes. These five
demonstrations are internally consistent. In contrast to
the currently favoured attempt to explain Mendel's results
[1], no arbitrary assumptions are introduced (section 2.8)
to explain how heterozygous allele pairs (e.g. UU
†
, U
†
u,
Uu*, uu*) may produce a trait that is indistinguishable
from the trait expressed from the "homozygous" allele
pairs (UU).
In other words, provided:
(a) all current misrepresentations of Mendel's paper [1]
are first discarded,
(b) alleles are distinguished by notation and nomencla-
ture from the traits they specify,
(c) alleles are regarded as normal or mutant (but not
dominant or recessive), it is possible to provide a rational
and internally consistent explanation for the origin of
Mendel's dominant and recessive traits, for the occurrence
of his 3:1 trait ratio, and for exceptions to these observa-
tions noted by later investigators. The same systemic
approach is applicable to current problems in biotechnol-
ogy and medical genetics (section 4). It also explains the
origins of pleiotropy and epistasis (section 5); and chal-
lenges the assumption that a mutation in a non-catalytic
protein provides an example of Mendel's dominant and
recessive traits [1].
Mendel found, by experiment, that the proportions of
plant forms in each of his F2 populations was represented
by (A + 2Aa + a). In the present paper these proportions
have been written as (A + 2H + a). If the symbol (H) for a
hybrid in Figure 2 is replaced mentally and temporarily by
(Aa), it will be clear why Mendel postulated that his
hybrids (Aa) displayed trait (A) and not trait (a). If the
same exercise is repeated in Figure 3 by replacing (H) tem-
porarily by (Bb), it will be clear why Mendel observed an
anomalous blending of flower colours in the hybrids
when he crossed parental bean plants bearing different
flower colours.
The treatment of elementary Mendelian genetics advo-
cated here is based on the work of Kacser and Burns [3].
So far as the present author is aware, that paper has not
been described by any student textbook of "classical" or
"molecular" genetics published in the intervening 23
years. Orr [37] did not see the full significance of the Kac-
ser and Burns paper [3]. Darden [[38], p. 72] declared that
"(trying) to unravel the complex relations between
mutant alleles and enzymes (Kacser and Burns, 1981) - - -
is not a major research topic in genetics."
Several possible reasons for this failure to see the merits of
the Kacser and Burns paper [3] may be worth considera-
tion. They include:
(1) Persistent misrepresentations of Mendel's paper, and
incorporation of these distortions into currently favoured
explanations of Mendel's observations [1].
(2) A failure to recognise the consequences of not distin-
guishing between the function of the alleles and the prop-
erties of traits in attempting to explain Mendel's results.
Normal and mutant alleles specify the kind (and order of
incorporation) of amino acids into polypeptides (most
but not all are enzymes). Dominance and recessivity are a
reflection of changes in the concentration(s) of the molec-
ular component(s) of a trait when an enzyme is mutated
within a fluxing metabolic pathway.
(3) Tardy recognition of the need to adopt the systemic
approach of Metabolic Control Analysis in explaining the
response of the variables of a biological system to pertur-
bations of the magnitude any one system parameter.
(4) A reluctance to accept a change in concepts even when
currently accepted representations of Mendel's results are
demonstrably untenable.
(5) Elucidation of the double helical structure of DNA
(Figure 6) and all that followed in the next 10–15 years
imposed profound changes on genetics but was not per-
haps always taken into account.
(6) A determination in some quarters to regard genetics as
an autonomous subject. It has been obvious at least since
the work of Beadle and Tatum [18] that such claims can-
Theoretical Biology and Medical Modelling 2004, 1:6 />Page 16 of 17
(page number not for citation purposes)
not be sustained. Genetics is intimately related to, and in
some respects dependent upon, biochemistry. The
converse is equally true. Genetics and biochemistry are
not separable topics in biology.
It is significant that Kacser & Burns were also one of two
sets of authors who initiated the systemic approach to the
control of metabolite concentrations and fluxes [39,40].
This approach was elaborated by the original authors and
many others. For some accounts and reviews, see
[11,36,41-44].
8. A correction
In an earlier paper [45] it was stated that Mendel had
inferred the presence of segregating particles. These partic-
ulate determinants were then represented by (A) and (a).
These statements are here formally withdrawn. They were
consistent with textbook treatments of Mendelian genet-
ics [1] but a subsequent reading of Mendel's original
paper revealed that these statements, and others that
occur frequently in the recent reviews of Mendel's paper
and in current textbooks, were incorrect and misleading.
A history of the misunderstandings and misrepresenta-
tions that have sustained the currently favoured depiction
of Mendelian genetics [1] will be presented elsewhere. A
paper setting out the concepts of parameters and variables
will also be submitted.
Acknowledgements
I thank Dr Colin Pearson for his support during the preparation of this and
the preceding paper, Dr Denys Wheatley for temporary accommodation
during a logistic exercise and Dr Paul Agutter for valuable suggested mod-
ifications to the drafts of these two papers.
References
1. Porteous JW: We still fail to account for Mendel's
observations. Theor Biol Med Modelling 2004 in press.
2. Mendel G: Versuche über Pflanzen-Hybriden. Verhandlungen des
Naturforschenden Vereines in Brunn 1866, 4(Abhandlungen):3-47.
3. Kacser H, Burns JA: The Molecular Basis of Dominance. Genetics
1981, 97:639-666.
4. Nirenberg MW: The Genetic Code II. Sci Amer 1963,
208(3):80-94.
5. Niederberger P, Prasad R, Miozzari G, Kacser H: A strategy for
increasing an in vivo flux by genetic manipulations. The tryp-
tophan system of yeast. Biochem J 1992, 287:473-479.
6. Dean AM, Dykhuisen DE, Hartl DL: Fitness as a function of β-
galactosidase activity in Escherichia coli. Genet Res 1986, 48:1-8.
7. Dorin JR, Farley R, Webb S, Smith SN, Farini E, Delaney SJ, Wain-
wright BJ, Alton EWFW, Porteous DJ: A demonstration using
mouse models that successful gene therapy for cystic fibrosis
requires only partial gene correction. Gene Therapy 1996,
3:797-801.
8. Ruyter GJG, Postma PW, van Dam K: Control of glucose metab-
olism by EnzymeII
Glc
of the phosphoenolpyruvate-depend-
ent phosphotransferase system in Escherichia coli. J Bact 1991,
173(19):6184-6191.
9. Letellier T, Heinrich R, Malgat M, Mazat J-P: The kinetic basis of
threshhold effects observed in mitochondrial diseases: a sys-
temic approach. Biochem J 1994, 302:171-174.
10. Small JR, Kacser H: Responses of metabolic systems to large
changes in enzyme activities and effectors. 1. The linear
treatment of unbranched chains. Eur J Biochem 1993,
213:613-624.
11. Fell DA: Understanding the Control of Metabolism London and Miami:
Portland Press; 1997.
12. Barkai N, Leibler S: Robustness in simple biochemical
networks. Nature 1997, 387:913-917.
13. Hartwell L: A robust view of biochemical pathways. Nature
1997, 387:855-857.
14. Cohen P: Weathering the storm. New Scientist 2000 Online Confer-
ence Reports 6:.
15. Ferber D: The spice of life. NewScientist Online Conference Report
2000.
16. Kacser H: The control of enzyme systems in vivo: elasticity
analysis of the steady state. Biochem Soc Trans 1983, 11:35-40.
17. Fell DA, Sauro JM: Metabolic control analysis. Additional rela-
tionships between elasticities and control coefficients. Eur J
Biochem 1985, 148:555-561.
18. Beadle GW, Tatum EL: Genetic control of biochemical reac-
tions in Neurospora. Proc Natl Acad Sci USA 1941, 27:499-506.
19. Beadle GW: Genetics and metabolism in Neurospora. Physiol
Rev 1945, 25:643-663.
20. Beadle GW: Chemical genetics. In: Genetics in the 20th Century
Edited by: Dunn LC. The Macmillan Company, New York; 1951.
21. Garrod AE: About Alkaptonuria. Lancet 1901, ii:1484-1486.
22. Garrod AE: The incidence of Alkaptonuria. Lancet 1902,
ii:1616-1620.
23. Garrod AE: Croonian Lectures to the Royal Society of Physi-
cians: Inborn Errors of Metabolism. Lancet 1908, ii:1-7. 1432–
145; 173–179; 214–220
24. Garrod AE: Inborn Errors of Metabolism (a revision of the
Croonian Lectures, 1909). . reprinted in reference [26]
25. Bateson W: Report of the Evolution Committee of the Royal Society 1902,
1(III):125-160.
26. Harris H: Garrod's Inborn Errors of Metabolism Oxford: University
Press; 1963.
27. Watson JD, Crick FHC: Molecular structure of the nucleic
acids. A structure for deoxyribonucleic acid. Nature 1953,
171:737-738.
28. Watson JD, Crick FHC: Genetical implications of the structure
of deoxyribonucleic acid. Nature 1953, 171:964-967.
29. Crick FHC: On protein synthesis. Symp Soc Exp Biol 1958,
12:138-163.
30. Crick FHC: The Genetic Code III. Sci Amer 1966, 215(4):55-62.
31. Taylor JH: Molecular Genetics II New York and London: Academic
Press; 1967.
32. Yanofsky C: Gene Structure and Protein Structure. Sci Amer
1967, 216(5):80-94.
33. Westerhoff HV, Koster JG, van Workum M, Rudd KE: On the con-
trol of gene expression. In: Control of Metabolic Processes Edited by:
Cornish-Bowden A, Cárdenas ML. New York. Plenum Press;
1990:399-412.
34. Kacser H, Porteous JW: Control of Metabolism: What do we
have to measure? Trends Biochem Sci 1987, 12:5-14.
35. Porteous JW: A theory that works. In: Control of Metabolic Processes
Edited by: Cornish-Bowden A, Cárdenas ML. New York: Plenum
Press; 1990:51-67.
36. Cornish-Bowden A: Fundamentals of enzyme kinetics London: Portland
Press; 1995.
37. Orr HA: A test of Fisher's theory of dominance. Proc Natl Acad
Sci USA 1991, 88:11413-11415.
38. Darden L: Theory change in science Oxford and New York: Oxford
University Press; 1991.
39. Heinrich R, Rapoport TA: Linear theory of enzymatic chains; its
application for the analysis of the cross-over theorem and
the glycolysis of human erythrocytes. Acta Biol Med Germanica
1973, 341:479-494.
40. Kacser H, Burns JA: The control of flux. Symp Soc Exp Biol 1973,
27:65-104.
41. Fell DA: Metabolic Control Analysis: a survey of its theoreti-
cal and experimental development. Biochem J 1992,
286:313-330.
42. Kell DB, Westerhoff HV: Metabolic control theory; its role in
microbiology and biotechnology. FEMS Microbiol Rev 1986,
39:305-320.
43. Teusink B, Baganz F, Westerhoff HV, Oliver SG: Metabolic Control
Analysis as a tool in the elucidation of novel genes. Methods
Microbiol 1998, 26:298-336.
Publish with BioMed Central and every
scientist can read your work free of charge
"BioMed Central will be the most significant development for
disseminating the results of biomedical researc h in our lifetime."
Sir Paul Nurse, Cancer Research UK
Your research papers will be:
available free of charge to the entire biomedical community
peer reviewed and published immediately upon acceptance
cited in PubMed and archived on PubMed Central
yours — you keep the copyright
Submit your manuscript here:
/>BioMedcentral
Theoretical Biology and Medical Modelling 2004, 1:6 />Page 17 of 17
(page number not for citation purposes)
44. Wildermuth MC: Metabolic control analysis: biological applica-
tions and insights. Genome Biology 2000, 1(6):1031.1-1031.5.
45. Porteous JW: Dominance – One hundred and fifteen years
after Mendel's paper. J Theor Biol 1996, 182:223-232.