Báo cáo y học: " Single cell studies of the cell cycle and some models" pps
Bạn đang xem bản rút gọn của tài liệu. Xem và tải ngay bản đầy đủ của tài liệu tại đây (505.74 KB, 5 trang )
BioMed Central
Page 1 of 5
(page number not for citation purposes)
Theoretical Biology and Medical
Modelling
Open Access
Research
Single cell studies of the cell cycle and some models
JM Mitchison*
Address: Institute for Cell, Animal and Population Biology, University of Edinburgh, Edinburgh EH9 3JT, UK
Email: JM Mitchison* -
* Corresponding author
Abstract
Analysis of growth and division often involves measurements made on cell populations, which tend
to average data. The value of single cell analysis needs to be appreciated, and models based on
findings from single cells should be taken into greater consideration in our understanding of the
way in which cell size and division are co-ordinated. Examples are given of some single cell analyses
in mammalian cells, yeast and other microorganisms. There is also a short discussion on how far
the results are in accord with simple models.
Introduction
What is the point of single cell studies of the cell cycle?
The simple answer is that they provide extra information
that is not available from studies of cell populations.
Without them a cell biologist can be misled.
It is easiest for me to start with the theme of the extensive
results on single cells of the fission yeast Schizosaccharomy-
ces pombe with which I have worked since the mid-1950s.
It was then a fairly obscure organism for physiological
studies though it had a good genetic background found by
U. Leupold in Bern [1]. Since then it has flourished and
quite large international meetings are now devoted
entirely to it. For those unfamiliar with it, it is like a
scaled-up bacterial rod with division at a medial septum,
unlike budding yeasts.
One the early results on its growth came from a single cell
study by Bayne-Jones and Adolph [2]. Here I need to make
a small digression about references. They will be given in
this article but there are much longer accounts of nearly
all the topics in my recent 100-page review [3]. When I
took up fission yeast in the mid-fifties, I used a new micro-
scopic technique, which gave by optical interferometry
the total dry mass of single growing cells as well as their
volume [4]. Volume increased, approximately in an expo-
nential curve, through the first three quarters of the cycle
but then stayed constant for the last quarter between
mitosis and division. But total dry mass increased approx-
imately linearly through the whole cycle. This was the first
demonstration of linear growth, and I was surprised.
Early synchrony techniques by induction
This period of the fifties was when attention in this field
was largely focused on the successful synchronisation of
Tetrahymena and Chlorella by periodic changes in their
environment. Good synchronous cultures would mean
that powerful biochemical techniques, often enzyme
activity assays at that time, could be applied in a cell cycle
context. In the next 15 years, induction synchrony was
somewhat improved but the cell cycles were always and
inevitably distorted. Methods were also developed to
select out a fraction of an asynchronous culture in one
stage of the cycle and grow it up separately (for example,"
membrane elution", where cells growing on a membrane
come away at division). They produce less distortion but
a much lower yield than induction.
Published: 09 February 2005
Theoretical Biology and Medical Modelling 2005, 2:4 doi:10.1186/1742-4682-2-4
Received: 14 January 2005
Accepted: 09 February 2005
This article is available from: />© 2005 Mitchison; licensee BioMed Central Ltd.
This is an Open Access article distributed under the terms of the Creative Commons Attribution License ( />),
which permits unrestricted use, distribution, and reproduction in any medium, provided the original work is properly cited.
Theoretical Biology and Medical Modelling 2005, 2:4 />Page 2 of 5
(page number not for citation purposes)
Because of what can be measured in synchronous cul-
tures, they are the natural choice for the molecular biolo-
gist. But it is as well to remember their limitations. The
distortions after induction have been mentioned, but
even with selection synchrony there are problems. The
main one is that they are, in practice, not all that synchro-
nous. The selected cells come from more than a very nar-
row region of the cycle. Some of the variation can be
reduced by a correction for asynchrony [5] but there is still
cell-to-cell variation in cycle stage and this can obscure the
fine detail of the cycle. Single cell measurements may help
here.
Single cell analysis in yeast
Returning to single cell analyses of fission yeast, volume
growth was followed in finer detail by Mitchison and
Nurse [6]. One part of this analysis, on films taken previ-
ously by Fantes [7], showed that increase in volume was
not a simple exponential during the growth phase in the
first three quarters of the cycle but rather two linear seg-
ments with a rate change point (RCP) between them. The
position of the RCP showed a large cell-to-cell variation.
An important moral here is that these two linear segments
vanished into an apparent exponential increase in a "well
synchronised" culture made by selection. Such a culture
scarcely showed the plateau in growth during the last
quarter of the cycle. This distinction between single cells
and synchronous cultures does of course depend on the
frequency and accuracy of the data points. If the points
have too much scatter, the fine detail of the single cell lin-
ear patterns is lost. There is also a second RCP at the end
of the cycle.
A much more detailed analysis of populations of single
cells followed on films was made by Sveiczer et al. [8] on
fission yeast. A plot of extension growth against birth size
has a strong negative slope. So also does a plot of cycle
time against birth size. This has important implications
for the definitions of "size control", discussed in that
paper.
Problems of single cell analysis
Single cell studies have their problems. We have been
lucky in using yeasts that are not apparently affected by
growing on warm agar pads under a coverslip. They show
"balanced growth", a property in which there is no change
in extensive properties between successive cycles [9] and
that should always be checked. Useful deductions can
often be made with unbalanced growth but it will be a dis-
tortion of the normal cycle.
The cells also have to keep still or be followed, a problem
discussed below. We have not found ways of sticking yeast
to glass (e.g. with lectins) that permit "normal" growth.
Cells may also need a continuous supply of fresh
medium, probably for oxygenation. Various types of
microscopic mounting chambers have been described in
the last 50 years or so, e.g. [10], but few seem to have been
stringently tested.
Many experimental studies on cell growth kinetics can be
tedious; single cell studies are no exception. Here, how-
ever, modern automation is beginning to have very prom-
ising prospects. Anyone who has spent a day on a yeast
film re-focusing the microscope every 5 min will welcome
auto-focusing devices that are now available. Analysis has
also become much easier with electronic imaging fol-
lowed by image analysis programmes, and perhaps pres-
entation on spreadsheets. It is now possible to have a
programme that requires some hand work in the initial
setting up under the microscope but will then run auto-
matically, measuring cell length and diameter. This has
been done for fifty or more single cells of fission yeast – a
long way from the early days of using a ruler to measure
the length of yeast cells on projected film images. Another
point that should be raised here is that the new technol-
ogy could profitably be applied to the growth of
Escherichia coli. The limitations of synchronous cultures in
hiding the fine detail of increases in volume or area could
well mean that single cell studies might reveal more than
an exponential increase. There might even be something
like the two linear patterns that were popular models in
earlier work with this bacterium [11].
What to measure
Volume and area of a rod-shaped organism are two of the
parameters that can be measured in single growing cells.
So is dry mass by interferometry. But there others, of
which one of the most interesting is the use of the Carte-
sian diver, which was originally developed some fifty
years ago at the Carlsberg Laboratory in Copenhagen. It
requires technical skills and very tightly controlled tem-
perature in water baths, but it is exquisitely sensitive. It
can be used in at least two ways. One is as a diver balance,
which measures "reduced weight" or weight in water. Pro-
viding there are not major changes in chemical composi-
tion, this is proportional to total dry mass. It was used on
single cells of Amoeba proteus in an important classic paper
by Prescott [12] mentioned below. It can also be used
with minute divers as a respirometer. Hamburger [13]
measured oxygen uptake in Acanthamoeba and CO
2
pro-
duction in fission yeast (Hamburger et al. [14]), in both
cases over several cell cycles starting with single cells – a
remarkable achievement. In both cases, the results were
elegant linear patterns with an RCP at division.
Another interesting single cell method was the colorimet-
ric enzyme assay of single yeast cells in microdrops [15].
This might have been developed with promise, but was
Theoretical Biology and Medical Modelling 2005, 2:4 />Page 3 of 5
(page number not for citation purposes)
not followed up, partly perhaps because the results dif-
fered from similar assays in synchronous cultures.
One of the advantages of single cell work with yeasts is
that they stay still on an agar pad so they can be followed
for a couple of cycles before overlapping spoils the image.
This is not true of many mammalian cells, which move
around on the substrate. One solution to this problem
comes in the work on fibroblasts (mouse L cells)
described in Zetterberg [16], Killander and Zetterberg
[17], Zetterberg and Killander, [16]. These are part of an
impressive body of work initiated using optical machinery
gathered by Trigvar Caspersson, along with a great deal of
skill and hard work. In one set of experiments on single
cells [17], they made a measurement of the dry mass of
single cells by interferometry and then placed it in the
cycle by following it as it moved about until it divided.
The difference in timing between the measurement and
cell division gave the timing in the cycle. A second set of
experiments used frequency analysis to set the cycle
stages. This is a method widely used to determine G1, S
and G2 in flow cytometry but is less suitable for the slow
and imprecise doublings in something like dry mass. I
therefore regard the single cell analyses as more reliable
and they are not the same as those from the second
method.
What are needed now are techniques that combine the
subtlety and precision of single cell measurements with
the new techniques of automation. A promising start was
made by Zicha and Dunn [19], and the development is
being actively pursued elsewhere.
Organisms which tend to be forgotten about these days
are those lower eukaryotes that make poor material for
molecular biologists because of inadequate genetic back-
grounds. One important set of results are those from the
early pioneer work of Prescott [12] on Amoeba proteus
mentioned above. The results showed that the increase of
single cell "dry mass" fell in a reverse exponential, with a
rapid increase at the start of the cycle falling to zero
towards the end. This, of course, is lethal for anyone who
believes that a rising exponential is the paradigm for the
cell cycle.
Tetrahymena pyriformis has a long and distinguished his-
tory in the cell cycle with its early induction synchrony.
But in the 1960s there was a burst of studies on selected
single cells or small groups. The growth patterns were
often not well defined but it seems that absolute measure-
ments of volume and of respiration rate were a better fit to
linear growth (Prescott, [20]). Such analyses might now
be checked using some of the semi-automated procedures
referred to above.
Growth in syncytia
Physarum polycephalum is a myxomycete of considerable
importance in some earlier work on cell cycle control. It is
effectively a big single multinucleate cell with complete
natural synchrony in nuclear division. It does not show
exponential increase in macromolecular synthesis. For
instance, there are two peaks in the rate of protein synthe-
sis, one in the S period and the other in G2 (Mittermayer
et al, [21]).
General conclusion
It would appear that there are no universal patterns of
growth in these lower eukaryotes.
Models
My title makes mention of "some models". Let me be clear
that there are two quite different types of cell cycle mod-
els. One type includes detailed mathematical and molec-
ular models dealing with discrete periodic events like
mitosis (e.g. [22]). These are complex and can illustrate
the relations between many components of a network at
the event, on reasonable assumptions. They are important
aids in understanding the events and are a fairly recent
development in the cell cycle world. There are certain lim-
itations at present. With mitosis, the models have prob-
lems with the starting event (a size control?), with
location in cellular compartments, and with the final
mechanical events. However, such models will certainly
develop.
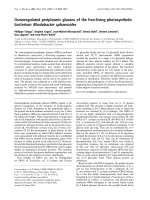
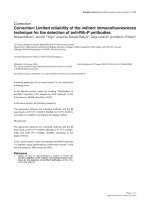
Modes of growth in cell length of wild-type and wee1 mutant cells of fhe fission yeast Schizosaccharomyces pombe, after Sweiczer et alFigure 1
Modes of growth in cell length of wild-type and wee1 mutant
cells of fhe fission yeast Schizosaccharomyces pombe, after
Sweiczer et al. (1996)
Theoretical Biology and Medical Modelling 2005, 2:4 />Page 4 of 5
(page number not for citation purposes)
However, what I am concerned with here are much earlier
and much simpler models, not of periodic events in the
cycle like DNA synthesis, but of continuous growth. Here
the two dominant models were, for simplicity, an expo-
nential pattern of increase and a linear one. My own view
[3] of the earlier experiments is that, on the whole, they
favour linear increase but it was also clear that some pat-
terns, e.g. volume in fission yeast, are more complex. Lin-
ear increases with rate change points have certainly
survived in fission yeast where there are no exponential
increases (Table 1 in [3]) and this has revived for me an
old hypothesis of "gene dosage". What, for instance, hap-
pens to synthesis rates between G1 and G2? But one thing
is clear – that a single unifying dream of exponential syn-
thesis is not in accord with the facts. It is really useless to
wave Occam's Razor around. The end of his razor blade is
"without necessity". In all reasonable judgements, the
necessity is there. Beyond that is prejudice.
References
1. Munz P, Wolf K, Kohli J, Leupold U: Genetics Overview. In Molec-
ular Biology of the Fission Yeast Edited by: Nasim A, Young P, Johnson
BF. San Diego: Academic Press; 1989:1-30.
2. Bayne-Jones S, Adolph EF: Growth in size of micro-organisms
measured from motion pictures. J Cell Comp Physiol 1932,
1:387-407.
3. Mitchison JM: Growth during the cell cycle. Int Rev Cytol 2003,
222:165-258.
4. Mitchison JM: The growth of single cells. 1. Schizosaccharomy-
ces pombe. Exp Cell Res 1957, 13:244-262.
5. Creanor J, Mitchison JM: The kinetics of H1 histone activation
during the cell cycle of wild type and wee mutants of the fis-
sion yeast Schizosaccharomyces pombe. J Cell Sci 1994,
107:1197-1204.
6. Mitchison JM, Nurse P: Growth in cell length in the fission yeast
Schizosaccharomyces pombe. J Cell Sci 1985, 75:357-376.
7. Fantes PA: Control of cell size and cycle time in Schizosaccha-
romyces pombe. J Cell Sci 1977, 24:51-67.
8. Sveiczer A, Novak B, Mitchison JM: The size control of fission
yeast revisited. J Cell Sci 1996, 109:2947-2957.
9. Campbell A: Synchronization of cell division. Bacteriol Rev 1957,
21:263-272.
10. Harris NK, Powell EO: A culture chamber for the microscopi-
cal study of living bacteria, with some observations on the
spore-bearing aerobes. J R Microsc Soc 1951, 71:407-420.
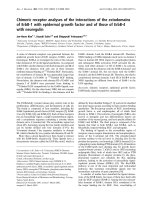
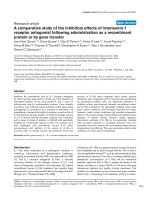
Growth through one cycle of individual Amoeba, after Prescott (1976)Figure 2
Growth through one cycle of individual Amoeba, after Prescott (1976)
Publish with Bio Med Central and every
scientist can read your work free of charge
"BioMed Central will be the most significant development for
disseminating the results of biomedical research in our lifetime."
Sir Paul Nurse, Cancer Research UK
Your research papers will be:
available free of charge to the entire biomedical community
peer reviewed and published immediately upon acceptance
cited in PubMed and archived on PubMed Central
yours — you keep the copyright
Submit your manuscript here:
/>BioMedcentral
Theoretical Biology and Medical Modelling 2005, 2:4 />Page 5 of 5
(page number not for citation purposes)
11. Ward CB, Glaser DA: Correlation between rate of cell growth
and rate of DNA synthesis in Escherichia coli B/r . Proc Natl Acad
Sci USA 1971, 68:1061-1064.
12. Prescott DM: Relations between cell growth and cell division.
1. Reduced weight, cell volume, protein content and nuclear
volume of Amoeba proteus from division to division. Exp Cell
Res 1955, 9:328-337.
13. Hamburger K: Respiratory rate through the growth-division
cycle of Acanthamoeba Sp. C R Trav Lab Carlsberg 1975,
40:175-185.
14. Hamburger K, Kramhaft B, Nissen SB, Zeuthen E: Linear increases
in glycolytic activity through the cell cycle of Schizosaccharo-
myces pombe. J Cell Sci 1977, 24:69-79.
15. Yashpe J, Halvorson HO: β-D-galactosidase activity in single
yeast cells during the cell cycle of Saccharomyces lactis. Science
1976, 191:1283-1284.
16. Zetterberg A: Nuclear and cytoplasmic growth during
interphase. Almqvist Wicksells Boktrykeri AB, Uppsala (Sweden) 1966.
17. Killander D, Zetterberg A: Quantitative cytochemical studies
on interphase growth. I. Determination of DNA, RNA and
mass content of age determined mouse fibroblasts in vitro
and of intercellular variation in generation time. Exp Cell Res
1965, 38:272-284.
18. Zetterberg A, Killander D: Quntitative cytochemical studies on
interphase growth. II. Derivation of synthesis curves from
the distribution of DNA, RNA and mass values of individual
mouse fibroblasts in vitro. Exp Cell Res 1965, 39:22-32.
19. Zicha D, Dunn GA: An image processing system for cell behav-
iour studies in subconfluent cultures. J Microscop 1995,
179:11-21.
20. Prescott DM: Reproduction of eukaryotic cells. Academic Press,
New York; 1976.
21. Mittermayer C, Chayka TG, Braun R, Rusch HP: Polysome pat-
terns and protein synthesis during the mitotic cycle of
Physarum polycephalum. Nature 1966, 210:1133-1137.
22. Chen KC, Csikasz-Nagy A, Gyorffy B, Val J, Novak B, Tyson JJ:
Kinetic analysis of a molecular model of the budding yeast
cell cycle. Mol Biol Cell 2000, 11:369-391.