Báo cáo y học: "Dynamic simulation of red blood cell metabolism and its application to the analysis of a pathological condition" docx
Bạn đang xem bản rút gọn của tài liệu. Xem và tải ngay bản đầy đủ của tài liệu tại đây (1.29 MB, 11 trang )
BioMed Central
Page 1 of 11
(page number not for citation purposes)
Theoretical Biology and Medical
Modelling
Open Access
Research
Dynamic simulation of red blood cell metabolism and its application
to the analysis of a pathological condition
Yoichi Nakayama, Ayako Kinoshita and Masaru Tomita*
Address: Institute for Advanced Biosciences, Keio University, Tsuruoka, 997-0017, Japan
Email: Yoichi Nakayama - ; Ayako Kinoshita - ; Masaru Tomita* -
* Corresponding author
kineticsmetabolism
Abstract
Background: Cell simulation, which aims to predict the complex and dynamic behavior of living
cells, is becoming a valuable tool. In silico models of human red blood cell (RBC) metabolism have
been developed by several laboratories. An RBC model using the E-Cell simulation system has been
developed. This prototype model consists of three major metabolic pathways, namely, the
glycolytic pathway, the pentose phosphate pathway and the nucleotide metabolic pathway. Like the
previous model by Joshi and Palsson, it also models physical effects such as osmotic balance. This
model was used here to reconstruct the pathology arising from hereditary glucose-6-phosphate
dehydrogenase (G6PD) deficiency, which is the most common deficiency in human RBC.
Results: Since the prototype model could not reproduce the state of G6PD deficiency, the model
was modified to include a pathway for de novo glutathione synthesis and a glutathione disulfide
(GSSG) export system. The de novo glutathione (GSH) synthesis pathway was found to compensate
partially for the lowered GSH concentrations resulting from G6PD deficiency, with the result that
GSSG could be maintained at a very low concentration due to the active export system.
Conclusion: The results of the simulation were consistent with the estimated situation of real
G6PD-deficient cells. These results suggest that the de novo glutathione synthesis pathway and the
GSSG export system play an important role in alleviating the consequences of G6PD deficiency.
Introduction
Many attempts have been made to simulate molecular
processes in cellular systems. Perhaps the most active area
of cellular simulation is the kinetics of metabolic path-
ways. Various software packages that quantitatively simu-
late cellular processes and are based on numerical
integration of rate equations have been developed. These
include GEPASI [1], which calculates steady states as well
as reaction time behavior; V-Cell [2], a solver of non-lin-
ear PDE/ODE/Algebraic systems that can represent the
cellular geometry; and DBsolve [3], which combines con-
tinuation and bifurcation analysis.
The E-Cell project [4,5], which aims to model and simu-
late various cellular systems, was launched in 1996 at Keio
University. The first version of the E-Cell simulation sys-
tem, a generic software package for cell modeling, was
completed in 2001. E-Cell version2, which is a Windows
Published: 09 May 2005
Theoretical Biology and Medical Modelling 2005, 2:18 doi:10.1186/1742-4682-2-18
Received: 19 November 2004
Accepted: 09 May 2005
This article is available from: />© 2005 Nakayama et al; licensee BioMed Central Ltd.
This is an Open Access article distributed under the terms of the Creative Commons Attribution License ( />),
which permits unrestricted use, distribution, and reproduction in any medium, provided the original work is properly cited.
Theoretical Biology and Medical Modelling 2005, 2:18 />Page 2 of 11
(page number not for citation purposes)
version of the first E-Cell system, is now also available [6].
E-Cell version 3, which enables multi-algorithm simula-
tion, is the latest version [7]. The E-Cell system allows the
user to define spatially discrete compartments such as
membranes, chromosomes and the cytoplasm. The collec-
tions of molecules in all cellular compartments are repre-
sented as numbers of molecules, which can be converted
to concentrations, and these can be monitored and/or
manipulated by employing the various graphical user
interfaces. In addition, the E-Cell system enables the user
to model not only deterministic metabolic pathways but
also other higher-order cellular processes, including sto-
chastic processes such as gene expression, within the same
framework. By using the E-Cell system, a virtual cell with
127 genes that are sufficient for "self-support" [4] was
developed. This gene set was selected from information
about Mycoplasma genitalium genomic sequences and
includes genes for transcription, translation, the glycolysis
pathway for energy production, membrane transport, and
the phospholipid biosynthesis pathway for membrane
production.
On the basis of existing models of single pathways and
enzymes, various in silico models of human red blood cell
(RBC) metabolism were first developed by Joshi and Pals-
son [8-11]. Subsequently, other groups developed RBC
models [12-15]. The RBC is thought to be a good target for
biosimulation because extensive studies over the last three
decades have generated extensive biochemical data on its
enzymes and metabolites. Moreover, the RBCs of many
species, including humans, do not contain a nucleus or
carry genes. This means that gene expression can be
excluded from the model, which greatly simplifies the
biosimulation. RBCs take up glucose from the plasma and
process it by glycolysis, which generates the ATP mole-
cules that are used in other cellular metabolic processes.
The ATP molecules are mostly consumed by the ion trans-
port systems that maintain the osmotic balance of the cell.
Here we describe our computer model of the human RBC,
which we developed on the basis of previous models [8-
13]. Our prototype model of the human RBC consisted
only of glycolysis, the pentose phosphate pathway, nucle-
otide metabolism and simple membrane transport sys-
tems such as the Na
+
/K
+
antiport channel. Here, we have
employed this prototype model to reproduce the patho-
logical condition of glucose-6-phosphate dehydrogenase
(G6PD) deficiency. This is the most common hereditary
enzyme deficiency in RBCs; it causes anemia, and more
than 400 varieties of G6PD deficiency have been identi-
fied [16]. The deficiency is known to exert only mild
effects as it does not cause clinically significant problems
in most cases, except upon exposure to medications and
foods that cause hemolysis. Computer simulations for
analyzing this deficiency have been reported [17-19], but
these simulation models consisted only of glycolysis and
the pentose phosphate pathway. We found that including
the glutathione (GSH) biosynthesis pathway and the glu-
tathione disulfide (GSSG) export system, which are
involved in suppressing oxidative stress, improved the
ability of the model to reflect the real diseased RBC. This
suggests that these pathways may compensate for the con-
sequences of G6PD deficiency in human RBCs.
Methods
Development of the prototype model and simulation
experiments
The E-Cell system version 1.1 was used as the simulation
platform in this work. The software can be downloaded
from />. Our prototype model of the
RBC was developed on the basis of the whole-cell model
of Joshi and Palsson [8-11] with slight modifications (Fig-
ure 1). We modified the model to represent the oxidant-
induced decrease of hexokinase and pyruvate kinase, and
the maximum activity of these enzymes was allowed to
change according to the ratio of GSH and GSSG. The
equations and parameters used are derived from the liter-
ature [17]. The parameters and kinetic equations in the
original model of Joshi and Palsson were replaced with
those obtained from the literature [17,20,21] (Table 1) in
order to fit the model to the measured concentrations dur-
ing the calculation of the steady state. The steady state
obtained had concentrations of many metabolites that
were very close to those in real RBCs (Table 2). However,
the concentrations of several metabolites, namely adeno-
sine, hypoxanthine, inosine, 5-phosphoribosyl 1-phos-
phate and ribose 1-phosphate, differed from the
experimental values. These differences were due to the
kinetic parameters and equations used, and because the
nucleotide metabolism in the original model was repre-
sented as simple first-order kinetics or equilibrium.
The parameters from the work of Jacobasch et al. [30] were
used in the experiments simulating G6PD deficiency
(Table 3). Since the rate equation of G6PD deficiency is
the same as that in the normal cell, the parameters were
simply replaced in the deficiency experiment. We adopted
the We.G variant of G6PD deficiency because its parame-
ters are well described in the literature and its phenotype
is rather severe. As with the original model, the oxidative
load is represented as the conversion of GSH to GSSG, and
the equation is expressed as a simple first-order kinetics.
Expansion of the prototype model and simulation
experiments
The de novo GSH synthesis and GSSG export pathways
(Figure 3) were added to the prototype model. The kinetic
equations and parameters of these pathways were
obtained from the literature [31-33] (Table 4). Since these
pathways have very low activity in normal cells, the
Theoretical Biology and Medical Modelling 2005, 2:18 />Page 3 of 11
(page number not for citation purposes)
concentrations of metabolites at the steady state were
almost unchanged in the expanded model. The concentra-
tions listed in Table 2 were used as the steady state concen-
trations. The conditions employed to simulate G6PD
deficiency using this expanded model were the same as
those of the prototype model. It is known that multidrug
resistance-associated proteins (MRP1) and the cystic
fibrosis transmembrane conductance regulator (CFTR)
are expressed in human RBC and involved in GSH and/or
GSH conjugates transport [35]. However, their rate equa-
tions and parameters are unavailable, so these proteins
were not included in this model.
Results and Discussion
Simulation of G6PD deficiency using the prototype model
The prototype model was used to simulate the effects of
G6PD deficiency. G6PD is a key enzyme in the pentose
phosphate pathway that converts glucose 6-phosphate
into gluconolactone 6-phosphate (GL6P); this simultane-
ously generates NADPH. The metabolic intermediate
GL6P is then metabolized into ribulose 5-phosphate
(Ru5P) acid via gluconate 6-phosphate (GO6P). This
process also generates NADPH. This reduction power is
employed by various other intracellular processes, in par-
ticular the reduction of GSSG. A major function of GSH in
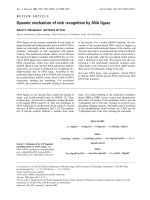
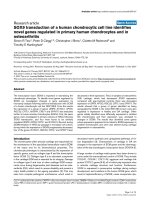
Metabolic map of the prototype RBC modelFigure 1
Metabolic map of the prototype RBC model. The circles are metabolic intermediates and ions. These molecular species
are defined as "Substance" in the E-Cell system. The boxes are enzymes and reaction processes. Their rate expressions are
defined as "Reactor" whereas the enzyme molecules are defined as "Substance".
Theoretical Biology and Medical Modelling 2005, 2:18 />Page 4 of 11
(page number not for citation purposes)
the RBC is to eliminate superoxide anions and organic
hydroperoxides. Peroxides are eliminated through the
action of glutathione peroxidase, which yields GSSG.
The simulation experiments were carried out with steady
state concentrations corresponding to those in the normal
RBC. Sequential changes in the quantities of NADPH,
GSH and ATP were observed (Figure 2). There is a negative
peak in ATP concentration before 10 h. This was due to
the shutting down of the pentose phosphate pathway. The
Ru5P produced was mainly converted to fructose 6-phos-
phate (F6P), and this metabolite consumed ATP to make
fructose 1,6-diphosphate (FDP). The FDP production led
to an accumulation of dihydroxy acetone phosphate
(DHAP), and the metabolite was not used to provide ATP.
The high GO6P concentration could sustain normal levels
of GSH concentration at the first stage of the simulation,
but after the depletion of GO6P the rate of Ru5P produc-
tion was drastically reduced. This decrease in Ru5P con-
centration led to decreased F6P concentrations.
Table 1: Enzymes and rate equations of the prototype model
Enzymes Abbreviation Group Reaction mechanism Reference
Glutathione turnover GSHox PPP Chemical reaction 24
Glutathione reductase (NADPH) GSSGR PPP Ordered Bi Ter mechanism 24
Glutathione reductase (NADH) GSSGR2 PPP Michaelis Menten mechanism 24
Glucose 6-phosphate dehydrogenase G6PD PPP Ordered Bi Bi mechanism 17
6-Phosphogluconolactonase 6PGLase PPP Michaelis Menten mechanism 17
6-Phosphogluconate dehydrogenase 6PGLDH PPP Ordered Bi Ter mechanism 24
Ribose 5-phosphate isomerase R5PI PPP Uni Uni mechanism 25
Xylulose 5-phosphate isomerase X5PI PPP Uni Uni mechanism 25
Transketolase I TK1 PPP Ping-Pong Bi Bi mechanism 25
Transketolase II TK2 PPP Ping-Pong Bi Bi mechanism 25
Transaldolase TA PPP Ping-Pong Bi Bi mechanism 25
Hexokinase HK Glycolysis 26
Phosphoglucoisomerase PGI Glycolysis Uni Uni mechanism 25
Phosphofructokinase PFK Glycolysis 27
Aldolase ALD Glycolysis Ordered Uni Bi mechanism 25
Triose phosphate isomerase TPI Glycolysis Uni Uni mechanism 25
Glyceraldehyde phosphate dehydrogenase GAPDH Glycolysis Chemical reaction 20
Phosphoglycerate kinase PGK Glycolysis Chemical reaction 20
Diphosphoglycerate mutase DPGM Glycolysis Michaelis Menten mechanism 20
Diphosphoglycerate phosphatase DPGase Glycolysis Michaelis Menten mechanism 20
Phosphoglyceromutase PGM Glycolysis Chemical reaction 20
Enolase EN Glycolysis Chemical reaction 20
Pyruvate kinase PK Glycolysis 28
Pyruvate transport process PYRtr Transport Michaelis Menten mechanism 22
Lactate dehydrogenase LDH Glycolysis Chemical reaction 20
Lactate transport process LACtr Transport Michaelis Menten mechanism 22
Leak of Potassium K_Leak Transport 9
Leak of Sodium Na_Leak Transport 9
Sodium/potassium pump Pump Transport 9
Adenosine transport process ADEtr Transport Chemical reaction 13
AMP phosphohydrolase AMPase NM Chemical reaction 20
Adenosine deaminase ADA NM Michaelis Menten mechanism 20
Adenosine kinase AK NM Michaelis Menten mechanism 20
Adenylate kinase APK NM Chemical reaction 20
Adenosine triphosphate phosphohydrolase ATPase NM Chemical reaction 8
Adenosine monophosphate deaminase AMPDA NM Michaelis Menten mechanism 20
Inosine monophosphatase IMPase NM Michaelis Menten mechanism 8
Purine nucleotide phosphorylase PNPase NM Chemical reaction 23
Phosphoribosyl pyrophosphate synthetase PRPPsyn NM 8
Adenine phosphoribosyl transferase ADPRT NM Michaelis Menten mechanism 8
Hypoxanthine-guanine phosphoryl transferase HGPRT NM Michaelis Menten mechanism 8
Hypoxanthine transport process HXtr NM 29
PPP, Pentose phosphate pathway; NM, Nucleotide metabolism.
Theoretical Biology and Medical Modelling 2005, 2:18 />Page 5 of 11
(page number not for citation purposes)
Table 2: Steady state of the RBC model.
Concentration (mM)
Metabolic intermediate Abbreviation Steady state
b
Literature
c
1,3-Diphosphoglycerate 13DPG 1.83E-04 4.00E-04
2-Phosphoglycerate 2PG 4.16E-03 1.40E-02 ± 5.00E-03
3-Phosphoglycerate 3PG 4.62E-02 4.50E-02
Adenosine ADO 8.93E-06 1.20E-03 ± 3.00E-04
Dihydroxy acetone phosphate DHAP 1.35E-01 1.40E-01 ± 8.00E-02
Erythrose 4-phosphate E4P 1.17E+00 -
Fructose 6-phosphate F6P 6.39E-02 1.60E-02 ± 3.00E-03
Fructose 1,6-diphosphate FDP 1.14E-02 7.60E-03 ± 4.00E-03
Glucose 6-phosphate G6P 1.96E-01 3.80E-02 ± 1.20E-02
Glyceraldehyde 3-phosphate GA3P 6.24E-03 6.70E-03 ± 1.00E-03
Gluconolactone 6-phosphate GL6P 7.62E-06 -
Gluconate 6-phosphate GO6P 2.72E+00 -
Glutathione GSH 3.21E+00 3.21E+00 ± 1.50E+00
Glutathione GSSG 1.03E-04 -
Hypoxanthine HXi 9.32E-06 2.00E-03
Inosine monophosphate IMP 5.03E-03 1.00E-02
Inosine INO 3.32E-08 1.00E-03
Potassium Ki 1.26E+02 1.35E+02 ± 1.00E+01
Lactate LACi 1.20E+00 1.10E+00 ± 5.00E-01
Nicotinamide adenine dinucleotide NAD 8.87E-02
d
-
Nicotinamide adenine dinucleotide NADH 3.13E-04
d
-
Nicotinamide adenine phosphate NADP 8.06E-05
d
-
Nicotinamide adenine phosphate NADPH 6.58E-02
d
6.58E-02
Sodium Nai 2.27E+01 1.00E+01 ± 6.00E+00
Phosphoenolpyruvate PEP 1.89E-02 1.70E-02 ± 2.00E-03
5-Phosphoribosyl 1-phosphate PRPP 6.91E-05 5.00E-03 ± 1.00E-03
Pyruvate PYRi 6.00E-02 7.70E-02 ± 5.00E-02
Inorganic phosphate Pi 1.30E-01 1.00E+00
Ribose 1-phosphate R1P 2.12E-05 6.00E-02
Ribose 5-phosphate R5P 2.81E-04 -
Ribulose 5-phosphate RU5P 1.48E-04 -
Sedoheptulose 7-phosphate S7P 7.49E-02 -
Xylulose 5-phosphate X5P 4.30E-04 -
2,3-Diphosphoglycerate 2,3-DPG 4.21E+00 4.50E+00 ± 5.00E-01
Adenosine diphosphate ADP 2.20E-01 2.70E-01 ± 1.20E-01
Adenosine monophosphate AMP 2.42E-02 8.00E-02 ± 9.00E-03
Adenosine triphosphate ATP 1.57E+00 1.54E-00 ± 2.50E-01
The values are given in scientific notation; E-01 denotes multiplication by 10
-1
.
a
The initial data set was from experimental data in the literature and from predictions of previous simulation models [12].
b
The simulation was run for more than 1,000,000 seconds in simulation time until the model reached steady state.
c
Biochemical experimental data taken from the literature and reported in Joshi and Palsson [11].
d
NAD(H) and NADP(H) pools are kept constant.
Table 3: Parameters for normal and deficient enzymes
t/2 (day) Vmax (mkat/l cells) KmG6P KmNADP (mM) KiNADPH KiATP Ki2,3DPG
Normal 27 575 67 3.7 3.1 749 2289
We.G. 2.5 10 152 3.8 0.62 180 520
These values are based on experimental data taken from the literature [10]
Theoretical Biology and Medical Modelling 2005, 2:18 />Page 6 of 11
(page number not for citation purposes)
At around 20 h, ATP was rapidly consumed and depleted.
Since ATP concentrations less than half the normal con-
centration have never been observed in enzyme deficien-
cies [36], cells in this condition will probably be
destroyed. Although the half-life of the real G6PD-defi-
cient We.G type RBC is known to be 2.5 days [30], the lon-
gevity of our computer model turned out to be much
shorter (Table 3). Since data on the concentration of
metabolites in RBCs with G6PD deficiency are not availa-
ble, it was not possible to determine whether the metabo-
lite concentrations arising in our simulation experiments
reflected those observed in real cells.
Simulation of G6PD deficiency using the expanded model
It is obvious that decreased pentose phosphate pathway
activity leads to faster cell death, and that the difference
between the simulated cell and the real cell regarding the
timing of cell death could be caused by the lack of a path-
way producing GSH. This pathway may compensate for
the decrease in GSH. A mature RBC normally contains 2
mM GSH but contains only several
µ
M GSSG. Although
GSSG reductase plays a prominent role in maintaining a
stable GSH/GSSG ratio, other processes, including de novo
GSH synthesis and GSSG export pathways, may generate
GSH in the G6PD-deficient cell.
After the expansion of the prototype model to include de
novo GSH synthesis and GSSG export, the ATP levels were
maintained at 80% of normal and the cell was longer
lived (Figure 4). In addition, the GSH/GSSG ratio was
higher (Figure 5). This indicates that the de novo GSH syn-
thesis pathway can partially compensate for the lowered
GSH concentrations resulting from G6PD deficiency, and
that the concentration of GSSG can be kept at a very low
level due to the active export system. These observations
suggest that these reactions could alleviate the anemia
resulting from G6PD deficiency. It is known that people
with this deficiency are not normally anemic and display
no evidence of the disease until the RBCs are exposed to
oxidant stress. The compensatory effect of the de novo GSH
synthesis and GSSG export pathways may thus help to
explain why many varieties of G6PD deficiency have no
evident phenotype. Moreover, it has been proposed that
the high frequency of G6PD deficiency may be due to its
ability to protect against malaria. Our observations sug-
gest that the compensatory mechanism we have eluci-
dated may have aided this spread of G6PD deficiency, as
it counterbalances the worst effects of the deficiency, thus
decreasing its severity and promoting the propagation of
the disease during evolution.
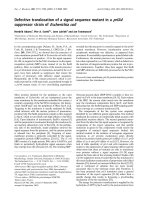
Pathway for the de novo of GSH and the GSSG export systemFigure 2
Pathway for the de novo of GSH and the GSSG export system.
γ
-GCS,
γ
-glutamyl cysteine synthetase;
γ
-CS,
γ
-glutamyl
cysteine.
A
B
C
F
ED
Theoretical Biology and Medical Modelling 2005, 2:18 />Page 7 of 11
(page number not for citation purposes)
Determination of a range of metabolic pathways for
modeling
These results showed that the de novo GSH synthesis path-
way and the GSSG export system are essential for accurate
simulation of G6PD deficiency in human RBCs. Previous
simulations of this deficiency have not included these
pathways [17] and the results they generated were similar
to those obtained using our prototype model (Figure 2).
Our prototype model and the previous models developed
by others contain only three metabolic pathways, namely,
the glycolysis pathway, the pentose phosphate pathway
and the nucleotide metabolic pathway. Although these
models are sufficient for representing the normal state of
the human RBC, they are not adequate for simulating
irregular conditions such as deficiencies, because they lack
alternative pathways that may normally not be particu-
larly active but can compensate for the deficiency to some
extent. Indeed, our results indicate that all the metabolic
Table 4: Rate equations and parameters of GSH synthesis and GSSG export that were used in the expanded model.
Rate equation for
γ
-glutamyl cysteine synthetase
Parameters for
γ
-glutamyl cysteine synthetase
Parameter Value Reference
Vmax 141.57 mM/h 31, 32
α
0.2 31
Kmglu 1.8 mM 31
Kmcys 0.1 mM 31
KiGSH 3.4 mM 31
KmATP 0.4 mM 31
Rate equation for glutathione synthetase
Parameters for glutathione synthetase
Parameter Value Reference
Km
γ
_GC
0.99 mM 33
Km
Gly
1,37 mM 33
Km
ATP
0,23 mM 33
α
2.6 33
Vmax 88.4 mM/h 33
Rate equation for GSSG export
Parameters for GSSG export
Parameter Value Reference
Km
GSSG1
0.1 mM 34
Km
ATP
0.63 mM 34
Vm
1
20
µ
M/h 34
v
Vmax ATP Glu Cys
Km Km Km
Glu
Km
Glu
ATP Glu Cys
Glu
=
++
[][][]
’
[]
’
[][
α
1
CCys
Km Km
Glu ATP
Km Km
Glu Cys ATP
Km
Glu Cys Glu ATP
]
’
[][ ]
’
[][][ ]
’
++
α
GGlu Cys ATP
Km Km
Ordered Ter Mechanism
()
v
Vmax GC Gly ATP
Km Km Km
GC
Km
G
GC Gly ATP
GC
=
++
[ _ ][ ][ ]
[_ ] [_
_
_
γ
α
γγ
γ
γ
1
CCGly
Km Km
GC ATP
Km Km
GC Gly ATP
GC Gly GC ATP
][ ] [ _ ][ ] [ _ ][ ][
__
γγ
γγ
++
]]
α
γ
Km Km Km
GC Gly ATP−
()
Ordered Ter Mechanism
vVmax
GSSG
GSSG KmGSSG
MgATP
MgATP KmATP
=
++
1
1
(
[]
)(
[]
)
Theoretical Biology and Medical Modelling 2005, 2:18 />Page 8 of 11
(page number not for citation purposes)
pathways in the cell will be needed to develop a general
purpose model that can be used to simulate any condi-
tion. However, dynamic simulation based on kinetic
equations requires a large variety of rate equations and
kinetic parameters, and unfortunately, such data are rarely
available as a complete set. Recently, our laboratory
proposed a novel simulation method that reduces the
need for this kind of information [37]. This hybrid
dynamic/static simulation method combines dynamic
rate equations with a flux-based approach and as a result
reduces the numbers of rate equations and parameters
that are needed by up to 70–80%. It may solve the
problems associated with developing a model that simu-
lates all the cellular metabolic pathways.
The mathematical steady state may not be the normal
state of real cells
During this simulation analysis, we realized that the lon-
gevity of enzymes should be considered in long-term sim-
ulation experiments. While in our model the activities of
enzymes are decreased by oxidants, enzymes also gener-
ally become degraded over time. This natural decrease is
not included in our model. As shown in this work, the
prototype model was able to achieve a steady state. How-
ever, this mathematical steady state, which is when the
rates of the production and consumption of all metabolic
intermediates become equal, may not exactly represent
the condition of the RBCs in the human body. Such a
"mathematical steady state" never occurs in living organ-
isms, especially in higher multicellular organisms. Rather,
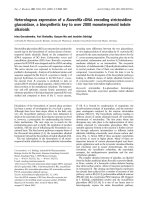
Computer simulation time-course of metabolic intermediatesFigure 3
Computer simulation time-course of metabolic intermediates. Changes in the concentrations of ATP (A), GO6P (B),
GSH (C), GSSG (D), NADP (E) and NADPH (F) during the RBC simulation. The simulation was run for 200,000 seconds
(Approx. 55 h) in simulation time. Concentrations change when G6PD kinetic parameters are shifted from the normal to path-
ological values (Table 3). ATP became depleted at around 20 h.
Theoretical Biology and Medical Modelling 2005, 2:18 />Page 9 of 11
(page number not for citation purposes)
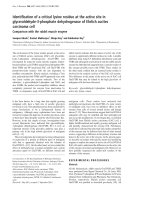
Simulation of G6PD deficiency using the expanded modelFigure 4
Simulation of G6PD deficiency using the expanded model. Changes in the concentrations of ATP (A), GO6P (B), GSH
(C), GSSG (D), NADP (E) and NADPH (F) during RBC simulation. Broken lines are the results of the prototype model, while
solid lines are the results of the expanded model during the same parameter shift as described in Figure 2. The simulation was
run for 200,000 seconds (Approx. 55 h) in simulation time.
The GSH/GSSG ratio of the prototype and expanded modelsFigure 5
The GSH/GSSG ratio of the prototype and expanded models. The prototype model (A) and the expanded model (B).
AB
C
F
E
D
AB
Theoretical Biology and Medical Modelling 2005, 2:18 />Page 10 of 11
(page number not for citation purposes)
homeostasis in multicellular organisms is maintained by
replacing the loss of disposable cells with additional cells.
It is possible that these disposable cells never reach a
mathematical steady state. Thus, a model that can tolerate
long-term simulation for analyzing the pathology of
human diseases should not approximate the
"mathematical steady state". Moreover, in the case where
the system reaches a steady state with a certain oscillation,
it is impossible to obtain a mathematical steady state
using an accurate model. It is known, for example, that
some key enzymes in glycolysis bind to the Band III pro-
tein, an abundant membrane protein in the human RBC
[38-40]. The interaction between glycolytic enzymes and
Band III varies depending on the ratio of oxyhemoglobin
to deoxyhemoglobin, and it is believed that this interac-
tion is responsible for some oscillations in metabolic
pathways in the human RBC.
Conclusion
We developed a computer model of the human RBC that
is based on a previous model but was expanded by intro-
ducing a GSH synthesis pathway and a GSSG export sys-
tem. With this expansion, the model maintained high ATP
concentrations in G6PD deficiency. This suggests that
these pathways may play an important role in alleviating
the consequences of G6PD deficiency. It also indicates
that sub-pathways that are normally not particularly
highly activated may play important roles in abnormal
conditions such as deficiencies.
Authors' contributions
Nakayama contributed mostly to the model develop-
ment, Kinoshita contributed to the analysis, and Tomita
developed the basic ideas and directed the project.
Competing interests
The author(s) declare that they have no competing
interests.
Acknowledgements
We thank Ryo Matsushima and Kazunari Kaizu for providing technical
advice. This work was supported in part by a grant-in-aid from the Ministry
of Education, Culture, Sports, Science and Technology (the leading project
for biosimulation and the 21st Century Center of Excellence (COE) Pro-
gram: Understanding and Control of Life's Function via Systems Biology),
and in part by a grant from New Energy and Industrial Technology Devel-
opment and Organization (NEDO) of the Ministry of Economy, Trade and
Industry of Japan (Development of a Technological Infrastructure for Indus-
trial Bioprocess Project).
References
1. Mendes P: GEPASI: a software package for modelling the
dynamics, steady states and control of biochemical and
other systems. Comput Appl Biosci 1993, 9:563-571.
2. Schaff J, Fink CC, Slepchenko B, Carson JH, Loew LM: A general
computational framework for modeling cellular structure
and function. Biophys J 1997, 73:1135-1146.
3. Goryanin I, Hodgman TC, Selkov E: Mathematical simulation and
analysis of cellular metabolism and regulation. Bioinformatics
1999, 15:749-758.
4. Tomita M, Hashimoto K, Takahashi K, Shimizu TS, Matsuzaki Y, Miy-
oshi F, Saito K, Tanida S, Yugi K, Venter JC, Hutchison CA 3rd: E-
CELL: software environment for whole-cell simulation. Bioin-
formatics 1999, 15:72-84.
5. Tomita M: Whole-cell simulation: a grand challenge of the
21st century. Trends Biotechnol 2001, 19:205-210.
6. Takahashi K, Ishikawa N, Sadamoto Y, Sasamoto H, Ohta S, Shiozawa
A, Miyoshi F, Naito Y, Nakayama Y, Tomita M: E-Cell 2: Multi-plat-
form E-Cell simulation system. Bioinformatics 2003,
19:1727-1729.
7. Takahashi K, Kaizu K, Hu B, Tomita M: A multi-algorithm, multi-
timescale method for cell simulation. Bioinformatics 2004,
20:538-546.
8. Joshi A, Palsson BØ: Metabolic dynamics in the human red cell.
Part I – A comprehensive kinetic model. J Theor Biol 1989,
141:515-528.
9. Joshi A, Palsson BØ: Metabolic dynamics in the human red cell.
Part II – Interactions with the environment. J Theor Biol 1989,
141:529-545.
10. Joshi A, Palsson BØ: Metabolic dynamics in the human red cell.
Part III – Metabolic reaction rates. J Theor Biol 1990, 142:41-68.
11. Joshi A, Palsson BØ: Metabolic dynamics in the human red cell.
Part IV – Data prediction and some model computations. J
Theor Biol 1990, 142:69-85.
12. Ni TC, Savageau MA: Model assessment and refinement using
strategies from biochemical systems theory: application to
metabolism in human red blood cells. J Theor Biol 1996,
179:329-368.
13. Ni TC, Savageau MA: Application of biochemical systems the-
ory to metabolism in human red blood cells. Signal propaga-
tion and accuracy of representation. J Biol Chem 1996,
271:7927-7941.
14. Jamshidi N, Edwards JS, Fahland T, Church GM, Palsson BØ:
Dynamic simulation of the human red blood cell metabolic
network. Bioinformatics 2001, 17:286-7.
15. Mulquiney PJ, Kuchel PW: Model of 2,3-bisphosphoglycerate
metabolism in the human erythrocyte based on detailed
enzyme kinetic equations: computer simulation and meta-
bolic control analysis. Biochem J 1999, 15:597-604.
16. Fiorelli G, Martinez di Montemuros F, Cappellini MD: Chronic non-
spherocytic haemolytic disorders associated with glucose-6-
phosphate dehydrogenase variants. Baillieres Best Pract Res Clin
Haematol 2000, 13:39-55.
17. Schuster R, Jacobasch G, Holzhütter HG: Mathematical modelling
of metabolic pathways affected by an enzyme deficiency.
Energy and redox metabolism of glucose-6-phosphate-dehy-
drogenase-deficient erythrocytes. Eur J Biochem 1989,
182:605-612.
18. Schuster R, Jacobasch G, Holzhütter H: Mathematical modelling
of energy and redox metabolism of G6PD-deficient
erythrocytes. Biomed Biochim Acta 1990, 49:S160-5.
19. Holzhütter HG, Schuster R, Buckwitz D, Jacobasch G: Mathemati-
cal modelling of metabolic pathways affected by an enzyme
deficiency. Biomed Biochim Acta 1990, 49:791-800.
20. Schauer M, Heinrich R, Rapoport SM: Mathematical modelling of
glycolysis and adenine nucleotide metabolism of human
erythrocytes. I. Reaction-kinetic statements, analysis of in
vivo state and determination of starting conditions for in
vitro experiments. Acta Biol Med Ger 1981, 40:1659-1682.
21. Mulquiney PJ, Kuchel PW: Model of the pH-dependence of the
concentrations of complexes involving metabolites, haemo-
globin and magnesium ions in the human erythrocyte. Eur J
Biochem 1997, 245:71-83.
22. Halestrap AP: Transport of pyruvate and lactate into human
erythrocytes. Evidence for the involvement of the chloride
carrier and a chloride-independent carrier. Biochem J 1976,
156:193-207.
23. Henderson JF, Patterson ARP: Nucleotide Metabolism: An Introduction
Academic Press; 1973.
24. Thorburn DR, Kuchel PW: Regulation of the human-erythro-
cyte hexose-monophosphate shunt under conditions of oxi-
dative stress. A study using NMR spectroscopy, a kinetic
Publish with Bio Med Central and every
scientist can read your work free of charge
"BioMed Central will be the most significant development for
disseminating the results of biomedical research in our lifetime."
Sir Paul Nurse, Cancer Research UK
Your research papers will be:
available free of charge to the entire biomedical community
peer reviewed and published immediately upon acceptance
cited in PubMed and archived on PubMed Central
yours — you keep the copyright
Submit your manuscript here:
/>BioMedcentral
Theoretical Biology and Medical Modelling 2005, 2:18 />Page 11 of 11
(page number not for citation purposes)
isotope effect, a reconstituted system and computer
simulation. Eur J Biochem 1985, 50:371-86.
25. McIntyre LM, Thorburn DR, Bubb WA, Kuchel PW: Comparison of
computer simulations of the F-type and L-type non-oxida-
tive hexose monophosphate shunts with 31P-NMR experi-
mental data from human erythrocytes. Eur J Biochem 1989,
180:399-420.
26. Gerber G, Preissler H, Heinrich R, Rapoport SM: Hexokinase of
human erythrocytes. Purification, kinetic model and its
application to the conditions in the cell. Eur J Biochem 1974,
45:39-52.
27. Otto M, Heinrich R, Kuhn B, Jacobasch G: A mathematical model
for the influence of fructose 6-phosphate, ATP, potassium,
ammonium and magnesium on the phosphofructokinase
from rat erythrocytes. Eur J Biochem 1974, 49:169-78.
28. Holzhütter HG, Jacobasch G, Bisdorff A: Mathematical modelling
of metabolic pathways affected by an enzyme deficiency. A
mathematical model of glycolysis in normal and pyruvate-
kinase-deficient red blood cells. Eur J Biochem 1985, 149:101-11.
29. Lassen UV: Hypoxanthine transport in human erythrocytes.
Biochim Biophys Acta 1967, 135:146-54.
30. Jacobasch G, Buckwitz D, Jurowski R, Gerth C, Plonka A, Kuckelkorn
U: Heterogeneity of glucose-6-phosphate dehydrogenase
enzymopathies in the GDR. Biomed Biochim Acta 1987,
46:S177-181.
31. Misra I, Griffith OW: Expression and purification of human
gamma-glutamylcysteine synthetase. Protein Expr Purif 1998,
13:268-276.
32. Ristoff E, Augustson C, Geissler J, de Rijk T, Carlsson K, Luo JL,
Andersson K, Weening RS, van Zwieten R, Larsson A, Roos D: A
missense mutation in the heavy subunit of gamma-glutamyl-
cysteine synthetase gene causes hemolytic anemia. Blood
2000, 95:2193-6.
33. Njalsson R, Carlsson K, Olin B, Carlsson B, Whitbread L, Polekhina
G, Parker MW, Norgren S, Mannervik B, Board PG, Larsson A:
Kinetic properties of missense mutations in patients with
glutathione synthetase deficiency. Biochem J 2000, 349:275-279.
34. Kondo T, Dale GL, Beutler E: Glutathione transport by inside-
out vesicles from human erythrocytes. Proc Natl Acad Sci U S A
1980, 77:6359-6362.
35. Homolya L, Varadi A, Sarkadi B: Multidrug resistance-associated
proteins: Export pumps for conjugates with glutathione, glu-
curonate or sulfate. Biofactors 2003, 17:103-14.
36. Schuster R, Holzhütter HG: Use of mathematical models for
predicting the metabolic effect of large-scale enzyme activ-
ity alterations. Application to enzyme deficiencies of red
blood cells. Eur J Biochem 1995, 229:403-18.
37. Yugi K, Nakayama Y, Tomita M: A hybrid static/dynamic simula-
tion algorithm: Towards large-scale pathway simulation
[abstract]. Proceedings of the Third International Conference on Systems
Biology: 13-15 December 2002, Stockholm:235 .
38. Jenkins JD, Madden DP, Steck TL: Association of phosphofruc-
tokinase and aldolase with the membrane of the intact
erythrocyte. J Biol Chem 1984, 259:9374-8.
39. Jenkins JD, Kezdy FJ, Steck TL: Mode of interaction of phosphof-
ructokinase with the erythrocyte membrane. J Biol Chem 1985,
260:10426-10433.
40. von Ruckmann B, Schubert D: The complex of band 3 protein of
the human erythrocyte membrane and glyceraldehyde-3-
phosphate dehydrogenase: stoichiometry and competition
by aldolase. Biochim Biophys Acta 2002, 1559:43-55.