Báo cáo y học: "Quantification of the glycogen cascade system: the ultrasensitive responses of liver glycogen synthase and muscle phosphorylase are due to distinctive regulatory designs" pptx
Bạn đang xem bản rút gọn của tài liệu. Xem và tải ngay bản đầy đủ của tài liệu tại đây (464.35 KB, 18 trang )
BioMed Central
Page 1 of 18
(page number not for citation purposes)
Theoretical Biology and Medical
Modelling
Open Access
Research
Quantification of the glycogen cascade system: the ultrasensitive
responses of liver glycogen synthase and muscle phosphorylase are
due to distinctive regulatory designs
Vivek K Mutalik and KV Venkatesh*
Address: Department of Chemical Engineering and School of Biosciences and Bioengineering, Indian Institute of Technology, Bombay, Powai,
Mumbai-400 076, India
Email: Vivek K Mutalik - ; KV Venkatesh* -
* Corresponding author
GlycogenEnzyme cascadeReciprocal regulationFutile cycleGlucose homeostasisRegulatory networkUltrasensitivity
Abstract
Background: Signaling pathways include intricate networks of reversible covalent modification
cycles. Such multicyclic enzyme cascades amplify the input stimulus, cause integration of multiple
signals and exhibit sensitive output responses. Regulation of glycogen synthase and phosphorylase
by reversible covalent modification cycles exemplifies signal transduction by enzyme cascades.
Although this system for regulating glycogen synthesis and breakdown appears similar in all tissues,
subtle differences have been identified. For example, phosphatase-1, a dephosphorylating enzyme
of the system, is regulated quite differently in muscle and liver. Do these small differences in
regulatory architecture affect the overall performance of the glycogen cascade in a specific tissue?
We address this question by analyzing the regulatory structure of the glycogen cascade system in
liver and muscle cells at steady state.
Results: The glycogen cascade system in liver and muscle cells was analyzed at steady state and
the results were compared with literature data. We found that the cascade system exhibits highly
sensitive switch-like responses to changes in cyclic AMP concentration and the outputs are
surprisingly different in the two tissues. In muscle, glycogen phosphorylase is more sensitive than
glycogen synthase to cyclic AMP, while the opposite is observed in liver. Furthermore, when the
liver undergoes a transition from starved to fed-state, the futile cycle of simultaneous glycogen
synthesis and degradation switches to reciprocal regulation. Under such a transition, different
proportions of active glycogen synthase and phosphorylase can coexist due to the varying inhibition
of glycogen-synthase phosphatase by active phosphorylase.
Conclusion: The highly sensitive responses of glycogen synthase in liver and phosphorylase in
muscle to primary stimuli can be attributed to distinctive regulatory designs in the glycogen cascade
system. The different sensitivities of these two enzymes may exemplify the adaptive strategies
employed by liver and muscle cells to meet specific cellular demands.
Published: 20 May 2005
Theoretical Biology and Medical Modelling 2005, 2:19 doi:10.1186/1742-4682-2-
19
Received: 15 February 2005
Accepted: 20 May 2005
This article is available from: />© 2005 Mutalik and Venkatesh; licensee BioMed Central Ltd.
This is an Open Access article distributed under the terms of the Creative Commons Attribution License ( />),
which permits unrestricted use, distribution, and reproduction in any medium, provided the original work is properly cited.
Theoretical Biology and Medical Modelling 2005, 2:19 />Page 2 of 18
(page number not for citation purposes)
Background
Signaling networks and metabolic pathways in living cells
are regulated through a complex web of enzyme cascades.
The regulatory architecture of these covalent modification
cascades in combination with allosteric interactions deter-
mines the control of cellular processes [1,2]. A prototypi-
cal example of such an enzyme cascade system is the
regulation of glycogen phosphorylase (GP) and glycogen
synthase (GS), enzymes involved in glycogen degradation
(glycogenolysis) and synthesis (glycogenesis) respectively
[3-6]. To circumvent a futile cycle, simultaneous activa-
tion of glycogenolysis and glycogen synthesis is prevented
through reciprocal regulation of glycogen phosphorylase
and synthase activities by a unique regulatory network
[5,6]. Although this reciprocal regulation is identical in all
tissues, there are subtle differences indicating distinctive
adaptation strategies in different cell types. For example,
in skeletal muscle, phosphoprotein phosphatase-1 (PP1)
is allosterically inactivated by inhibitor-1, whereas in the
liver no such specific inhibitor has been observed [3,7].
Instead, it has been demonstrated that active GP itself
plays a similar inhibitory role, regulating the GS cascade
by allosterically inactivating the corresponding phos-
phatase [8] (Fig. 1). In liver, the phosphorylation states of
GP and GS are regulated by glucose and glucose-6-phos-
phate, whereas in muscle, GP and GS are regulated mainly
by cyclic AMP (cAMP) and calcium concentration [9]. In
the absence of glycogen in the liver, i.e. under starved con-
dition, both GP and GS appear to co-exist in an active
form constituting a futile cycle, thus overcoming the recip-
rocal regulation existing in a normally-fed condition [10].
In the present work, we have quantified the glycogen cas-
cade system at steady state to examine the effect of the net-
work architecture on its performance in liver and muscle.
We have also gained insights into the operation of the sys-
tem in liver under fed and starved conditions. The steady
state model incorporates the cascade structure, multi-step
and zero-order effects and inhibitor sensitivity in response
to cAMP and glucose.
The regulatory system for glycogen synthesis and break-
down mainly consists of phosphorylation and dephos-
phorylation of phosphorylase kinase (PK), which further
regulates the activities of GP and GS [reviewed in [3-6], [9-
12]] (Fig. 1). The activities of these enzymes depend on
extracellular signals as hormones and on cellular-meta-
bolic signals such as glucose and cAMP levels [5,11].
Phosphorylation of GP and GS converts them to catalyti-
cally more active (a-form) and inactive (b-form) species
than their respective dephosphorylated forms. GP is acti-
vated by PK, which in-turn is activated by cAMP-depend-
ent protein kinase (CAPK). GS is inactivated by multiple
protein kinases including CAPK and PK [9]. PP1 is one of
the main phosphatases catalyzing the dephosphorylation
of PK, GP and GS. The regulation of PP1 activity is quite
different in muscle and liver, which are the major sites of
glycogenolysis and glycogenesis (Fig. 1). In liver, GS phos-
phatase is allosterically inactivated by active GP, whereas
in muscle, PP1 is allosterically inactivated by CAPK-acti-
vated inhibitor-1 [3,5,9,12]. Thus, an increased cAMP
level in the muscle cytosol not only increases the phos-
phorylation of PK, GP and GS, but also decreases their
dephosphorylation by regulating the corresponding phos-
phatases. In addition to covalent modification, GP and GS
are also regulated by allosteric interactions. AMP is an
allosteric activator, whereas ATP and glucose-6-phosphate
are allosteric inhibitors of phosphorylase-b [3]. Synthase-
b is allosterically inhibited by physiological concentra-
tions of ATP, ADP and inorganic phosphate, and is also
allosterically activated by glucose-6-phosphate [9].
Experimental and theoretical quantifications [13-23] have
revealed that there are significant advantages in having an
interconvertible enzyme cascade structure in place of a
simple allosteric interaction. These may include signal
amplification, flexibility, robustness, ultrasensitivity and
signal integration [22]. Ultrasensitivity has been defined
as the response of a system that is more sensitive to
changes in the concentration of a ligand than the normal
hyperbolic response represented by the Michaelis-Menten
equation [20]. The Hill coefficient has been used as a sen-
sitivity parameter to quantify the steepness of sigmoidal
dose-response curves [22]. A Hill coefficient greater than
one indicates an ultrasensitive response, and a value less
than one indicates a subsensitive response. The existence
of ultrasensitivity in covalent modification cycles is due to
the operation of enzymes in a region of saturation with
respect to their substrates (termed zero order sensitivity)
[14,15], involvement of the same effector in multiple
steps of a pathway [15], and the presence of stoichiomet-
ric inhibitors [20]. All these requirements for ultrasensi-
tivity appear to be fulfilled by the enzyme cascades
involved in glycogen synthesis and degradation.
Edstrom and coworkers [24,25] have provided experi-
mental proof of zero order ultrasensitivity in the muscle
glycogen phosphorylase cascade. Theoretical analysis of
the glucose-induced switch between phosphorylase and
glycogen synthase in the liver showed the possibility of a
sharp threshold in the response [26]. Furthermore, the
multistep effects of cAMP in the glycogen cascade system
are brought about by activation of the forward step and
indirect inhibition of the reverse step (inhibition of phos-
phatases), thus satisfying the requirement for ultrasensi-
tivity [27]. Although it is known that the second
messenger cAMP affects five different steps in the glycogen
cascades, its effective role in multistep ultrasensitivity has
not been quantified. The output performance of the phos-
phorylase and glycogen synthase cascade in the presence
of an inhibitor has also not been characterized.
Theoretical Biology and Medical Modelling 2005, 2:19 />Page 3 of 18
(page number not for citation purposes)
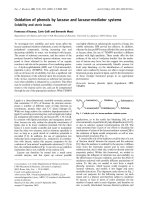
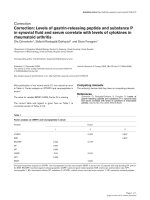
Enzyme cascades involved in the regulation of glycogen synthesis and degradation in (A) Skeletal Muscle (B) LiverFigure 1
Enzyme cascades involved in the regulation of glycogen synthesis and degradation in (A) Skeletal Muscle (B)
Liver. Nomenclature: Active enzyme form is indicated by an affix 'a' and the corresponding inactive form is indicated by an
affix 'b'. R
2
C
2
, cyclic AMP dependent protein kinase (CAPK); C, catalytic subunit of CAPK; PP1, phosphatase-1; PrP2, phos-
phatases-2A; PK, Phosphorylase kinase; GP, glycogen phosphorylase; GS, Glycogen synthase; Glu6P, glucose-6-phosphate; PP1
Inhibitor-1, Inhibitor of PP1; Km
1
to Km
8
are Michaelis-Menten constants, k
1
to k
8
are rate constants, K
11
, K
22
, Kd are dissocia-
tion constants as shown in the figure. Positive and negative signs indicate the activation and inhibition of a reaction respectively.
In the muscle (Fig. 1A), cAMP activated CAPK catalyzes the phosphorylation of GS, PK and inhibitor-1. Phosphorylated PK acti-
vates GP-b. Active phosphatase-2A is assumed to inactivate inhibitor-1, whereas PP1 catalyzes the dephosphorylation of GS,
GP and PK. In liver (Fig. 1B), GP-a catalyzes the allosteric inactivation of GS phosphatase and inhibitor-1 does not appear to be
involved in the regulation of PP1.
(
A)
(
B)
Theoretical Biology and Medical Modelling 2005, 2:19 />Page 4 of 18
(page number not for citation purposes)
The main objective of the current work was to compare
the regulatory structure of the glycogen cascade system
prevalent in the liver and the muscle through steady state
analysis. The quantification incorporates the influences of
all the effectors that regulate the output response of the
glycogen cascade system. The simulation results revealed
that the cascade system exhibits highly sensitive switch-
like responses to changes in cAMP concentration and the
output responses are surprisingly different in muscle and
liver. In muscle, glycogen phosphorylase is more sensitive
than glycogen synthase to cAMP, while the opposite is
observed in liver. The steady state analysis indicates that,
when liver undergoes a transition from starved to fed
state, different proportions of active GP and GS can coex-
ist. The transition from such a futile cycle to reciprocal reg-
ulation depends on the varying inhibition of GS
phosphatase by GP and this regulation may be necessary
to meet the challenges that exist under starved conditions.
Materials and methods
The enzyme cascades involved in the regulation of glyco-
gen synthesis and degradation in muscle and liver are
schematically shown in Fig. 1A and 1B respectively. The
concentrations of the metabolites ATP, AMP and PPi are
assumed to be constant throughout the analysis. Allosteric
regulations of GP and GS by these metabolites and effec-
tors are also neglected. Detailed information on the set of
equations and list of parameters used for the simulation
are given in the Appendix. Most of the parameters and
enzyme concentrations are taken from literature sources
and the same set has been used for simulating the glyco-
gen cascade system of skeletal muscle and liver. In the
present work, the cAMP concentration is considered to be
the primary input to the glycogen cascade. The fractional
activations of GS (dephosphorylated form) and GP
(phosphorylated form) are taken as the output responses
of the glycogen system. The effects of cAMP on the
enzyme cascade are mediated through activation of the
allosteric enzyme CAPK. In the absence of cAMP, CAPK
exists as an inactive holoenzyme, R
2
C
2
, with tightly
bound subunits of the regulatory dimer R
2
and the cata-
lytic subunit C. However, in the presence of cAMP, R
2
C
2
becomes activated through the binding of cAMP to the
regulatory subunit and subsequent dissociation of the
holoenzyme into cAMP-bound regulatory subunits and
the free catalytic subunit [17]. The overall reaction scheme
of CAPK activation is,
R
2
C
2
+ 4(cAMP) ↔ 2C + R
2
(cAMP)
4
[1]
In the present work, CAPK activation by cAMP is assumed
to be a stepwise dissociation of the catalytic subunits. The
analytic expression for quantifying the CAPK activation is
taken from Shacter et al. [17] and it is assumed that the
complex between the catalytic subunit of CAPK and its
target enzyme is negligible compared to the total concen-
tration of CAPK. The activation of CAPK in terms of cata-
lytic subunit formation is quantified using the following
cubic equation (see Appendix for details):
where (R
2
C
2
)
t
denotes the total CAPK, C is the catalytic
subunit, (cAMP) is the total cAMP concentration, and K
11
and K
22
are the dissociation constants of the first and sec-
ond catalytic subunits respectively. A valid root was
obtained as total CAPK catalytic subunit concentration
using Eq. 2 and is taken as the input for modification of
downstream target enzymes.
Figure 1A shows the schematic of the enzyme cascades
involved in regulation of glycogen synthesis and break-
down in the skeletal muscle. Although dual phosphoryla-
tion of PK and multiple phosphorylation of GS have been
observed in vitro [5,9], for simplicity we have considered a
single phosphorylation site for these enzymes. To incor-
porate the PK and CAPK catalyzed phosphorylation of GS,
it is assumed that both the enzymes form a pool before
catalyzing the GS phosphorylation. Ca
+2
, which acts as
another input stimulus to the system, is assumed to be
present at concentrations corresponding to full activation
of PK. Phosphorylated Inhibitor-1 inactivates PP1 by an
allosteric reaction but it fails to inhibit phosphatase-2A.
Here, we consider phosphatase-2A as a dephosphorylat-
ing enzyme of active inhibitor-1, as inhibitor-1 does not
inhibit its own dephosphorylation even at saturating con-
centration [3].
Figure 1B shows the schematic of the glycogen cascade
structure in liver. In vitro studies have shown that glucose-
6-phosphate can stimulate dephosphorylation of GS and
inhibit phosphorylation of GP-b and GS-a, whereas glu-
cose acts as an allosteric activator of GP phosphatase [28-
33]. In the present work, we have incorporated these
effects along with the allosteric inhibition of PP1 by GP-a.
It is assumed that glucose and glucose-6-phosphate influ-
ence the phosphorylation and dephosphorylation reac-
tions by decreasing the respective Michaelis-Menten
constants (see Appendix for equations). Glucose concen-
tration was varied between 0.1 mM to 100 mM and the
corresponding level of glucose-6-phosphate was calcu-
lated to be in the physiological range of 0.1–0.5 mM. The
intracellular cAMP level is regulated by glucose concentra-
tion through hormonal signals such as glucagon. The
inverse relationship between glucose and cAMP levels was
incorporated to estimate the cAMP levels from the glucose
concentration (details in Appendix)
The performance of the enzyme cascades in response to
different cAMP input stimuli was analyzed by the steady
C
cAMP
K
C
cAMP
KK
RC cAMP
K
t
3
2
11
2
4
11 22
22
2
11
+
()
⋅+
()
−
()( )
⋅−
()( )
=C
RC cAMP
KK
t
2
02
22
4
11 22
[]
Theoretical Biology and Medical Modelling 2005, 2:19 />Page 5 of 18
(page number not for citation purposes)
state operating equation from the classic work of Gold-
beter and Koshland [14]. For illustrative purposes, we
present the following cubic equation, which quantifies
the fractional activation inhibitor-1 (Fig. 1A) by taking all
(Michaelis-Menten) complexes of a cascade into account:
where f
1
= I/I
t
, I
t
is the total inhibitor concentration,
(PP2)
t
is the total phosphatase-2A and other terms are as
given in Fig. 1A. From the constraint 0 <f
1
< 1, a valid root
was obtained as a fractional unmodified inhibitor using
Eq. 3. The fractional phosphorylated inhibitor (i.e. I
p
/I
t
)
can then be obtained from the following relationship,
The operating equation for the allosteric interaction of
PP1 with inhibitor-1 and phosphorylase is taken from our
earlier work [34]. The following quadratic equation was
used to simulate the allosteric inhibition of muscle PP1 by
phosphorylated inhibitor-1, given by
where PP1.I
p
is inactive PP1 and K
d
is the dissociation
constant:
where (PP1)
t
is the total PP1 and f
3
is the fractional inacti-
vated PP1 (i.e., (PP1.I
p
)/(PP1)
t
). The fractional free
(active) species of PP1 (i.e., f
4
= (PP1)/(PP1)
t
) can be esti-
mated by f
4
= 1-f
3
.
In the present work, the cascade-connecting complexes
are neglected. For example, complexes of PK with GP-b
and PK with GS-a are neglected in the total PK balance
(details in Appendix). The steady state operating equation
for individual covalent modification cycles and allosteric
interaction were sequentially connected to evaluate the
output response of the cascade structure i.e. fractional
modification of GP and GS to the primary input stimulus,
cAMP in muscle and glucose in liver (details in Appendix).
These equations were solved simultaneously using Matlab
(The Mathworks Inc. USA) to obtain dose-response curves
for fractional steady state activation of all the component
enzymes at various input stimulus levels. Since most of
the parameters are taken from different experimental
reports, we performed the sensitivity analysis on the com-
plete data set. To assess the sensitivity to variations in indi-
vidual parameters, each parameter was varied over a 10-
fold while holding all the other parameters constant.
Results
The steady state model was used to obtain dose-response
curves for the fractional activations of the component
enzymes in glycogen synthesis and degradation. Figure 2A
shows the fractional modification of GP, GS, PK, CAPK
and inhibitor-1 at various concentration of cAMP in skel-
etal muscle. The dose-response curves show an increase in
signal amplification and sensitivity as the signal propa-
gates down the cascade. The fractional activation of CAPK
at various concentrations of cAMP (curve 'e' Fig. 2A)
shows a response curve with an apparent Hill coefficient
( ) of 1.12 and the simulated results are in agreement
with in vitro experimental studies reported by Beavo et al.
[35]. The fractional modifications of GP and GS demon-
strate ultrasensitivity with apparent Hill coefficients of 34
and 7.3 respectively (Fig. 2A). Previous experimental and
theoretical studies by Edstrom and coworkers on the gly-
cogen phosphorylase cascade reported a Hill coefficient of
2.3 in the absence of inhibitor-1 action in muscle [24]. In
subsequent work, they observed that the phosphorylase
cascade exhibits greater sensitivity in the presence of phos-
phatase inhibitor [25]. To assess the contribution of indi-
vidual parameters on the output response of the system,
we carried out the sensitivity analysis on the parameter
set. The results indicate that the sensitivities of GP and GS
display switch-like outputs in response to variation over a
wide range of parameters (Table 1). Further, it can be
noted that the sensitivity of the GP response is always
greater than that of GS in skeletal muscle irrespective of
the range considered for the parameter set. Our simulated
results show that, in the absence of PP1 inhibition by
inhibitor-1, the steepness of the dose-response curves and
signal amplification decreased (see Fig. 2B). The fractional
activations of GP and GS show apparent Hill coefficients
of 3.8 and 1.9 respectively, as compared to a highly sensi-
tive response in the presence of inhibitor action. This
demonstrates that inhibitor ultrasensitivity plays a major
role in imparting sensitivity to the GP and GS responses in
muscle.
The analysis was extended to the glycogen cascade system
in liver. The coordinated changes in the phosphorylation
of PK, GP and GS are under the influence of cAMP, glu-
cose and glucose-6-phosphate concentrations (Fig. 1B).
Figure 3 shows the predicted performance of the glycogen
cascade system in liver at different concentration of glu-
cose, glucose-6-phosphate and cAMP. The results are sur-
prisingly different from those obtained in muscle. Figure
1
22
1
1
2
1
3
12
1
2
−
()
++
()
+−
kC
kPP
f
K
I
K
I
kC
kPP
t
m
t
m
t
t
kkC
kPP
K
I
C
I
kC
kI
f
K
t
m
tt t
1
2
1
1
2
1
2
2
1
()
++ −
+
mm
t
m
t
m
t
tt
I
K
I
K
I
kC
kPP
kC
kPP
112
1
2
1
2
22
2+
()
+
()
−
+
CC
I
kC
kPP
f
K
I
t
t
m
t
+
()
−
=
1
2
1
1
2
2
0
3[]
I
I
f
C
I
kC
kI
K
I
f
p
t
tt
m
t
=− +
+
+
11 4
1
1
2
1
1
[]]
IPP PPI
p
K
p
d
+←→11.,
PP
K
f
PP
K
fI
K
f
fI
t
d
t
d
t
d
t
11
1
3
2
1
3
1
()
−
()
++
()
+.
*
.
*
(()
=
K
d
05[]
η
H
App
Theoretical Biology and Medical Modelling 2005, 2:19 />Page 6 of 18
(page number not for citation purposes)
Table 1: Parametric sensitivity analysis for the glycogen cascade system. The term 'standard' indicates the parameter set used for
simulation in this work and the value is indicated in parenthesis. These parameters were varied over a wide range to assess the
sensitivity of the response. The star symbol indicates that the output response of a particular enzyme did not reach full activation.
Sensitivity analysis for glycogen cascade system of skeletal muscle
Apparent Hill coefficient (Standard) to cAMP levels
S. No. Parameter
(standard set)
Varied Range GP (33) GS (6.4) PK (7) Inhibitor -1 (1.4)
Rate constants (sec
-1
)
1 k1 (1.4) 0.14 – 14 12.2 – 48 2.4 – 17.8 13 – 3.6 1.3 – 1.3
2 k2 (0.01) 0.001 –0.1 48 – 12.2 17.8 – 2.4 3.6 – 13.9 1.3 – 1.34
3 k3 (20) 2 – 200 48 – 12.3 16.2 – 2.5 3.6 – 13.9 1.34 – 1.34
4 k4 (5) 0.5 – 50 12.3 – 48 2.5 – 16.2 13.9 – 3.6 1.34 – 1.34
5 k5 (20) 2 – 200 48.7 – 12.2 6.4 – 6.4 7 – 7 1.34 – 1.34
6 k6 (5) 0.5 – 50 12.2 – 48.7 6.4 – 6.4 7 – 7 1.34 – 1.34
7 k7 (20) 2 – 200 33.8 – 33 17.7 – 2.4 7 – 7 1.34 – 1.34
8 k8 (0.05) 0.005 – 0.5 33.8 – 33 2.4 – 17.7 7 – 7 1.34 – 1.34
Michaelis-Menten Constants (
µ
M)
9 Km1 (5) 0.5 – 50 49 – 13.6 11.6 – 2.7 5.9 – 12.9 1.85 – 1.2
10 Km2 (0.7) 0.07 – 70 40.5 – 27 3.9 – 19.4 18 – 2.6 1.85 – 1.1
11 Km3 (0.4) 0.04 – 4 32 – 42.5 6 – 9 11.9 – 3.1 1.34 – 1.34
12 Km4 (1.1) 0.11 – 11 48.9 – 12 16.3 – 2.5 11.4 – 8.8 1.34 – 1.34
13 Km5 (10) 1 – 100 57.9 – 25 6.4 – 6.4 7 – 7 1.34 – 1.34
14 Km6 (5) 0.5 – 50 55 – 11.5 6.4 – 6.4 7 – 7 1.34 – 1.34
15 Km7 (15) 1.5 – 150 33.8 – 33.8 3.8 – 16 7 – 7 1.34 – 1.34
16 Km8 (0.12) 0.012 – 1.2 33.8 – 33.8 3 – 7.8 7 – 7 1.34 – 1.34
Sensitivity analysis for glycogen cascade system of Liver
S. No. Parameter
(standard set)
Varied Range Apparent Hill coefficient (Standard) to glucose levels
GP (6.3) GS (13.6) PK (1.6)
Rate constants (sec
-1
)
1 k3 (20) 2 – 200 6 – 6 13.7 – 14 * – 2.9
2 k4 (5) 0.5 – 50 6 – 6 14 – 13.7 * – 2.9
3 k5 (20) 2 – 200 5.3 – 5.4 21 – 14.1 1.6 – 1.6
4 k6 (5) 0.5 – 50 5.4 – 5.4 14.1 – 21 1.6 – 1.6
5 k7 (20) 2 – 200 6.3 – 6.3 13 – 20.1 1.6 – 1.6
6 k8 (4) 0.4 – 40 6.3 – 6.3 20.1 – 13 1.6 – 1.6
Michaelis-Menten Constants (
µ
M)
7 Km3 (0.4) 0.04 – 4 6.3 – 6.2 13.6 – 13.4 4 – *
8 Km4 (1.1) 0.11 – 11 10.6 – 5.4 14.5 – 13.8 * – 2.9
9 Km5 (10) 1 – 100 11.2 – 5 12.2 – 18.7 1.6 – 1.6
10 Km6 (5) 0.5 – 50 8 – 3.8 27 – 11.3 1.6 – 1.6
11 Km7 (15) 1.5 – 150 6.3 – 6.3 20.5 – 13 1.6 – 1.6
12 Km8 (0.12) 0.012 – 1.2 6.3 – 6.3 13.9 – 12.3 1.6 – 1.6
Theoretical Biology and Medical Modelling 2005, 2:19 />Page 7 of 18
(page number not for citation purposes)
3A shows that the fractional activation of GS exhibits a
steeper response with an apparent Hill coefficient of 13.6,
while GP demonstrates a response with an apparent Hill
coefficient of 6.3 with respect to glucose. The response
sensitivity of GS was found to be highly dependent on the
GP-a concentration. This result is seems to be in agree-
ment with a recent study showing that hepatic glycogen
synthesis and glycogen synthase activity is highly sensitive
to phosphorylase activity [36]. Because of the stronger
binding between GP-a and GS phosphatase, GS becomes
activated only when the GP-a levels drop below 1%. This
inverse switching between the inactivation of GP and acti-
vation of GS occurs at a glucose concentration of ~10 mM.
This result is in agreement with the experimental observa-
tion that GS becomes activated once GP-a inhibition of
GS phosphatase becomes negligible, and this shift in
activity occurs after meals when the glucose concentration
rises above 10 mM [10,37]. Sensitivity analysis of the
parameter set indicated that the fractional modifications
of GS and GP to glucose levels display switch-like outputs
(Table 1). It was noted that the sensitivity of the GS
response is always greater than that of GP in liver irrespec-
tive of the range considered for the parameter set. The sim-
ulated dose-response curves for fractional activation of
GP-a and GS-a at various concentrations of cAMP also
show an ultrasensitive response. The threshold concentra-
tion of cAMP required to activate GP and inactivate GS is
higher in liver (~1 nM) than in muscle (~0.01 nM). The
dose-response curve for fractional modification of the
enzymes with respect to glucose-6-phosphate demon-
strates that the switching between GP and GS occurs at 20
µ
M with an ultrasensitive response (Fig. 3C). Our result is
consistent with earlier observations showing an inverse
correlation between the activity of GP-a and the concen-
tration of glucose-6-phosphate [33]. Similarly, a direct
correlation exists between GS-a levels and glucose-6-phos-
phate concentration. The threshold activation of phos-
phorylase and glycogen synthase is shown explicitly in
Fig. 3D by plotting the active fraction of synthase against
the active fraction of phosphorylase. GS is activated only
when GP is mostly inactive, demonstrating the inverse
relationship between the activities of the two enzymes.
The inhibition of GS phosphatase by GP-a depends on
glycogen concentration in liver and it has been shown that
a minimal concentration of glycogen is essential for this
inhibition [38,39]. To simulate the fasted or glycogen
depleted state in liver, the steady state analysis was
repeated with the inhibition constant of GP-a reduced.
The simulated results (Fig 4) show that, at a 1000 fold
decrease (Kd value of 2
µ
M) in the inhibition of GS phos-
phatase by GP-a, the liver may have appreciable amounts
(about 50%) of both GP-a and GS-a at 4 to 9 mM glucose.
This result is in agreement with the experimental observa-
tion reported by Massillon et al. [38]. We observe that this
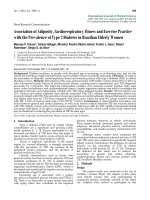
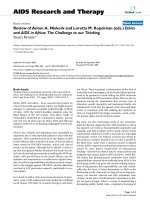
Predicted dose-response curves in case of skeletal muscleFigure 2
Predicted dose-response curves in case of skeletal
muscle. The star symbol (*) represents the experimental
data from Beavo et al. [35]. (A) Dose-response curves in the
presence of inhibition of PP1 by inhibitor-1. The sensitivity of
the fractional dose-response curve of glycogen synthase
(curve a, Apparent Hill coefficient ~6.4), glycogen phos-
phorylase (curve b, ~33.8), phosphorylase kinase (curve
c, ~7), inhibitor-1 (curve d, ~1.3), CAPK activa-
tion (curve e, ~1.12). (B) Dose-response curves in
absence of inhibition of PP1 by inhibitor-1. The sensitivity
fractional dose-response curve of Glycogen synthase (curve
a, ~1.2); Glycogen phosphorylase (curve b, ~3.8);
Phosphorylase kinase (curve c, ~0.8); Inhibitor-1 (curve
d: ~1.3); CAPK activation (curve e, ~1.12).
η
H
App
η
H
App
η
H
App
η
H
App
η
H
App
η
H
App
η
H
App
η
H
App
η
H
App
η
H
App
Theoretical Biology and Medical Modelling 2005, 2:19 />Page 8 of 18
(page number not for citation purposes)
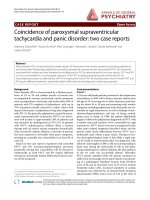
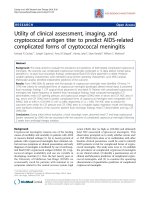
Simulated results of glycogen cascade system in liver, incorporating glycogen synthase phosphatase inhibition by phosphorylase-aFigure 3
Simulated results of glycogen cascade system in liver, incorporating glycogen synthase phosphatase inhibition
by phosphorylase-a. (A) Fractional modification of enzymes at various concentration of glucose. The sensitivity of the frac-
tional dose-response curve of glycogen synthase (curve a, ~13.6), phosphorylase (curve b, ~6.3), phosphorylase
kinase (curve c, ~1.6), CAPK (curve d, ~1.12). (B) Fractional modification of enzymes at various concentrations of
cAMP. The sensitivity of fractional dose-response curve of glycogen synthase (curve a, ~6.8), phosphorylase (curve b,
~3.2), phosphorylase kinase (curve c, ~1.6), CAPK (curve d, ~1.12). (C) Fractional modification of enzymes at
various concentrations of glucose-6-phosphate. The sensitivity of the fractional dose-response curve of glycogen synthase
(curve a, ~14.2) and phosphorylase (curve b, ~6.4). (D) Fractional modification of phosphorylase as a function of
glycogen synthase demonstrating reciprocal regulation. The dissociation constant (Kd) of phosphorylase-a binding to glycogen
synthase phosphatase is taken as 0.002
µ
M.
η
H
App
η
H
App
η
H
App
η
H
App
η
H
App
η
H
App
η
H
App
η
H
App
η
H
App
η
H
App
Theoretical Biology and Medical Modelling 2005, 2:19 />Page 9 of 18
(page number not for citation purposes)
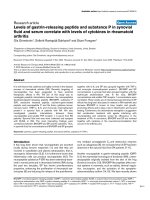
Simulated results of glycogen cascade system in liver under starved conditionsFigure 4
Simulated results of glycogen cascade system in liver under starved conditions. (A) Fractional modification of
enzymes at various concentrations of glucose. The sensitivity of the fractional dose-response curve of glycogen synthase (curve
a, ~10.4), phosphorylase (curve b, ~6.2), phosphorylase kinase (curve c, ~1.6), CAPK (curve d, ~1.12)
(B) Fractional modification of enzymes at various concentrations of cAMP. The sensitivity of the fractional dose-response curve
of glycogen synthase (curve a, ~5.2), phosphorylase (curve b, ~3.1), phosphorylase kinase (curve c, ~1.6),
CAPK (curve d, ~1.12) (C) Fractional modification of enzymes at various concentrations of glucose-6-phosphate. The
sensitivity of the fractional dose-response curve of glycogen synthase (curve a, ~10.5) and phosphorylase (curve b,
~6.4). (D) Fractional modification of phosphorylase as function of glycogen synthase. The dissociation constant (Kd) of
phosphorylase-a binding to glycogen synthase phosphatase is taken as 2
µ
M (~1000 fold higher Kd than used to simulate results
shown in Fig 3). Appreciable amounts of both glycogen synthase and phosphorylase exist in such a fasted state.
η
H
App
η
H
App
η
H
App
η
H
App
η
H
App
η
H
App
η
H
App
η
H
App
η
H
App
η
H
App
Theoretical Biology and Medical Modelling 2005, 2:19 />Page 10 of 18
(page number not for citation purposes)
decrease in the steepness of the GS response curve is due
to reduction in the phosphatase inhibition by GP-a. A
decrease of similar extent in the ultrasensitivity of the GS
response was observed with respect to cAMP and glucose-
6-phosphate (see Fig. 4B and 4C). Furthermore, plotting
the active fraction of GP as a function of the active fraction
of GS demonstrates the absence of reciprocal regulation in
the fed state (Fig. 4D).
The exact percentage reduction in the inhibition of GS
phosphatase by GP-a is unknown. When liver undergoes
a metabolic shift from completely starved to fed state, the
inhibition of GS phosphatase can vary over a wide range.
This was simulated by changing the inhibition constant
(Kd) of GS phosphatase from 0.002
µ
M to a very high Kd
value to represent no inhibition. These results are shown
in Fig. 5 as a plot of the active fraction of GP against the
active fraction of GS at different inhibitor constants. In the
complete absence of inhibition, both GS and GP exist in
100% active states indicating a futile cycle (curve 'g' Fig.
5). In such a state, the cells would not accumulate glyco-
gen due to continuous glycogenolysis by GP-a. In the fed
state, i.e. in the presence of appreciable amounts of glyco-
gen in the liver, the inhibition of GS phosphatase by GP-
a is high and a reciprocal regulation of GP and GS activity
is observed (curve a, Fig. 5). Different proportions of
active fractions of GP-a and GS-a can coexist when condi-
tions change from starved to fed state, owing to varying
net glycogen concentrations in the liver (curves b-f, Fig.
5).
Discussion
The coordinated regulation of glycogenolysis and glyco-
genesis in the liver and the skeletal muscle is dependent
on a network of interacting enzymes and effectors that
determine the fractional activation of GP and GS [3-6,9-
12]. In the present work, the cascades involved in the reg-
ulation of glycogen synthesis and breakdown were ana-
lyzed at steady state to gain an insight into the inherent
design principle of the regulatory cascades existing in
muscle and liver. Using experimental data from the litera-
ture for rate and Michaelis-Menten constants, the simula-
tion results revealed that, in muscle, the response of GP to
cAMP input is more highly sensitive ( ~34) than that
of GS ( ~6.5), whereas in the liver, the GS sensitivities
to glucose ( ~13.6) and cAMP ( ~6.8) are high
compared to that of GP ( ~6.3 for glucose and
~3.2 for cAMP). The sensitivity analysis indicated
that this differential performance of GS and GP in liver
and muscle is due to the presence of a distinctive regula-
tory design and not to selection of a particular parameter
set. CAPK-activated inhibitor-1 inhibits PP1, which is a
major dephosphorylating enzyme in muscle, whereas GP-
a inhibits GS phosphatase in liver, representing this dis-
tinctive design. The simulation results indicate that the
response sensitivity of GS with respect to glucose and
cAMP is highly dependent on the GP concentration in
liver. Similarly, the sensitivities of the PK, GP and GS
responses are dependent on inhibitor-1 concentration in
muscle. The ultrasensitive response of these enzymes may
be attributed to the known system-level mechanisms,
namely, multistep ultrasensitivity due to cAMP, inhibitor
ultrasensitivity due to phosphatase inhibitor and zero
order effects due to the pyramidal relationship in enzyme
component concentrations. However, the significance of
this switch-like response of GP in muscle and GS in liver
is unclear. It can be argued that glycogen breakdown in
muscle has to be sensitive to the second messenger cAMP
in order to meet the urgent requirement for glucose dur-
ing exercise or the fight and flee response. Similarly,
Variable fractional levels of active phosphorylase-a and syn-thase-a in the liver under fasted (glycogen depletion) stateFigure 5
Variable fractional levels of active phosphorylase-a
and synthase-a in the liver under fasted (glycogen
depletion) state. The dissociation constant of phosphory-
lase-a binding to glycogen synthase phosphatase was varied
from 0.002
µ
M to no-inhibition (very high Kd), to simulate
the metabolic transition from fasted to fed state. The values
of dissociation constants (Kd) used are, curve a: 0.002
µ
M;
curve b, 0.2
µ
M; curve c, 2
µ
M; curve d, 5
µ
M; curve e, 10
µ
M; curve f, 20
µ
M; curve g, very high dissociation constant
(~10
6
). The active fraction of glycogen synthase and phos-
phorylase coexist in liver in the no-inhibition state (starved
condition), while simultaneous activation of phosphorylase
and inactivation of synthase is seen in liver in the fed state.
The fractional active form of glycogen synthase and phospho-
rylase varies over a wide range between these operations.
η
H
App
η
H
App
η
H
App
η
H
App
η
H
App
η
H
App
Theoretical Biology and Medical Modelling 2005, 2:19 />Page 11 of 18
(page number not for citation purposes)
glycogen synthesis in liver has to be sensitive to blood glu-
cose concentration, so that GS can start synthesizing gly-
cogen whenever the blood glucose concentration
increases beyond a toxic level.
In muscle, the ultrasensitive response of GP can be
directly attributed to the presence of zero order effects (GP
concentration about ~70
µ
M) and compounded by the
inhibitor ultrasensitivity imparted by inhibitor-1. Such a
direct effect is not observed in GS owing to its minimal
zero order effects (GS concentration about ~3
µ
M). The
primary stimulus, cAMP, not only increases the phospho-
rylation of PK, GP and GS, but also indirectly decreases
their dephosphorylation through inhibitor-1. In liver, the
ultrasensitive response of GS can be attributed mainly to
the inhibitor ultrasensitivity caused by GP on the GS mod-
ification cycle. In this case, the zero order effect actually
resides in the GP cascade, which transmits it to the GS
cycle by inhibiting the dephosphorylation reaction. Fur-
thermore, the stimulatory effect of glucose on dephospho-
rylation of GP-a, the inhibitory effect of glucose-6-
phosphate on phosphorylation of GP-b and GS-a, and the
stimulation of GS dephosphorylation by glucose-6-phos-
phate, enhance the sensitivity of GS. Thus, the ultrasensi-
tivity of GS in liver is brought about by the combined
action of the multistep effects of cAMP, the inhibition of
GS phosphatase by active GP and the influence of glucose
and glucose-6-phosphate concentration.
It is noteworthy that the simultaneous activation and
deactivation of GP and GS respectively in muscle and liver
results in reciprocal regulation of these enzymes by the
primary stimulus. This reciprocal regulation, although
identical in all tissues, still imparts a distinctive adaptive
strategy in different cell types owing to subtle differences
in the network. For example, the inhibition of GS phos-
phatase by GP in liver can compromise the reciprocal reg-
ulation in the absence of liver glycogen (i.e. starved state),
while in muscle the reciprocal regulation cannot be com-
promised owing to an independent inhibitor-1. Our sim-
ulation of the glycogen cascade system under starved
condition demonstrates that the sensitivity of GS reduces
because of the reduction in inhibitor ultrasensitivity
caused by GP. The percentage reduction in the inhibition
of GS phosphatase is unknown. It is possible that when
the liver undergoes a transition from starved to fed state,
GS phosphatase can experience varying degrees of inhibi-
tion by GP. This results in a shift from a highly futile cycle
with no inhibition to reciprocal regulation in the fed state.
This causes GS to be always active, while GP is active only
in the starved state in the presence of high glucose (see Fig.
5).
Hallenbeck and Walsh [40] observed that, if the quantity
of phosphorylase sequestered in the glycogen particle
compartment of rabbit muscle is taken into account, then
the local concentration of GP can be very high (up to 2–5
mM). Furthermore, GP interaction with the glycogen par-
ticle is known to lower the Michaelis-Menten constants of
PK and PP1, thus enhancing the zero order effects further
[29,25]. Considering these observations, Meinke and
Edstrom [25] estimated an apparent Hill coefficient of 51
for the activation of 3.5 mM phosphorylase. Our simula-
tion results show that at 3.5 mM phosphorylase the sys-
tem can actually show a highly ultrasensitive response
with an apparent Hill coefficient as high as 200 (results
not shown). This apparent Hill coefficient value is far
higher than any known ultrasensitive system or any of the
cooperative enzymes. Though the utility of such a highly
sensitive response in vivo is unclear at present, various
observations indicate that the multi-enzyme cascade sys-
tem has the potential to exhibit higher sensitivity.
Signaling by hormones such as glucagon and epinephrine
is known to elicit responses within a fraction of a second,
incorporating amplification of the input signal and
enhanced sensitivity to allosteric effectors [2,3,27,41]. It
has also been shown, in the contraction of resting muscle,
that GP-b is converted to GP-a within a second followed
by immediate initiation of glycogenolysis [3]. Such rapid
and sensitive responses are known to be the characteristic
behavior of enzyme cascades with progressive increase in
enzyme concentration down the cascade [2]. This effect
can also be brought about by the opposing action of the
same effector on modifying and demodifying enzymes
[18] and the presence of a stoichiometric inhibitor [20]. It
appears that living systems use these ultrasensitive regula-
tory mechanisms to coordinate multiple input signals,
show varied responses to different signals, exhibit rapid
responses at an invariably low stimulus concentration
[2,3,27] and, most importantly, use negligible amount of
cellular energy [42,43].
Theoretical quantification of a regulatory system as pre-
sented here reveals insights into system level properties.
Ultrasensitivity, signal amplification, flexibility in opera-
tion and signal integration are all system level properties,
and are not apparent in isolated components. These prop-
erties can be studied by connecting different functional
units and defining the quantitative relationship between
different components of a system. Our simulation results
revealed that the switch-like responses of GP and GS in
liver and muscle are comparable with that of the MAPK
cascade in Xenopus oocytes [21]. At the metabolic level, GP
and GS are also regulated by calcium levels and feedback
loops constituted by effectors such as ATP, AMP, cAMP,
glucose and glycogen [3-6,9-12]. Furthermore, GS and PK
are known to have multiple phosphorylation sites [5,9].
Regulatory networks made up of multiple feedback loops
and multiple phosphorylation cycles, as seen in the
Theoretical Biology and Medical Modelling 2005, 2:19 />Page 12 of 18
(page number not for citation purposes)
activation of maturation-promoting factor and the MAP
kinase cascade during oocyte maturation [44,45], can
yield multiple steady state responses. Although we have
not incorporated the overall regulatory network, our anal-
ysis suggests that the enhanced sensitivity observed in the
glycogen cascade system may act as a selective pressure in
evolution favoring tissue-specific adaptive strategies and
compartmental regulatory modules.
The abbreviations used are
GP: Glycogen Phosphorylase;
GS: Glycogen Synthase;
cAMP: cyclic AMP;
PP1: Phosphoprotein Phosphatase-1;
PK: Phosphorylase Kinase;
CAPK: cAMP dependent Protein Kinase;
Competing interests
The author(s) declare that they have no competing
interests.
Authors' contributions
VKM and KVV conceived and designed the experiments.
VKM performed the experiments. VKM and KVV analyzed
the data. VKM and KVV conceptualized the manuscript.
All authors have read and approved the final manuscript.
Appendix
The following equations were solved in Matlab (The
Mathworks Inc. USA) to obtain dose-response curves for
fractional steady state activation of component enzymes
at various cAMP levels. The steepness of these stimulus
dose-response curves can be approximated using the Hill
equation. The global output response (fractional modifi-
cation of phosphorylase and glycogen synthase) can then
be quantified in terms of apparent Hill coefficients and
half saturation constants, with respect to the input stimu-
lus concentration. Here, the half saturation constant is the
amount of input stimulus required for 50% fractional
modification of the corresponding protein kinase. Thus,
the half saturation constant indicates a mid-point on the
unmodified to modified kinase transition curve. The
apparent Hill coefficient can also be calculated by estimat-
ing the primary input concentration required for 10% to
90% modification of the target enzyme by using the fol-
lowing equation:
where I
0.1
and I
0.9
are the input concentrations required
for 10% to 90% modification of target enzyme and
is the apparent Hill coefficient. In the following section
we detail the solution strategy employed in simulations.
The following equations are derived for the glycogen cas-
cade system schematically shown in Fig 1.
(I) Activation of cAMP dependent protein kinase (CAPK)
by cAMP
Two cAMP molecules bind to each R subunit of CAPK
(R
2
C
2
) through an infinitely cooperative mechanism and
this results in stepwise dissociation of the catalytic subunit
[17]
where K
11
and K
22
are the dissociation constants and C is
a catalytic subunit.
Mass balance on catalytic subunit yields
[C
t
] = 2[R
2
C
2
] + [R
2
C(cAMP)
2
] + [C] [A6]
Using equations [A6] and [A7], we obtain a cubic equa-
tion for the active catalytic subunit C.
where [R
2
C
2
]
t
denotes total CAPK, C is the catalytic subu-
nit, [cAMP] is total cAMP concentration. A valid root was
obtained as total catalytic subunit concentration of CAPK
using Eq. A8, and is taken to be same in both liver and
muscle.
A
η
H
App
I
I
=
log
log
[]
.
.
81
1
09
01
η
H
App
RC cAMP RCcAMP C
K
22 2 2
22
11
+←→ +() []A
R C cAMP cAMP R C cAMP C
K
22 24
23
22
() () []+←→ + A
K
RC cAMP
RC cAMP C
11
22
2
2
2
4=
[][ ]
()
[]
A[]
K
R C cAMP cAMP
RC cAMP C
22
2
2
2
2
4
5=
()
[]
()
[]
A[]
But ARC
RC
cAMP
KC
cAMP
KK C
t
22
2
11
4
11 22
2
22
1
7
[]
=
[]
+
[]
[]
+
[]
[]
[]
C
cAMP
K
C
cAMP
KK
RC cAMP
K
t
3
2
11
2
4
11 22
22
2
11
+
()
+
()
−
()( )
.
−
()( )
=.[]C
RC cAMP
KK
t
2
08
22
4
11 22
A
Theoretical Biology and Medical Modelling 2005, 2:19 />Page 13 of 18
(page number not for citation purposes)
In the current work, the following cascade-connecting
complexes were neglected in the total interconvertable
balance: complexes between CAPK catalytic subunits and
inhibitor-1, phosphorylase kinase and glycogen synthase
in the CAPK balance; inhibitor-1 complex with PP1 in the
inhibitor-1 balance; PP1 complexes with phosphorylase
kinase, phosphorylase and synthase in the PP1 balance;
phosphorylase kinase complexes with phosphorylase and
synthase in the phosphorylase kinase balance; liver glyco-
gen phosphorylase complex with PP1 in the phosphory-
lase balance. We have verified the extent of formation of
these complexes and they were found to be negligible
compared to the corresponding total interconvertable
enzymes. This assumption is valid when the dose-
response curve of each target enzyme exceeds 90% phos-
phorylation [23].
(II) Operating equations for covalent modification cycles
[14] involved in regulation of glycogen synthesis and
breakdown in the muscle
Cubic equation for phosphorylation-dephosphorylation cycle of
Inhibitor-1
where f
1
= I/I
t
, I
t
and I are total and unphosphorylated
inhibitor concentration, (PP2)
t
is total phosphatase 2A, k
1
and k
2
are rate constants for phosphorylation and dephos-
phorylation of inhibitor-1 respectively. K
m1
and K
m2
are
Michaelis-Menten constants for phosphorylation and
dephosphorylation of inhibitor-1 respectively. From the
constraint 0 <f
1
< 1, a valid root was obtained as a frac-
tional unmodified inhibitor using Eq. A9. The fractional
phosphorylated inhibitor (i.e. I
p
/I
t
) can then be obtained
using the following relationship:
where f
2
= I
p
/I
t
Quadratic equation for allosteric interaction of phosphorylated
phosphorylase with PP1 [34]
where P
p
is phosphorylated phosphorylase, PP1.P
p
is inac-
tive PP1 and Kd is the dissociation constant.
where (PP1)
t
is total PP1 and f
3
is fractional inactivated
PP1 (i.e., (PP1.I
p
)/(PP1)
t
). The fractional free (active) spe-
cies of PP1 (i.e. f
4
= (PP1)/(PP1)
t
) can be estimated by f
4
=
1-f
3
.
Cubic equation for phosphorylation-dephosphorylation cycle of
phosphorylase kinase
where f
5
= K/K
t
, K
t
and K are total and unphosphorylated
phosphorylase kinase concentration, k
3
and k
4
are rate
constants for phosphorylation and dephosphorylation of
phosphorylase kinase respectively. K
m3
and K
m4
are
Michaelis-Menten constants for phosphorylation and
dephosphorylation of phosphorylase kinase respectively.
From the constraint 0 <f
5
< 1, a valid root was obtained as
a fractional unmodified phosphorylase kinase using Eq.
A13. The fractional phosphorylated phosphorylase kinase
(i.e. K
p
/K
t
) can then be obtained using the following
relationship:
where f
6
= K
p
/K
t
Cubic equation for phosphorylation-dephosphorylation cycle of
phosphorylase
where f
7
= P/P
t
, P
t
and P are total and unphosphorylated
phosphorylase concentrations, k
5
and k
6
are rate constants
for phosphorylation and dephosphorylation of phospho-
rylase respectively. K
m5
and K
m6
are Michaelis-Menten
constants for phosphorylation and dephosphorylation of
phosphorylase respectively. From the constraint 0 <f
7
< 1,
a valid root was obtained as a fractional unmodified
phosphorylase using Eq. A15. The fractional phosphor-
ylated phosphorylase (i.e. P
p
/P
t
) can then be obtained
using the following relationship:
1
22
1
1
2
1
3
12
1
2
−
()
++
()
+−
kC
kPP
f
K
I
K
I
kC
kPP
t
m
t
m
t
t
kkC
kPP
K
I
C
I
kC
kI
f
K
t
m
tt t
1
2
1
1
2
1
2
2
1
()
++ −
+
mm
t
m
t
m
t
tt
I
K
I
K
I
kC
kPP
kC
kPP
112
1
2
1
2
22
2+
()
+
()
−
+
CC
I
kC
kI
f
K
I
tt
m
t
+
−
=
1
2
1
1
2
0
9[]A
ff
C
I
kC
kI
K
I
f
tt
m
t
21
1
2
1
1
11 10=− +
+
+
[A ]]
IPP PPI
p
K
p
d
+←→11 11.[]A
PP
K
f
PP
K
fI
K
f
fI
t
d
t
d
t
d
t
11
1
3
2
1
3
1
()
−
()
++
()
+
()
KK
d
= 012[]A
1
11
3
44
5
3
343
44
−
()
++
()
kC
kf PP
f
K
K
K
K
kC
kf PP
t
m
t
m
t
t
+−
()
++ −
1
1
1
3
44
33
4
kC
kf PP
K
K
C
K
kC
kK
t
m
tt t
++
()
+
()
−
f
K
K
K
K
K
K
kC
kf PP
kC
kf PP
m
t
m
t
m
t
tt
5
2
3343
44
3
44
11
220
13
3
4
5
3
2
++
−
=
C
K
kC
kK
f
K
K
tt
m
t
[]A
ff
C
K
kC
kK
K
K
f
tt
m
t
65
3
4
3
5
11 14=− +
+
+
[A ]]
1
11
56
64
7
3
5656
64
−
()
++
()
kfK
kf PP
f
K
P
K
P
kfK
kf PP
t
t
m
t
m
t
t
t
+−
()
++1
1
56
64
56 56
6
kfK
kf PP
K
P
fK
P
kfK
kP
t
t
m
t
t
t
t
t
−−
++
()
1
1
7
2
55656
64
f
K
P
K
P
K
P
kfK
kf PP
m
t
m
t
m
t
t
t
+
()
−
++
kfK
kf PP
fK
P
kfK
kP
t
t
t
t
t
t
56
64
656
6
1
2
−
=f
K
P
m
t
7
5
2
0
15[]A
Theoretical Biology and Medical Modelling 2005, 2:19 />Page 14 of 18
(page number not for citation purposes)
where f
8
= P
p
/P
t
Cubic equation for phosphorylation-dephosphorylation cycle of
glycogen synthase
where f
9
= S/S
t
, S
t
and S are total and unphosphorylated
glycogen synthase concentrations, k
7
and k
8
are rate con-
stants for phosphorylation and dephosphorylation of gly-
cogen synthase respectively. K
m7
and K
m8
are Michaelis-
Menten constants for phosphorylation and dephosphor-
ylation of glycogen synthase respectively. From the con-
straint 0 <f
9
< 1, a valid root was obtained as a fractional
unmodified glycogen synthase using Eq. A17. The
fractional phosphorylated glycogen synthase (i.e. S
p
/S
t
)
can then be obtained using the following relationship:
where f
10
= S
p
/S
t
A plot of fractional activation of catalytic subunit, inhibi-
tor-1 (f
2
), phosphorylase kinase (f
6
), phosphorylase (f
8
)
and glycogen synthase (f
10
) at different cAMP input con-
centrations in muscle is shown in Fig 2 of the main text.
(III) Operating equations for covalent modification cycles
involved in regulation of glycogen synthesis and
breakdown in liver
In this case, glucose is considered to be the primary input
to the enzyme cascades. Glucose-6-phosphate levels were
estimated from various concentration of glucose using the
following relationship:
where g6pt represents physiological (maximum) concen-
tration of glucose-6-phosphate, g6p is the concentration
of glucose-6-phosphate in relation to the concentration of
glucose and Kg is an activation constant. Glucose concen-
tration regulates intracellular cAMP levels through hor-
monal signals such as glucagon. The inverse relationship
between glucose and cAMP levels is incorporated by the
following equation:
where cAMPt represents the physiological (maximum)
concentration of cyclic AMP, cAMP is the concentration of
cyclic AMP in relation to the concentration of glucose and
Ki represents the inhibitor constant. The superscript 2 and
the parameters including Ki, kg and kg2 are suitably cho-
sen so that glucose-6-phosphate and cAMP are relatively
in the physiological range. cAMP is further taken as an
input to CAPK activation. The analytic expression for this
interaction is the same as given in Eq. A8.
Cubic equation for phosphorylation-dephosphorylation cycle of
phosphorylase kinase
where f
11
= K/K
t
, K
t
and K are total and unphosphorylated
phosphorylase kinase concentrations, k
3
and k
4
are rate
constants for phosphorylation and dephosphorylation of
phosphorylase kinase respectively. K
m3
and K
m4
are
Michaelis-Menten constants for phosphorylation and
dephosphorylation of phosphorylase kinase respectively.
From the constraint 0 <f
11
< 1, a valid root was obtained
as a fractional unmodified phosphorylase kinase using
Eq. A21. The fractional phosphorylated phosphorylase
kinase (i.e. K
p
/K
t
) can then be obtained using the follow-
ing relationship:
where f
12
= K
p
/K
t
Equations for glucose and glucose-6-phosphate influence on enzyme
cascades in liver
Glucose-6-phosphate inhibition of phosphorylase b phosphorylation
where K
m5
is the Michaelis-Menten constant for phospho-
rylation of phosphorylase-b, K
m51
represents K
m5
modi-
fied by glucose-6-phosphate effects.
ff
fK
P
kfK
kP
K
P
f
t
t
t
t
m
t
87
656
6
5
7
11=− +
+
+
[]A16
1
1
76
84
9
3
7
8
76
8
−
+
()
()
++
+
()
kCfK
kf PP
f
K
S
K
S
kCfK
kf
t
t
m
t
m
t
t
44
76
84
7
6
1
1
1PP
kCfK
kf PP
K
S
CfK
t
t
t
m
t
()
+−
+
()
()
+
+
tt
t
t
t
m
t
m
t
m
t
S
kCfK
kS
f
K
S
K
S
K
S
k
()
+
+
()
−
++
76
8
9
2
77
8
1
776
84
76
84
11
2
CfK
kf PP
kCfK
kf PP
t
t
t
t
+
()
()
+
+
()
()
−
+
+
()
+
+
()
−
CfK
S
kCfK
kS
f
K
S
t
t
t
t
m
t
676
8
9
7
22
0
17
=
[]A
ff
CfK
S
kCfK
kS
K
S
f
t
t
t
t
m
t
10 9
676
8
7
9
11=− +
+
()
+
+
()
+
[]A18
gp gpt
glucose
Kg glucose
66 19=
+
*[]A
cAMP cAMPt
Ki
Ki glucose
=
+
*[]
2
22
20A
1
11
1
3
4
11
3
343
4
−
()
++
()
+
kC
kPP
f
K
K
K
K
kC
kPP
t
m
t
m
t
t
−−
()
++ −
kC
kPP
K
K
C
K
kC
kK
f
t
m
tt t
3
4
33
4
11
2
1
1
+++
()
+
()
−
K
K
K
K
K
K
kC
kPP
kC
kPP
m
t
m
t
m
t
tt
3333
4
3
4
11
2
++
−
=
C
K
kC
kK
f
K
K
tt
m
t
3
4
11
3
2
0
21[]A
ff
C
K
kC
kK
K
K
f
tt
m
t
12 11
3
4
3
11
11=− +
+
+
[AA22]
KK
SGP
kg
mm51 5
1
16
2
23=+
*
*
[]A
Theoretical Biology and Medical Modelling 2005, 2:19 />Page 15 of 18
(page number not for citation purposes)
Activation of dephosphorylation of phosphorylase a by glucose
where K
m6
is the Michaelis-Menten constant for dephos-
phorylation of phosphorylase a, K
m61
represents K
m6
mod-
ified by glucose effects. S2 is a multiplicative factor and kgi
represents the activation constant.
Cubic equation for phosphorylation-dephosphorylation cycle of
phosphorylase
where f
13
= P/P
t
, P
t
and P are total and unphosphorylated
phosphorylase concentrations, k
5
and k
6
are rate constants
for phosphorylation and dephosphorylation of phospho-
rylase respectively. K
m5
and K
m6
are Michaelis-Menten
constants for phosphorylation and dephosphorylation of
phosphorylase respectively. From the constraint 0 <f
13
< 1,
a valid root was obtained as a fractional unmodified
phosphorylase using Eq. A25. The fractional phosphor-
ylated phosphorylase (i.e. P
p
/P
t
) can then be obtained
using the following relationship:
where f
14
= P
p
/P
t
Quadratic equation for allosteric interaction of phosphorylated
phosphorylase with PP1 [34]
where P
p
is phosphorylated phosphorylase, PP1.I
p
is inac-
tive PP1 and Kd is the dissociation constant
where (PP1)
t
is total PP1 and f
15
is fractional inactivated
PP1 (i.e. (PP1.P
p
)/(PP1)
t
). The fractional free (active) spe-
cies PP1 (i.e. f
16
= (PP1)/(PP1)
t
) can be estimated by f
16
=
1-f
15
.
Equations for glucose and glucose-6-phosphate influence on enzyme
cascades in liver
Activation of glycogen synthase dephosphorylation by glucose-6-
phosphate
where K
m8
is the Michaelis-Menten constant for dephos-
phorylation of synthase, K
m81
represents K
m8
modified by
glucose-6-phosphate effects. S1 is a multiplicative factor
and kg2 represents the activation constant.
Inhibition of glycogen synthase phosphorylation by glucose-6-
phosphatase
where K
m7
is the Michaelis-Menten constant for phospho-
rylation of synthase, K
m71
represents K
m7
modified by glu-
cose-6-phosphate effects.
Cubic equation for phosphorylation-dephosphorylation cycle of
glycogen synthase
where f
17
= S/S
t
, S
t
and S are total and unphosphorylated
glycogen synthase concentrations, k
7
and k
8
are rate con-
stants for phosphorylation and dephosphorylation of gly-
cogen synthase respectively. K
m7
and K
m8
are Michaelis-
Menten constants for phosphorylation and dephosphor-
ylation of glycogen synthase respectively. From the con-
straint 0 <f
17
< 1, a valid root was obtained as a fractional
unmodified glycogen synthase using Eq. A31. The frac-
tional phosphorylated glycogen synthase (i.e. S
p
/S
t
) can
then be obtained using the following relationship:
where f
18
= S
p
/S
t
A plot of fractional activation of catalytic subunit, phos-
phorylase kinase (f
12
), phosphorylase (f
14
) and glycogen
synthase (f
18
) at different glucose, glucose-6-phosphate
and cAMP concentrations in liver is shown in Fig 3 and 4
of the main text.
K
K
Sglucose
kgi
m
m
61
6
1
2
24=
+
*
[]A
1
11
512
6
13
3
51 61 5 12
6
−
()
++
()
kf K
kPP
f
K
P
K
P
kf K
kPP
t
t
m
t
m
t
t
t
+−
()
++1
1
512
6
51 12 5 12
kf K
kPP
K
P
fK
P
kf K
k
t
t
m
t
t
t
t
66
13
2
51 51 61 5 12
6
1
1
P
f
K
P
K
P
K
P
kf K
kPP
t
m
t
m
t
m
t
t
−
++
()
tt
t
t
t
t
t
t
kf K
kPP
fK
P
kf K
kP
+
()
−
++
512
6
6512
6
1
2
−
=f
K
P
m
t
13
51
2
0
25[]A
ff
fK
P
kf K
kP
K
P
f
t
t
t
t
m
t
14 13
12 5 12
6
51
13
11=− +
+
+
[]A26
PPP PPP
p
K
p
d
+←→11 27.[]A
PP
K
f
PP
K
fP
K
f
f
t
d
t
d
t
d
11
1
15
2
14
15
14
()
−
()
++
()
+
PP
K
t
d
()
= 028[]A
K
K
SGP
kg
m
m
81
8
1
16
2
29=
+
*
[]A
KK
SGP
kg
mm
71 7
1
16
2
30=+
*
*
[]A
1
1
712
816
17
3
71
81
712
−
+
()
()
++
+kCfK
kf PP
f
K
S
K
S
kCfK
t
t
m
t
m
t
tt
t
t
t
m
kf PP
kCfK
kf PP
K
()
()
+−
+
()
()
816
712
816
1
1
1
771
12 7 12
8
17
2
71
1
S
CfK
S
kCfK
kS
f
K
t
t
t
t
t
m
+
+
()
+
+
()
−
+
SS
K
S
K
S
kCfK
kf PP
kCfK
t
m
t
m
t
t
t
t
71
81
712
816
712
1
+
+
()
()
+
+
()
kkf PP
CfK
S
kCfK
kS
t
t
t
t
t816
12 7 12
8
1
2
()
−
+
+
()
+
+
()
−
=f
K
S
m
t
17
71
2
0
31[]A
ff
CfK
S
kCfK
kS
K
S
f
t
t
t
t
m
t
18 17
12 7 12
8
71
17
11=− +
+
()
+
+
()
+
[]A32
Theoretical Biology and Medical Modelling 2005, 2:19 />Page 16 of 18
(page number not for citation purposes)
Parameters from the literature used for the simulations
Rate Constants
k1 = 1.4 sec
-1
rate constant for phosphorylation of inhibi-
tor [48]
k2 = 0.01 sec
-1
rate constant for dephosphorylation of
inhibitor [assumed]
k3 = 20 sec
-1
rate constant for phosphorylation of phos-
phorylase kinase [assumed]
k4 = 5 sec
-1
rate constant for dephosphorylation of phos-
phorylase kinase [assumed]
k5 = 20 sec
-1
rate constant for phosphorylation of Phos-
phorylase [42]
k6 = 5 sec
-1
rate constant for dephosphorylation of Phos-
phorylase [49]
k7 = 20 sec
-1
rate constant for phosphorylation of glyco-
gen synthase [assumed]
k8 = 0.05 sec
-1
rate constant for dephosphorylation of gly-
cogen synthase [assumed]
Michaelis-Menten constants
Km1 = 5
µ
M for inhibitor phosphorylation [48]
Km2 = 0.7
µ
M for dephosphorylation of Inhibitor [52]
Km3 = 0.4
µ
M for Phosphorylation of phosphorylase
kinase [assumed]
Km4 = 1.1
µ
M for dephosphorylation of phosphorylase
kinase [52]
Km5 = 10
µ
M for phosphorylation of phosphorylase [25]
Km6 = 5
µ
M for dephosphorylation of phosphorylase
[47]
Km7 = 15
µ
M for phosphorylation of glycogen synthase
[assumed]
Km8 = 0.12
µ
M for dephosphorylation of glycogen syn-
thase [50]
Kd = 0.002 dissociation of PP1 and phosphorylated PP1
Inhibitor, and also phosphorylase a with synthase PP1
[47]
Total Concentrations
capkt = 0.25
µ
M total R2C2 ie. cAMP dependent protein
kinase, CAPK [3]
It = 1.8
µ
M total Inhibitor concentration [3]
kt = 2.5
µ
M total Phosphorylase kinase [35]
pt = 70
µ
M total Glycogen Phosphorylase [3]
st = 3
µ
M total Glycogen synthase [3]
PP1 = 0.25
µ
M PTPase 1 [33]
PP2A = 0.025
µ
M PTPase 2 [3]
Other parameters: (chosen as per various qualitative observations
are in physiological ranges as given in
[3,9,12,17,25,27,29,33,35,42,46-54])
k11 = 0.043
µ
M Dissociation constant of cAMP [35]
k22 = 0.7
µ
M Dissociation constant of cAMP [35]
ki = 100
µ
M cAMP inhibition constant
campt = 10
µ
M maximum cAMP [3]
kg = 349500
µ
M activation constant of glucose-6-phos-
phate for synthase PP1
g6pt = 700
µ
M maximum glucose-6-Phosphate [33]
kgi = 10000
µ
M activation constant of glucose for phos-
phorylase phosphatase
s1 = 100 a multiplicative factor for glucose-6-phosphate
effect on glycogen synthase dephosphorylation
kg2 = 500
µ
M inhibition due to glucose-6-phosphate =
0.05 mM
s2 = 0.0010 a multiplicative factor for glucose effect on
phosphorylase phosphatase
Sensitivity analysis
The above parameter set was used for simulating the dose-
response curves of the glycogen cascade system. To assess
the sensitivity to variation in individual parameters, each
parameter was varied over a 10-fold change while holding
all other parameters constant. The response sensitivity is
quantified using a Hill coefficient and is given in Table 1.
The results indicate that at different parameter sets, the
output responses of GP and GS are switch-like and display
different degrees of signal amplification.
Acknowledgements
KVV acknowledges financial support from the Swarnajayanti fellowship,
Department of Science and Technology, India.
Theoretical Biology and Medical Modelling 2005, 2:19 />Page 17 of 18
(page number not for citation purposes)
References
1. Chock PB, Rhee SG, Stadtman ER: Interconvertible enzyme cas-
cades in cellular regulation. Ann Rev Biochem 1980, 49:813-843.
2. Koshland DE Jr, Goldbeter A, Stock JB: Amplification and adapta-
tion in regulatory and sensory systems. Science 1982,
217:220-225.
3. Cohen P: Control of Enzyme activity Chapman and Hall, London;
1983:42-71.
4. Roach P: Glycogen and its metabolism. Curr Mol Med 2002,
2:101-20.
5. Cohen P: Hormonal control of muscle glycogen metabolism.
Curr Top Cell Regul 1978, 14:117-196.
6. Voet D, Voet JG, Pratt CW: Fundamentals of Biochemistry John Wiley
and Sons, New York; 1999:426-465.
7. Mvumbi L, Dopere F, Stalmans W: The inhibitory effect of phos-
phorylase a on the activation of glycogen synthase depends
on the type of synthase phosphatase. Biochem J 1983,
212:407-416.
8. Alemany S, Cohen P: Phosphorylase-a is an allosteric inhibition
of glycogen and microsomal forms of rat hepatic protein
phosphatase-1. FEBS Lett 1986, 198:194-202.
9. Roach PJ: Glycogen synthase and glycogen synthase kinases.
Curr Top Cell Regul 1981, 20:45-105.
10. Hers HG: The control of glycogen metabolism in the liver.
Ann Rev Biochem 1976, 45:167-189.
11. Jiang G, Zhang BB: Glucagon and regulation of glucose
metabolism. Am J Physiol Endocrinol Metab 2003, 284:E671-E678.
12. Bollen M, Keppens S, Stalmans W: Specific features of glycogen
metabolism in the liver. Biochem J 1998, 336:19-31.
13. Chock PB, Stadtman ER: Superiority of interconvertible enzyme
cascade in metabolic regulation: Analysis of multicyclic
systems. Proc Natl Acad Sci USA 1977, 74:2766-2770.
14. Goldbeter A, Koshland DE Jr: An amplified sensitivity arising
from covalent modification in biological systems. Proc Natl
Acad Sci USA 1981, 78:6840-6844.
15. Goldbeter A, Koshland DE Jr: Ultrasensitivity in biochemical
systems controlled by covalent modification. Interplay
between zero-order and multistep effects. J Biol Chem 1984,
259:14441-14447.
16. LaPorte DC, Koshland DE Jr: Phosphorylation of isocitrate
dehydrogenase as a demonstration of enhanced sensitivity in
covalent modification. Nature 1983, 305:286-290.
17. Shacter E, Chock PB, Stadtman ER: Regulation through phospho-
rylation / dephosphorylation cascade systems. J Biol Chem
1984, 259:12252-12259.
18. Cardenas ML, Cornish-Bowden A: Characteristics necessary for
an interconvertible enzyme cascade to generate a highly
sensitive response to an effector. Biochem J 1989, 257:339-345.
19. Small R, Fell DA: Covalent modification and metabolic control
analysis: modification to the theorems and their application
to metabolic systems containing covalently modified
enzymes. Eur J Biochem 1990, 191:405-411.
20. Ferrell JE Jr: Tripping the switch fantastic: how a protein
kinase cascade can convert graded inputs into switch-like
outputs. Trends Biochem Sci 1996, 21:460-466.
21. Ferrell JE Jr, Machleder EM: The biochemical bases of an all-or-
none cell fate switch in Xenopus Oocytes. Science 1998,
280:895-898.
22. Mutalik VK, Shah P, Venkatesh KV: Allosteric interactions and
bifunctionality make the response of glutamine synthetase
cascade system of Escherichia coli robust and ultrasensitive.
J Biol Chem 2003, 278:26327-26332.
23. Mutalik VK, Singh AP, Edwards JS, Venkatesh KV: Robust global
sensitivity in multiple enzyme cascade system explains how
the downstream cascade structure may remain unaffected
by cross-talk. FEBS Lett 2004, 558:79-84.
24. Meinke MH, Bishop JS, Edstrom RD: Zero-order ultrasensitivity
in the regulation of glycogen phosphorylase. Proc Natl Acad Sci
USA 1986, 83:2865-2868.
25. Meinke MH, Edstrom RD: Muscle glycogenolysis. Regulation of
the cyclic interconversion of phosphorylase-a and
phosphorylase-b. J Biol Chem 1991, 266:2259-2266.
26. Cardenas ML, Goldbeter A: The glucose-induced switch
between glycogen phosphorylase and glycogen synthase in
the liver: outlines of a theoretical approach. J Theor Biol 1996,
182:421-426.
27. Shacter E, Stadtman ER, Jurgensen ST, Chock PB: Role of cAMP in
cyclic cascade regulation. Methods Enzymol 1988, 159:3-27.
28. Hurd SS, Teller D, Fischer EH: Probable formation of partially
phosphorylated intermediates in the interconversions of
phosphorylase a and b. Biochem Biophys Res Commun 1966,
24:79-84.
29. Krebs EG, Love DS, Bratvold GE, Trayser KA, Meyer WL, Fischer EH:
Purification and properties of rabbit skeletal muscle phos-
phorylase b kinase. Biochemistry 1964, 3:1022-1033.
30. Tu J-U, Graves DJ: Inhibition of the phosphorylase kinase cata-
lyzed reaction by glucose-6-P. Biochem Biophys Res Commun 1973,
53:59-65.
31. Carabaza A, Ciudad CJ, Baque S, Guinovart JJ: Glucose has to be
phosphorylated to activate glycogen synthase, but not to
inactivate glycogen phosphorylase in hepatocytes. FEBS Lett
1992, 296:211-214.
32. Cadefau J, Bollen M, Stalmans W: Glucose-induced glycogenesis
in the liver involves the glucose-6-phosphate-dependent
dephosphorylation of glycogen synthase. Biochem J 1997,
322:745-750.
33. Aiston S, Andersen B, Agius L: Glucose-6-phosphate regulates
hepatic glycogenolysis through inactivation of
phosphorylase. Diabetes 2003, 52:1333-1339.
34. Mutalik VK, Singh AP, Edwards JS, Venkatesh KV: Equilibrium anal-
ysis of allosteric interactions shows zero order effects. Cell
Biochem Biophys 2004, 41:179-192.
35. Beavo JA, Bechtel PJ, Krebs EG: Activation of protein kinase by
physiological concentration of cyclic AMP. Proc Natl Acad Sci
USA 1974, 71:3580-3583.
36. Aiston S, Hampson L, Gomez-Foix AM, Guinovart JJ, Agius L:
Hepatic glycogen synthesis is highly sensitive to phosphory-
lase activity: Evidence from metabolic control analysis. J Biol
Chem 2001, 276:23858-23866.
37. Stalmans W, Wulf HD, Hue L, Hers HG: Sequential inactivation
of glycogen phosphorylase activation of glycogen synthetase
in liver after the administration of glucose to mice and rats:
Mechanism of the hepatic threshold to glucose. Eur J Biochem
1974, 41:127-134.
38. Massillon D, Bollen M, Wulf HD, Overloop K, Vanstapel F, Hecke PV,
Stalmans W: Demonstration of a glycogen/glucose-1-phos-
phate cycle in hepatocytes from fasted rats. J Biol Chem 1995,
270:19351-19356.
39. Mvumbi L, Stalmans W: High-affinity binding of glycogen-syn-
thase phosphatase to glycogen particles in liver. Biochem J
1987, 246:367-374.
40. Hallenbeck PC, Walsh DA: Control of phosphorylase kinase in
the isolated glycogen particle by Ca
2+
-Mg
2+
synergistic acti-
vation and cAMP-dependent phosphorylation. J Biol Chem
1986, 261:5442-5449.
41. Bowness JM: Epinephrine: cascade reaction and glycogenolytic
effect. Science 1966, 152:1370-1371.
42. Shacter E, Chock PB, Stadtman ER: Energy consumption in a
cyclic phosphorylation/dephosphorylation cascade. J Biol
Chem 1984, 259:12260-12264.
43. Goldbeter A, Koshland DE Jr: Energy expenditure in the control
of biochemical systems by covalent modification. J Biol Chem
1987, 262:4460-4471.
44. Yang L, MacLellan WR, Han Z, Weiss JN, Qu Z: Multisite phospho-
rylation and network dynamics of cyclin-dependent kinase
signaling in the eukaryotic cell cycle. Biophys J 2004,
86:3432-3443.
45. Markevich NI, Hoek JB, Kholodenko BN: Signaling switches and
bistability arising from multisite phosphorylation in protein
kinase cascades. J Cell Biol 2004, 164:353-359.
46. Foulkes G, Cohen P: The hormonal control of glycogen metab-
olism: phosphorylation of protein phosphatase inhibitor-1 in
vivo in response to adrenaline. Eur J Biochem 1979, 97:251-256.
47. Foulkes G, Strada SJ, Henderson PJF, Cohen P: A kinetic analysis of
the effects of inhibitor-1 and inhibitor-2 on the activity of
protein phosphatase-1. Eur J Biochem 1983, 132:309-313.
48. Hemmings HC, Nairn AC, Greengard P: DARPP-32, a dopamine
and adenosine 3':5'-monophosphate regulated neuronal
phosphoprotein: II comparison of the kinetics of phosphor-
ylation of DARPP-32 and phosphatase inhibitor-1. J Biol Chem
1984, 259:14491-14497.
Publish with Bio Med Central and every
scientist can read your work free of charge
"BioMed Central will be the most significant development for
disseminating the results of biomedical research in our lifetime."
Sir Paul Nurse, Cancer Research UK
Your research papers will be:
available free of charge to the entire biomedical community
peer reviewed and published immediately upon acceptance
cited in PubMed and archived on PubMed Central
yours — you keep the copyright
Submit your manuscript here:
/>BioMedcentral
Theoretical Biology and Medical Modelling 2005, 2:19 />Page 18 of 18
(page number not for citation purposes)
49. Ingebritsen TS, Stewart AA, Cohen P: The protein phosphatases
involved in cellular regulation: 6. Measurement of Type-1
and Type-2 protein phosphatases in extracts of mammalian
tissues; An assessment of their physiological roles. Eur J
Biochem 1983, 132:297-307.
50. Killilea SD, Brandt H, Lee EYC, Whelan WJ: Evidence for the coor-
dinate control of activity of liver glycogen synthase and phos-
phorylase by a single protein phosphatases. J Biol Chem 1976,
251:2363-2368.
51. Martensen TM, Brotherton JE, Graves DJ: Kinetic studies of the
activation of muscle phosphorylase phosphatase. J Biol Chem
1973, 248:8329-8336.
52. Nimmo GA, Cohen P: The regulation of glycogen metabolism.
Phosphorylation of inhibitor-1 from rabbit skeletal muscle,
and its interaction with protein phosphatases-III and -II. Eur
J Biochem 1978, 87:353-365.
53. Nimmo GA, Cohen P: The regulation of glycogen metabolism:
purification and characterization of protein phosphatase
inhibitor-1 from rabbit skeletal muscle. Eur J Biochem 1978,
87:341-351.
54. Soderling T, Srivastava AK, Bass MA, Khatra BS: Phosphorylation
and inactivation of glycogen synthase by phosphorylase
kinase. Proc Natl Acad Sci USA 1979, 76:2536-2540.