Báo cáo y học: "Analysis of variation of amplitudes in cell cycle gene expression" potx
Bạn đang xem bản rút gọn của tài liệu. Xem và tải ngay bản đầy đủ của tài liệu tại đây (485.53 KB, 8 trang )
BioMed Central
Page 1 of 8
(page number not for citation purposes)
Theoretical Biology and Medical
Modelling
Open Access
Research
Analysis of variation of amplitudes in cell cycle gene expression
Delong Liu*
1,2
, Kevin W Gaido
1
and Russ Wolfinger
2
Address:
1
CIIT Ceters for Health Research, 6 Davis Drive, Research Triangle Park, NC 27709, USA and
2
The SAS Institute Inc., SAS Campus Drive,
Cary, NC 27513, USA
Email: Delong Liu* - ; Kevin W Gaido - ; Russ Wolfinger -
* Corresponding author
Abstract
Background: Variation in gene expression among cells in a population is often considered as noise
produced from gene transcription and post-transcription processes and experimental artifacts.
Most studies on noise in gene expression have emphasized a few well-characterized genes and
proteins. We investigated whether different cell-arresting methods have impacts on the maximum
expression levels (amplitudes) of a cell cycle related gene.
Results: By introducing random noise, modeled by a von Mises distribution, to the phase angle in
a sinusoidal model in a cell population, we derived a relationship between amplitude and the
distribution of noise in maximum transcription time (phase). We applied our analysis to Whitfield's
HeLa cell cycle data. Our analysis suggests that among 47 cell cycle related genes common to the
2
nd
experiment (thymidine-thymidine method) and the 4
th
experiment (thymidine-nocodazole
method): (i) the amplitudes of CDC6 and PCNA, which are expressed during G1/S phase, are
smaller in the 2
nd
experiment than in the 4
th
, while the amplitude of CDC20, which is expressed
during G2/M phase, is smaller in the 4
th
experiment; and (ii) the two cell-arresting methods had little
impact on the amplitudes of the other 43 genes in the 2
nd
and 4
th
experiments.
Conclusion: Our analysis suggests that procedures that arrest cells in different stages of the cell
cycle differentially affect expression of some cell cycle related genes once the cells are released
from arrest. The impact of the cell-arresting method on expression of a cell cycle related gene can
be quantitatively estimated from the ratio of two estimated amplitudes in two experiments. The
ratio can be used to gauge the variation in the phase/peak expression time distribution involved in
stochastic transcription and post-transcriptional processes for the gene. Further investigations are
needed using normal, unperturbed and synchronized HeLa cells as a reference to compare how
many cell cycle related genes are directly and indirectly affected by various cell-arresting methods.
Introduction
Variation in gene expression is often considered as noise
or uncertainty arising from experimental artifacts and bio-
logical variability. Various studies of noise in gene expres-
sion have focused on different scales, ranging from a
single gene [1] to a single cell [2,3] to a cell population [4-
9]. These studies have greatly helped us understand the
effects of stochastic noise in gene expression and gene reg-
ulation in various model organisms. In a similar spirit, we
were interested in the effects of different cell-arresting
methods on the maximum expression levels (amplitudes)
of some cell cycle related genes.
Published: 11 November 2005
Theoretical Biology and Medical Modelling 2005, 2:46 doi:10.1186/1742-4682-2-46
Received: 31 August 2005
Accepted: 11 November 2005
This article is available from: />© 2005 Liu et al; licensee BioMed Central Ltd.
This is an Open Access article distributed under the terms of the Creative Commons Attribution License ( />),
which permits unrestricted use, distribution, and reproduction in any medium, provided the original work is properly cited.
Theoretical Biology and Medical Modelling 2005, 2:46 />Page 2 of 8
(page number not for citation purposes)
Various methods such as chemical induction and temper-
ature shift have been used to arrest cells in genome-wide
cell cycle studies [10-13]. Each method may have direct or
indirect impacts on the synthesis or degradation of
mRNAs from some genes after the interrupted cell cycle
resumes. For example Whitfield et al. [11] used thymi-
dine-thymidine (thy-thy) to arrest HeLa cells in G1/S
phase and thymidine-nocodazole (thy-noc) to arrest
them in G2/M phase. Intuitively, the synthesis or degrada-
tion of some mRNAs in G1/S phase and G2/M may be dif-
ferentially affected by thy-thy and thy-noc arrests,
respectively.
Measurements of the intensities of gene expression from
microarray experiments are subject to two main sources of
variation: (i) technical variability including bioassay prep-
aration, dye-effect and hybridization on chips, (ii) and
biological variability including variation in activation of
transcription from cell to cell in a population after release
from cell cycle arrest. Another implicit feature of micro-
array data is that gene expression is an average value over
a cell population rather than in a single cell. In general, it
is difficult to separate these two sources of variation for
expression of a gene under given experimental conditions
unless multiple repeated measurements are made over
time and some prior knowledge of the expression of this
gene is available. Periodic expression of some genes may
be a good model for examining the effects of various cell-
arresting methods on the transcription of known genes
during cell cycle experiments.
Some advantages of using cell cycle related gene expres-
sion to probe the variation in maximum expression level
due to different cell-arresting methods are: (i) cells can be
synchronized to some extent so that variation of expres-
sion from cell to cell can be reduced; (ii) the expression
profiles of some known cell cycle related genes such as
PCNA and CDC20 (Figures 1 and 2) have been well char-
acterized as sinusoidal waveforms over multiple cycles in
different model organisms [10-13]. This makes it rela-
tively easy to distinguish biological variation from techni-
cal variation, which produces random or transient
fluctuations around a sinusoidal profile over time.
Amplitude, period and phase angle define the dynamics
of a sinusoidal profile. In cell cycle or circadian rhythm
studies, the phase angle, or time of maximum expression
of a cycling gene, has been a primary focus because it
reflects the gene's biological role [10-15]. However, the
biological implications of amplitudes of cycling genes,
referred to as the maximum expression level in one cycle,
have not been explored in any previous microarray study
of cell cycle or circadian cycle gene expression [10-15].
This might be due to the impression that gene expression
from high-throughput data is noisy and therefore not reli-
able. Alternatively, it may be because no control (refer-
ence) mRNA was used across the experiments. When the
expression of a cycling gene is measured across multiple
time points in cell cycle modeled by a sinusoidal profile,
its amplitude can be estimated with reasonable accuracy
[16]. When a common reference mRNA is used in cell
cycle experiments [11], the estimated amplitudes of the
same cycling genes should be comparable across experi-
ments. In addition to phases, changes in amplitude may
reveal effects of cell-arrest methods on the expression of
some cell cycle related genes.
In a single cell, the amplitude and phase of a cell cycle
related gene are considered two independent parameters
in a sinusoidal model. Within a cell population, however,
variation in amplitude may be dependent on variation in
phase angle for some genes of this kind when the cells are
stressed at different stages of the cycle. The linking of
amplitude to phase variability is similar to Winfree's sug-
gestion about the connection: "Thirty-four years later the
situation is beginning to change. It is at least widely recog-
nized now that 'phase' is just one aspect of the circadian
clock's 'state,' needing supplementation by at least 'ampli-
tude' (possibly a measure of cell-population phase scat-
ter) before experiments can be designed and interpreted
with confidence" [17].
In this paper, we first illustrate how variation in amplitude
depends on the distribution of phase angles of a cell cycle
related gene in a cell population. We then analyze the
effects of two different cell-arresting methods on some
Log
2
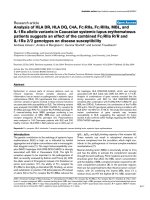
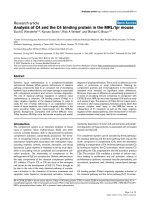
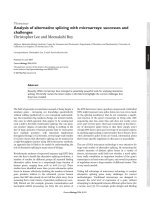
expression ratio for PCNA, a known G1/S phase gene, in thymidine-thymidine (exp2) arrest and thymidine-nocodazole arrest (exp4) studiesFigure 1
Log
2
expression ratio for PCNA, a known G1/S phase gene, in
thymidine-thymidine (exp2) arrest and thymidine-nocodazole
arrest (exp4) studies. The solid line ('__') is the fit, which is
estimated from the random-periods model (1), to the data
('o') from Whitfield et al. (2002).
Theoretical Biology and Medical Modelling 2005, 2:46 />Page 3 of 8
(page number not for citation purposes)
known cell cycle related genes expressed in G1/S and G2/
M phases, using public cell cycle gene expression datasets.
Methodologies
Three parameters are commonly used for modeling the
time-course of expression, y
g
(t), of a cell cycle related gene
g over time t: amplitude, which we denote as K
g
; duration
of cycle (period), T; and phase angle,
φ
g
, which is the time
in the cycle when the gene is maximally activated; i.e. y
g
(t)
= f(t; K
g
, T,
φ
g
). In our previous cell cycle related gene
expression studies [16], we introduced a variance param-
eter
σ
to y
g
(t) for modeling attenuation of the amplitude
of gene g over time, leading to the following random-peri-
ods model (RPM):
where the integral averages the expression level across
cells and z is assumed to be distributed as standard Gaus-
sian. The linear terms, a
g
and b
g
, give the background gene
expression. This model approximated the pattern of
cycling, with its attenuation across time, when it was
applied to a set of known cell cycle related genes [16].
Here, we introduce random noise,
ε
, to the phase of gene
expression in a cell population into model (1). The expec-
tation, E[ ], of the periodic term, which we call c
g
(t) in (1)
for gene g, is
where
ε
is von Mises distributed with concentration
parameter
κ
and mean direction 0, and z is, as before, nor-
mally distributed with mean 0 and variance 1. K
gmax
is the
amplitude when
ε
= 0, i.e. no variation in phase/peak
expression time for gene g in a population of perfectly syn-
chronized cells. The expectation of c
g
(t) in (2),
E<Fences>Qc
g
(t)<Fences>N, can be expanded as
If the random variables z and
ε
are independent, we
obtain the simplified expression
Since for the random variable
ε
with a
von Mises distribution, we obtain
Therefore, the amplitude K
g
in model (1) is the product of
two terms, K
g max
and E[cos(
ε
)] in (3). E[cos(
ε
)] can be
considered a measure of the variability in phase across
cells in a given experiment. When the duration of the cell
cycle is highly variable, as when
σ
is large in model (1),
one might expect a corresponding attenuation of the
amplitude over time.
Since it is difficult to estimate both the amplitude K
g max
and the term E[cos(
ε
)] directly from (3), we propose
instead to compare the amplitude parameters in two inde-
pendent experiments under the same protocol for g gene,
by taking the ratio
yt a bt
K
t
Tz
zdz
ggg
g
g
() cos
exp( )
exp( / ) ,=++ +
−
−∞
+∞
∫
2
2
2
2
π
π
σ
φ
11
()
Ec t E K
t
Tz
g
z
gg
() cos
exp( )
,
,
max
=++
()
ε
π
σ
φε
2
2
Ec t E K
t
Tz
K
g
z
ggg
() cos
exp( )
cos sin
,
max max
=+
()
−
ε
π
σ
φε
2 22
2
π
σ
φε
π
ε
t
Tz
EK
t
T
g
z
g
exp
sin
cos
exp(
,
max
()
+
()
=
σσ
φε
π
σ
φ
ε
z
EK
t
Tz
g
z
gg
)
cos sin
exp
,
max
+
()
−
()
+
2
()
sin .
ε
Ec t E
t
Tz
EK
g
z
gg
() cos
exp( )
cos
max
=+
()
2
π
σ
φε
ε
−
()
+
()
E
t
Tz
EK
z
gg
sin
exp
sin .
max
2
π
σ
φε
ε
E
ε
ε
sin
()
= 0
Ec t E
t
Tz
EK
g
z
gg
() cos
exp( )
cos
=+
()
2
π
σ
φε
ε
mmax
.3
()
Ec t
Ec t
EK
E
g
g
g
1
2
11
2
1
2
()
()
cos
cos
max
max
=
()
()
ε
ε
ε
ε
()
K
g2
4,
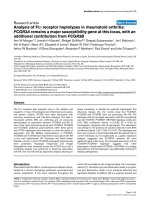
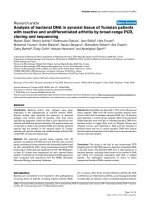
Log
2
expression ratio for CDC20, a known G2/M phase gene, in thymidine-thymidine (exp2) arrest and thymidine-nocoda-zole arrest (exp4) studiesFigure 2
Log
2
expression ratio for CDC20, a known G2/M phase gene,
in thymidine-thymidine (exp2) arrest and thymidine-nocoda-
zole arrest (exp4) studies. The solid line ('__') is the fit, which
is estimated from the random-periods model (1), to the data
('o') from Whitfield et al. (2002).
Theoretical Biology and Medical Modelling 2005, 2:46 />Page 4 of 8
(page number not for citation purposes)
where,
,
κ
g
is the concentration parameter of
ε
with a von Mises dis-
tribution [18], and K
1g
and K
2g
are the maximum expres-
sions of gene g in experiments 1 and 2, respectively, when
the phases or peak expression times for g in a cell popula-
tion are perfectly synchronized. We have 0 ≤ E(cos(
ε
)) ≤ 1
as the concentration parameter
κ
g
→ ∞, the variance goes
to 0 and E[cos(
ε
)] = 1; and as
κ
g
= 0, E[cos(
ε
)] = 0.
Provided that K
1g
= K
2g
, we reduce the ratio in (4) to
Equation (5) implies that the ratio between the amplitude
parameters of periodic expression of gene g in experi-
ments 1 and 2 can be represented by the ratio of the mean
noise variation, which has von Mises distributions in both
experiments. When
κ
1
>
κ
2
, E[c
1g
(t)]
max
>E[c
2g
(t)]
max
. In
biological terms, the concentration parameter,
κ
, reflects
the distribution of phases or peak expression times for a
gene within a cell population. Therefore, we can use the
ratio of estimated amplitudes from RPM (1) to examine
the relative variability in phase/peak expression time for
gene g in two cell cycle experiments.
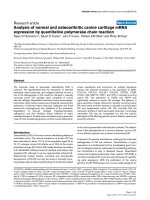
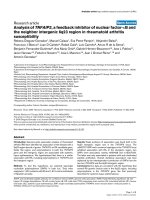
To get a sense of how the ratios of estimated amplitude in
(5) vary with
κ
, we calculated numerical values of
E[cos(
ε
)] for the random variable
ε
with
µ
and
κ
= 1, 2, 3,
, 20, and plotted
κ
vs. E[cos(
ε
)] in Figure 3. For
κ
= 1, 2,
3, 4, 5, E[cos(
ε
)] = 0.33, 0.57, 0.71, 0.79, 0.84, respec-
tively. For example, for
κ
= 2 and 5, the ratio in (5) is 0.57/
0.84 = 0.68. Note that E[cos(
ε
)] increases sharply and
monotonically from
κ
= 1 to
κ
= 5. Figure 3 suggests that,
for a cycling gene in two experiments with relatively large
differences in amplitude, the concentration parameters
κ
in the experiment with small estimated amplitude are rel-
atively small and most likely to be in the range 1 ≤
κ
≤ 5.
Although we have no direct knowledge of the true value of
κ
for a cycling gene in any experiment, we can still use Fig-
ure 3 to interpret the variation in transcription of a given
gene within a cell population in multiple experiments. For
example, within a HeLa cell cycle period of 15 h, phases
in the interval (-0.65, 0.65) radians, or peak gene expres-
sion times in the interval (-1.5, 1.5) h, are within 95%
coverage of the von Mises distribution with concentration
parameter
κ
= 10.
In the following two sections, we apply the concepts pre-
sented above to the variation in amplitude of a set of
cycling genes common to two experiments, using the cell
cycle gene expression data of Whitfield et al. [11]. Here,
we are primarily interested in assessing the variability of
amplitudes of cell cycle related genes commonly
expressed in two experiments where cells were arrested by
two different methods, and in identifying genes of which
the amplitudes K
g
do change in two experiments if there is
no systematic variation between any pair of experiments.
Testing equality of amplitudes of a set of cycling
gene in two experiments
Let and denote the estimated amplitude and the
variance of the amplitude for the g
th
gene in the j
th
experi-
ment, g = 1, , n, where n is the number of genes and j =
x, y. is estimated from the random-periods model in
(1), and from Wald's sandwich estimator within the
random-periods model (1). Prior to testing the equality of
amplitude of a cycling gene in two experiments, we need
to check whether there is a systematic variation in ampli-
tude, which might be created during sample hybridiza-
tion. For a set of n genes between two experiments, x and
y, we take the difference
and use the Wilcoxon signed rank test to test the null
hypothesis: median ∆ = 0. If the null hypothesis is
rejected, we suspect that there may exist a systematic dif-
ference between and in experiments x and y. If we
fail to reject the null, there may be no true difference, or
the statistical test lacked sufficient power to detect a true
difference (which is small compared to the estimated
noise in the experiment). In this situation we explore the
results further to identify how many and may be
equal for g = 1, , n by checking whether zero is included
in the confidence interval
at the level of
α
, where and are the estimated var-
iances of and . If , transcription of the
gene g might not differ between the two experiments.
Example
In our previous work [19], we studied the phase associa-
tion of 47 cell cycle related genes common to the 2
nd
, 3
rd
and 4
th
experiments of Whitfield et al. [11]. In the present
study, we use the same 47 genes commonly expressed in
the 2
nd
and 4
th
experiments with 26 and 19 time points
per gene, respectively. The amplitude, period, geometric
E
I
d
g
g
cos
()
cos exp cos
ε
πκ
τκττ
π
π
()
=
() ()
()
−
+
∫
1
2
0
Ec t
Ec t
E
E
g
g
1
2
1
2
1
2
()
()
cos
cos
.
max
max
=
()
()
ε
ε
ε
ε
55
()
ˆ
K
gj
ˆ
σ
gj
2
ˆ
K
gj
ˆ
σ
gj
2
ˆ
log
ˆ
log
ˆ
,∆
ggxgy
KK=−
()
22
6
ˆ
K
x
ˆ
K
y
ˆ
K
gx
ˆ
K
gy
()
/
KK z
gx gy gx gy
−± +
α
σσ
2
22
ˆ
σ
gx
2
ˆ
σ
gy
2
ˆ
K
gx
ˆ
K
gy
ˆˆ
KK
gx gy
≠
Theoretical Biology and Medical Modelling 2005, 2:46 />Page 5 of 8
(page number not for citation purposes)
standard deviation, phase angle and two parameters
describing the linear background, denoted respectively by
( ), were estimated for each expression
time-course experiment using the random-periods model
(1) on log
2
transformed data. The assumptions underlying
the model appear reasonable for these data, although our
conclusions are somewhat limited given the small sample
size. Owing to the systematically smaller amplitudes of
the 47 cell cycle related genes in the 3
rd
experiment of
Whitfield et al. [11], which were identified by the Wil-
coxon signed rank test of (6), we excluded the 3
rd
experi-
ment from our comparison of amplitudes in this study.
The estimated amplitudes s, and the variances of the
s, g = 1, , 47, in the 2
nd
and 4
th
experiments are listed
in Table 1.
Results
The p-value from the Wilcoxon signed rank test on the
median ∆ = 0 in (6) at the level of
α
= 0.05 is 0.56, sug-
gesting that the median amplitudes in exp2 and exp4 are
similar. Therefore, we can directly compare the estimated
amplitudes for each of the 47 genes in the two experi-
ments. The log
2
ratios of amplitudes in exp4 over exp2 are
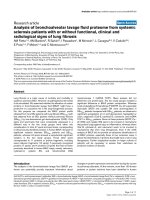
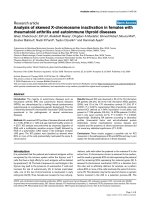
plotted in Figure 4. By comparing the amplitudes of the
47 cycling transcripts in these two experiments, we found
that the 95% confidence intervals (z
α
/2
= 1.96,
σ
= 0.05)
for the genes FLJ10540, PCNA, CDC6 and CDC20 did not
include zero, suggesting that the estimated amplitudes for
these four genes in exp2 and exp4 of Whitfield et al. [11]
might be affected by thy-thy arrest in exp2 and thy-noc
arrest in exp4. This was not true of the estimated ampli-
tudes of the other 43 genes (Table 1). Note that the ampli-
tudes of CDC6 and PCNA, which are expressed in the G1/
S phase, were reduced almost to half in the thy-thy (S
phase arrest) experiment relative to thy-noc (M phase
arrest) experiment; the amplitude of CDC20, which is
expressed in the G2/M phase, was reduced in the thy-noc
experiment to half that in the thy-thy experiment.
Discussion
In this paper, we have analyzed the effect of the scattering
of phase angles of a cell cycle related gene in a cell popu-
lation on the amplitude of expression of this gene. Our
analysis suggests that variation in amplitude for such a
gene between two experiments depends on the variation
of phase distribution in a population of cells. We illus-
trated our analysis by comparing the amplitudes of 47 cell
cycle related genes in the 2
nd
and 4
th
experiments of Whit-
field et al. [11], where two different methods were used
that resulted in cells being arrested at different stages of
the cycle. The amplitudes of 43 of the 47 genes were not
significantly affected by the differences in cell-arresting
methods. Among the 4 genes that were differentially
affected, the amplitudes of the G1/S phase genes CDC 6
and PCNA were smaller in the thy-thy (S phase arrest)
experiment 2, while the amplitude of G2/M gene CDC20
was smaller in the thy-noc (M phase arrest) experiment 4
of Whitfield et al. [11]. These results suggest that thy-thy
and thy-noc affected the maximum expression levels of
some G1/S and G2/M phase genes differentially. It
appears plausible that the thy-thy arresting method might
completely prevent expression of some G1/S phase genes.
Some of these genes could be recovered from the gene list
of the 4
th
experiment using the thy-noc method.
Our results suggest that thy-thy interrupts PCNA and
CDC6 mRNA synthesis in S phase arrest, and thy-noc
interrupts CDC20 and FLJ10540 mRNA synthesis in G2/
M arrest. After the cells are released, synthesis of the
mRNAs for some affected genes resumes but with large
variation in pace across cells. In other words, the phase
distributions of PCNA and CDC6 in the cell population of
exp2 are more spread out during the G1/S phase; and the
phase distributions of FLJ10540 and CDC20 in the cell
population of exp4 are more spread out in the G2/M
phase. For example, the ratio between the two amplitudes
of CDC20 in exp4 vs. exp2 is about 0.5. According to the
ratio defined in (5), we could infer that the upper bound
for the concentration parameter of von Mises for
CDC20 in exp4 is less than 2.5, provided the for
CDC20 in exp2 is very large, e.g. >20. The significant dif-
ference between the two distributions with = 2 and 10
is illustrated graphically in Figure A in the Appendix.
ˆˆ
,
ˆ
,
ˆ
,
ˆ
,
ˆ
,
KT a b
gggg
σφ
ˆ
K
g
ˆ
K
g
ˆ
K
g
ˆ
K
g
ˆ
K
g
Plot of concentration parameter
κ
vs. expectation of cos(
ε
), where
ε
is von Mises distributed with zero mean direction and concentration
κ
, i.e.,
ε
~ VM(
κ
,0)Figure 3
Plot of concentration parameter
κ
vs. expectation of cos(
ε
),
where
ε
is von Mises distributed with zero mean direction
and concentration
κ
, i.e.,
ε
~ VM(
κ
,0).
Theoretical Biology and Medical Modelling 2005, 2:46 />Page 6 of 8
(page number not for citation purposes)
Our results show that some cell cycle related genes may be
more responsive or sensitive than others to changes in the
environment, e.g. cell-arresting chemicals, temperature
shift, etc. Raser and O'Shea [8] suggested that noise intrin-
sic to eukaryotic gene expression is gene-specific, and Fra-
ser et al. [9] suggested that the production of essential and
complex-forming proteins involves lower levels of noise
than does the production of most other genes. Our find-
ings indicate that the 43 cell cycle related genes with unal-
tered amplitudes in exp2 and exp4 of Whitfield et al. [11]
may be essential to the HeLa cell cycle, and thus less sen-
sitive to perturbation by stress or chemicals. However,
Table 1: Estimated amplitudes , and variances var( ), var( ) of the amplitudes in the 2
nd
and 4
th
experiments of Whitfield
et al. (2002), respectively.
Assession Gene Symbol K_2 var(K_2) K_4 var(K_4) lower bound upper bound flag
AA088457 0.921 0.026 0.642 0.007 -0.637 0.076 1
AA458994 PMSCL1 0.832 0.018 0.576 0.019 -0.635 0.122 1
AA485454 0.772 0.029 0.743 0.043 -0.554 0.495 1
AA485454 0.772 0.029 0.743 0.043 -0.554 0.495 1
AA282935 MPHOSPH1 0.950 0.030 0.843 0.049 -0.658 0.444 1
N57722 MCM6 0.401 0.013 0.596 0.024 -0.180 0.570 1
AA485454 0.747 0.035 0.743 0.043 -0.551 0.542 1
AA485454 0.747 0.035 0.743 0.043 -0.551 0.542 1
R11407 STK15 1.672 0.049 1.821 0.050 -0.467 0.765 1
T66935 DKFZp762E1312 1.648 0.051 1.319 0.035 -0.903 0.245 1
AA452513 KNSL5 1.162 0.033 1.155 0.062 -0.609 0.595 1
AA157499 MAPK13 1.375 0.045 1.360 0.060 -0.650 0.620 1
AA430092 BUB1 1.083 0.033 1.003 0.085 -0.755 0.593 1
AA053556 MKI67 1.315 0.056 0.790 0.043 -1.144 0.095 1
R96941 C20orf129 1.217 0.076 1.444 0.022 -0.387 0.840 1
AA131908 FLJ10540 0.786 0.016 0.390 0.014 -0.738 -0.053 0
AA279990 TACC3 0.794 0.026 1.023 0.055 -0.329 0.786 1
AA464019 E2-EPF 0.760 0.018 0.987 0.077 -0.378 0.832 1
AA262211 KIAA0008 0.918 0.013 0.688 0.030 -0.635 0.176 1
AI053446 0.964 0.041 0.952 0.050 -0.605 0.581 1
AA620485 ANKT 0.871 0.021 1.150 0.036 -0.192 0.750 1
AA629262 PLK 1.621 0.019 1.510 0.042 -0.597 0.375 1
AA450264 PCNA 0.557 0.008 0.985 0.038 0.007 0.849 0
R06900 RAMP 1.055 0.033 1.322 0.045 -0.280 0.814 1
AA425120 CHAF1B 0.549 0.006 0.552 0.032 -0.378 0.383 1
AA430511 FLJ14642 0.922 0.028 0.859 0.045 -0.592 0.465 1
AA430511 FLJ14642 0.922 0.028 0.786 0.061 -0.721 0.449 1
AA620553 FEN1 0.484 0.010 0.516 0.013 -0.270 0.335 1
AA402431 CENPE 1.468 0.015 1.455 0.082 -0.624 0.599 1
AA608568 CCNA2 1.197 0.016 1.115 0.076 -0.677 0.513 1
W93120 0.584 0.019 1.210 0.091 -0.026 1.278 1
N63744 FLJ10468 1.602 0.021 1.146 0.067 -1.038 0.125 1
R22949 1.055 0.026 0.908 0.045 -0.670 0.377 1
H51719 ORC1L 0.607 0.013 0.469 0.021 -0.500 0.222 1
AA425404 FLJ10156 1.101 0.041 0.841 0.010 -0.702 0.182 1
H59203 CDC6 0.695 0.014 1.060 0.020 0.005 0.724 0
AA292964 CKS2 0.827 0.010 1.516 0.185 -0.177 1.553 1
AA099033 USP1 0.507 0.012 0.750 0.027 -0.145 0.630 1
AA598776 CDC20 1.258 0.017 0.619 0.031 -1.067 -0.212 0
AA676797 CCNF 1.617 0.045 1.141 0.048 -1.072 0.121 1
AA504625 KNSL1 1.222 0.026 0.806 0.033 -0.893 0.062 1
AA235662 FLJ14642 1.041 0.015 0.944 0.041 -0.559 0.365 1
H73329 C20orf1 1.017 0.018 1.255 0.066 -0.330 0.807 1
AA421171 NUF2R 0.982 0.018 1.021 0.049 -0.467 0.546 1
T54121 CCNE1 1.155 0.045 1.144 0.052 -0.623 0.600 1
AA010065 CKS2 0.919 0.006 1.267 0.031 -0.028 0.724 1
Note that the accession numbers and the gene symbols were taken from the dataset of Whitfield et al. (2002). The genes with value 0 in the flag
column indicate that the amplitudes are not same in the 2
nd
and 4
th
experiments.
ˆ
K
2
ˆ
K
4
ˆ
K
2
ˆ
K
4
Theoretical Biology and Medical Modelling 2005, 2:46 />Page 7 of 8
(page number not for citation purposes)
CDC6 and CDC20, which are important to the yeast cell
cycle [20], were expressed at significantly different ampli-
tudes in the HeLa cell cycle. Further studies are needed to
investigate whether some essential cell cycle genes such as
CDC6 and CDC20 are cell type specific in response to
chemicals.
The amplitude, phase angle and period estimated from
(1) for genes from the microarray data are characteristic of
cell populations rather than a single cell. Conventionally,
amplitude and phase angle are considered independent
parameters in a sinusoidal model. However, in microarray
studies, where the measured periodic expression for a cell
cycle related gene is averaged over a cell population (>10
6
cells), a phase change in the concentration of von Mises
distribution for a gene can contribute to a change in
amplitude. Note that our analysis partially addresses Win-
free's concern about whether amplitude should be consid-
ered as additional information to phase in studies of
circadian rhythms [17].
The detection of cell cycle related genes with significantly
different amplitudes between exp2 and exp4 of Whitfield
et al. [11] depends on: (i) approximation of the true dis-
tribution of amplitudes of K
gx
and K
gy
, g = 1, , 47 by a
normal distribution; (ii) the design of exp2 and exp4,
including number of time points per gene. While these
assumptions appear tenable for these data, a more com-
prehensive analysis of other relevant cell cycle gene
expression studies is needed for more definitive conclu-
sions about their validity. The four genes currently identi-
fied all have an estimated 1.5 fold change, and with the
current sample size, the power to detect such a change is
only around 50%. If the number of time points in exp2
and exp4 were larger (e.g. 47 in exp3 of Whitfield et al.
[11]), the power for detecting amplitudes with less than 2-
fold change would be increased.
One often neglected but important factor in interpreting
and analyzing cell cycle related gene expression data is the
quality of synchrony of the cell culture. Currently there are
no quantitative standards for measuring to what extent
cells have been synchronized. The periodic patterns of the
47 genes were measured from stressed or perturbed cells
in the 2
nd
and 4
th
experiments of Whitfield et al. [11].
Gene expression from normal, un-perturbed and synchro-
nized HeLa cells obtained using the technologies pro-
posed by Helmsteteter et al. [21] may serve as references
for comparing the expression of these genes when mRNA
synthesis is interrupted by different cell-arresting meth-
ods, e.g. temperature shift or chemical induction at vari-
ous phases of the cell cycle. Good quality control of cell
synchrony, as suggested in Cooper et al. [22], will provide
a basis for microarray studies of cell cycle related genes.
More quantitative measures of cell culture synchrony, and
investigation of the impacts of cell culture with various
degrees of synchrony on expression of some cell cycle
related genes, are needed in future studies.
Conclusion
The amplitudes of some cell cycle related genes were used
to measure the effects of two different cell-arresting meth-
ods on gene expression. Some genes with periodic expres-
sion patterns can be used as models to probe the effects of
different cell-arresting methods on expression of these
genes, which can be quantitatively described in terms of
amplitude and phase. The ratio between the amplitudes
estimated in two experiments for a cell cycle related gene
can be used to gauge the variation of the phase/peak
expression time distribution involved in stochastic tran-
scriptional and post-transcriptional processes for the gene
in a cell population. Further investigations are needed
using normal, unperturbed and synchronized HeLa cells
as a reference for comparing how many cell cycle related
genes are directly and indirectly affected by various cell-
arresting methods.
Competing interests
The author(s) declare that they have no competing inter-
ests.
Authors' contributions
DL conceived of the study, performed the analysis and
drafted the manuscript. KWG and RW participated in the
draft of the manuscript. All authors read and approved the
final manuscript.
Plot of ratio of the amplitudes of 47 cell cycle transcripts in exp4 vs. exp2 (Whitfield et al., 2002)Figure 4
Plot of ratio of the amplitudes of 47 cell cycle transcripts in
exp4 vs. exp2 (Whitfield et al., 2002).
Publish with BioMed Central and every
scientist can read your work free of charge
"BioMed Central will be the most significant development for
disseminating the results of biomedical research in our lifetime."
Sir Paul Nurse, Cancer Research UK
Your research papers will be:
available free of charge to the entire biomedical community
peer reviewed and published immediately upon acceptance
cited in PubMed and archived on PubMed Central
yours — you keep the copyright
Submit your manuscript here:
/>BioMedcentral
Theoretical Biology and Medical Modelling 2005, 2:46 />Page 8 of 8
(page number not for citation purposes)
Additional material
Acknowledgements
The authors thank two anonymous reviewers for constructive comments;
we thank Stephen Cooper for his thorough and extensive comments on the
manuscript. We also thank the executive editor Dr. Paul Agutter for his
help. DL thanks Grace E. Kissling and Mike Whitfield for providing sugges-
tions on an early version of this manuscript. DL thanks Clare Weinberg for
stimulating discussion in the early stage of this work, Leping Li for his sup-
port, and Shyamal Peddada and David Umback for their encouragement
when DL started this work at the NIEHS/NIH. The authors thank Cecilia
Tan, Jeffery Schroeter and Elena Kleymenova for their comments on the
manuscript.
References
1. Ozbudak EM, Thattai M, Kurtser I, Grossman AD, von Oudenaarden
A: Regulation of noise in the expression of a single gene. Nat Genet
2002, 31:69-73.
2. Elowitz MB, Levine AJ, Siggia ED, Swain PS: Stochastic gene
expression in a single cell. Science 2002, 297:1183-1186.
3. Rosenfeld N, Young JW, Alon U, Swain PS, Elowitz MB: Gene regu-
lation at the single-cell level. Science 2005, 307:1962-1965.
4. McAdams HH, Arkin A: Stochastic mechanisms in gene expres-
sion. Proc Natl Acad Sci USA 1998, 94:814-819.
5. Thattal M, Oudenaarden AV: Intrinsic noise in gene regulatory
networks. Proc Natl Acad Sci USA 2001, 98:8614-8619.
6. Swain P, Elowitz MB, Siggia ED: Intrinsic and extrinsic contribu-
tions to stochasticity in gene expression. Proc Natl Acad Sci USA
2002, 99:12795-12800.
7. Blake WJ, Kaern M, Cantor CR, Collins JJ: Noise in eukaryotic
gene expression. Nature 2003, 422:633-637.
8. Raser J, O'Shea EK: Control of stochasticity in eukaryotic gene
expression. Science 2004, 304:1811-1814.
9. Fraser HB, Hirsh AE, Giaever G, Kumm J, Eisen MB: Noise minimi-
zation in eukaryotic gene expression. PLoS Biol 2004, 2:1-5.
10. Spellman PT, Sherlock G, Zhang MQ, Iyer VR, Anders K, Eisen MB,
Brown PO, Botstein D, Futcher B: Comprehensive identification
of cell cycle-regulated genes of the yeast Sacchromyces cere-
visiae by microarray hybridization. Mol Biol Cell 1998,
9:3273-3297.
11. Whitfield ML, Sherlook G, Saldanha AJ, Murray JI, Ball CA, Alexander
KE, Matese JC, Perou CM, Hurt MM, Brown PO, Botstein D: Identi-
fication of genes periodically expressed in the human cell
cycle and their expression in tumors. Mol Biol Cell 2002,
13:1977-2003.
12. Peng X, Krishna R, Karuturi M, Miller LD, Lin K, Jia Y, Kondu P, Wang
L, Wong L-S, Liu ET, Balasubramanian MK, Liu J: Identification of
cell cycle-regulated genes in fission yeast. Mol Biol Cell 2005,
16:1026-1042.
13. Rustici G, Mata J, Kivinen K, Lio P, Penkett CJ, Burns G, Hayles J,
Brazma A, Nurse P, Bahler J: Periodic gene expression program
of the fission yeast cell cycle. Nature Genet 2004, 36:809-817.
14. Storch KF, Lapan O, Leykin I, Viswannthan N, David FC, Wong WH,
Weitz CJ: Extensive and divergent circadian gene expression
in liver and heart. Nature 2002, 417:78-83.
15. Panda S, Antoch MP, Miller BH, Su AI, Schook AB, Straume M, Schultz
PG, Kay SA, Takahashi JS, Hogenesch JB: Coordinated transcrip-
tion of key pathways in the mouse by the circadian clock. Cell
2002, 109:307-320.
16. Liu D, Umbach DM, Peddada SD, Li L, Crockett PW, Weinberg CR:
A Random-Periods Model for Expression of Cell-Cycle
Genes. Proc Natl Acad Sci USA 2004, 101:7240-7245.
17. Winfree A: The geometry of biological time 2nd edition. New York:
Springer; 2001:228.
18. Mardia KV, Jupp PE: Directional statistics New York: John Wiley & Son;
2000.
19. Liu D, Weinberg C, Peddada SD: A geometric approach to deter-
mine association and coherence of the activation times of
cell-cycling genes under differing experimental conditions.
Bioinformatics 2004, 20:2521-2528.
20. Murray A, Hunt T: The cell cycle: an introduction New York: Oxford
University Press; 1993.
21. Helmstetter CE, Thornton M, Romero A, Eward KL: Synchrony in
human, mouse, and bacterial cell cultures: a comparison. Cell
Cycle 2003, 2:42-45.
22. Cooper S, Tenbroek M, Ljungman M, Bissett P, Tarquini M, Iyer G:
Automated, reproducible, membrane-elution for cell-cycle
analysis: application to cyclin B1 content during the unper-
turbed, normal, eukaryotic cell cycle. in press.
Additional file
The addition file 'Appendix.doc' is inserted here.
Click here for file
[ />4682-2-46-S1.doc]