Báo cáo y học: "A statistical method for predicting splice variants between two groups of samples using GeneChip® expression array data" pps
Bạn đang xem bản rút gọn của tài liệu. Xem và tải ngay bản đầy đủ của tài liệu tại đây (331.82 KB, 9 trang )
BioMed Central
Page 1 of 9
(page number not for citation purposes)
Theoretical Biology and Medical
Modelling
Open Access
Research
A statistical method for predicting splice variants between two
groups of samples using GeneChip
®
expression array data
Wenhong Fan
1
, Najma Khalid
1
, Andrew R Hallahan
2,3
, James M Olson
2
and
Lue Ping Zhao*
1
Address:
1
Division of Public Health Sciences, Fred Hutchinson Cancer Research Center, 1100 Fairview Ave. N., Seattle, WA 98109, USA,
2
Clinical
Research Division, Fred Hutchinson Cancer Research Center, 1100 Fairview Ave. N., Seattle, WA 98109, USA and
3
Department of Paediatrics and
Child Health, University of Queensland, QLD, 4029, Australia
Email: Wenhong Fan - ; Najma Khalid - ; Andrew R Hallahan - ;
James M Olson - ; Lue Ping Zhao* -
* Corresponding author
Abstract
Background: Alternative splicing of pre-messenger RNA results in RNA variants with combinations of
selected exons. It is one of the essential biological functions and regulatory components in higher
eukaryotic cells. Some of these variants are detectable with the Affymetrix GeneChip
®
that uses multiple
oligonucleotide probes (i.e. probe set), since the target sequences for the multiple probes are adjacent
within each gene. Hybridization intensity from a probe correlates with abundance of the corresponding
transcript. Although the multiple-probe feature in the current GeneChip
®
was designed to assess
expression values of individual genes, it also measures transcriptional abundance for a sub-region of a gene
sequence. This additional capacity motivated us to develop a method to predict alternative splicing, taking
advance of extensive repositories of GeneChip
®
gene expression array data.
Results: We developed a two-step approach to predict alternative splicing from GeneChip
®
data. First,
we clustered the probes from a probe set into pseudo-exons based on similarity of probe intensities and
physical adjacency. A pseudo-exon is defined as a sequence in the gene within which multiple probes have
comparable probe intensity values. Second, for each pseudo-exon, we assessed the statistical significance
of the difference in probe intensity between two groups of samples. Differentially expressed pseudo-exons
are predicted to be alternatively spliced. We applied our method to empirical data generated from
GeneChip
®
Hu6800 arrays, which include 7129 probe sets and twenty probes per probe set. The dataset
consists of sixty-nine medulloblastoma (27 metastatic and 42 non-metastatic) samples and four cerebellum
samples as normal controls. We predicted that 577 genes would be alternatively spliced when we
compared normal cerebellum samples to medulloblastomas, and predicted that thirteen genes would be
alternatively spliced when we compared metastatic medulloblastomas to non-metastatic ones. We
checked the consistency of some of our findings with information in UCSC Human Genome Browser.
Conclusion: The two-step approach described in this paper is capable of predicting some alternative
splicing from multiple oligonucleotide-based gene expression array data with GeneChip
®
technology. Our
method employs the extensive repositories of gene expression array data available and generates
alternative splicing hypotheses, which can be further validated by experimental studies.
Published: 07 April 2006
Theoretical Biology and Medical Modelling 2006, 3:19 doi:10.1186/1742-4682-3-19
Received: 23 January 2006
Accepted: 07 April 2006
This article is available from: />© 2006 Fan et al; licensee BioMed Central Ltd.
This is an Open Access article distributed under the terms of the Creative Commons Attribution License ( />),
which permits unrestricted use, distribution, and reproduction in any medium, provided the original work is properly cited.
Theoretical Biology and Medical Modelling 2006, 3:19 />Page 2 of 9
(page number not for citation purposes)
Background
Alternative splicing of pre-messenger RNA is an essential
biological functional and regulatory component in higher
eukaryotic cells. It increases the complexity of biological
processes and gives the cells enhanced capability to
respond to various factors, such as developmental
changes and environmental stimuli. Some splice variants
have been associated with diseases, such as mammary
tumorigenesis [1] and ovarian cancer [2]. About 15% of
single nucleotide mutations in the exon recognition proc-
ess are associated with human genetic diseases [3]. Under-
standing the alternative splicing mechanism may also
lead to finding potential treatments for related diseases
[4].
In this paper, we describe a method for detecting alterna-
tive splicing variants using the GeneChip
®
gene expression
array data. Affymetrix GeneChip
®
technology employs
multiple probes per gene to measure gene expression.
These multiple probes are short sequences located in dif-
ferent positions within each gene. Even though distribu-
tions of these probe sequences are not optimized for
detecting alternative splicing, the probe sequence data
obtained by the current GeneChip
®
technology can be
used to assess alternative splicing. In our method, we infer
"pseudo-exons" from hybridization intensities of multi-
ple probes that are spread over a probe set. A pseudo-exon
is defined as a range of expressed sequence on the genome
that we infer to be an exon based on probe intensities and
physical adjacency.
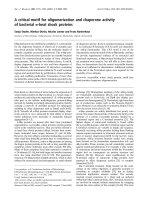
Figure 1 illustrates how GeneChip
®
expression array data
can be used to detect alternative splicing. We show the
probe locations for a hypothetical gene in Figure 1A and
their corresponding hybridization intensities in Figure 1B.
From the probe intensities, we infer that three clusters of
probes represent three pseudo-exons (Figure 1C). For each
of the pseudo-exons, we test whether the difference in
probe intensities between tissue 1 and tissue 2 is signifi-
cant. If the difference is statistically significant, we infer
that there is alternative splicing between the two tissues
for the region corresponding to the selected pseudo-exon.
In our illustration, the region between probe #7 and
probe #14, i.e. pseudo-exon 2 is predicted to be alterna-
tively spliced between tissue 1 and tissue 2.
Previously, Hu et al reported a method, based on fold
changes, to predict alternative splicing from GeneChip
®
expression array data on ten tissue types [5]. For each
probe, they calculated the difference in the fold change
between each tissue type and the average of the remaining
tissue types for the corresponding probe. If the fold
change was greater than an empirically-determined
threshold value R, they selected the gene sequence corre-
sponding to that selected probe as an alternative splicing
site for that tissue type. However, there are some problems
with Hu's approach. First, the fold-change approach does
not take into account sample variation and thus is less
reliable when sample-to-sample variations are large. Sec-
ond, their method is designed to predict splice variants in
a dataset with multiple tissue types. Hu et al reported that
prediction power decreased for a dataset that contained
only three tissue types compared to a dataset that con-
sisted of ten tissue types. The robustness of their method
depended on the number of the tissue types in the dataset.
Thus, their method is not suitable for the comparison of
two tissue types such as detection of splice variants
between two phenotypes, or two disease status, or two
experimental stimuli.
In this paper, we propose an approach to predict splice
variants between two groups of samples from GeneChip
®
expression array data, taking into consideration sample
variation. Our t-test based approach is more statistically
vigorous and reliable than fold-change based methods.
Furthermore, our method does not rely on a large number
of tissue types. We implemented the method from Hu et
al and compared the splice variants predicted from the
two approaches. Our dataset consists of normal cerebel-
lum, non-metastatic medulloblastomas, and metastatic
medulloblastomas. The comparisons were made between
normal cerebellum versus medulloblastomas, and non-
metastatic medulloblastomas versus metastatic medul-
loblastomas.
Results
The computational algorithms
Our approach has two steps. In STEP 1, we infer pseudo-
exons using multiple probe intensities. In STEP 2, we
identify pseudo-exons that are differentially expressed
between two groups of samples. In STEP 1, for each probe,
we first compute the average of the difference in probe
intensities between the two groups of samples. Then,
based on the similarity of probe intensities and probe
adjacency on the gene sequence, we merge probes into
clusters that represent one pseudo-exon. In STEP 2, we test
if the pseudo-exons are differentially expressed between
the two groups of samples. The expression value from a
pseudo-exon is treated as an entity in the current analysis,
comparable to the gene expression from a complete probe
set in customary analyses of gene expression data. The
selected pseudo-exons are interpreted as an indication of
alternative splicing at this region of the gene between the
two comparison groups.
Predicting splice variants between normal cerebellum and
medulloblastomas
For illustrative purposes, we applied the above method to
predict splice variants between the normal cerebellum
and medulloblastoma tumor samples, which included
Theoretical Biology and Medical Modelling 2006, 3:19 />Page 3 of 9
(page number not for citation purposes)
both non-metastatic and metastatic tumors. In STEP 1,
using a significance level of 0.05 in the t-test, we identified
10,838 pseudo-exons out of a total of 142,580 (7129 ×
20) probes that represent the 7,129 probe sets on the
Hu6800 GeneChip
®
. In STEP 2, we compared the differ-
ence in expression values between the two groups for each
pseudo-exon. The histogram of Z-scores from these tests is
shown in Figure 2. With the significance threshold of the
Z-score set to 4.8 (equivalent to one false positive error in
the discovery), we discovered 811 pseudo-exons, derived
from 577 genes, were significantly different between nor-
mal cerebellum and medulloblastoma tumor samples.
Note that for some genes more than one pseudo-exon was
selected.
Predicting splice variants between non-metastatic
medulloblastomas and metastatic medulloblastomas
Following the same procedure, we predicted splice vari-
ants between the non-metastatic and the metastatic
medulloblastomas. We identified 8,319 pseudo-exons,
thirteen of which were significantly different between
non-metastatic and metastatic medulloblastomas (Table
1). Instead of conducting validation in a biological exper-
iment, we searched two genome browsers for supportive
evidence for our prediction. We input the thirteen genes
in Table 1 into the Integrated Genome Browser (IGB)
from Affymetrix [7] to see whether the probes in the iden-
tified pseudo-exons were positioned on separate exons
within the same gene, which is a pre-requisite for alterna-
A Multiple probes are used to quantify the expression value for a gene in GeneChip
®
technologyFigure 1
A Multiple probes are used to quantify the expression value for a gene in GeneChip
®
technology. Currently the probe design
has a 3' bias, i.e. probes are selected from the sequence at the 3'end of the gene. In the Hu6800 array, twenty probes are used
for a single gene. 1 B Intensities of the twenty probes are plotted for both tissues 1 and 2. 1 C The twenty probes are clus-
tered into three groups based on the similarity of probe intensity and probe adjacency. Each cluster, called a pseudo-exon in
this paper, represents a sub-region of the gene.
A
A target gene sequence
5’
3’
Tissue 1
0
100
200
300
400
500
600
700
800
1 2 3 4 5 6 7 8 9 10 11 12 13 14 15 16 17 18 19 20
Probe hybridization intensity
Tissue 2
0
100
200
300
400
500
600
700
800
1 2 3 4 5 6 7 8 9 101112131415161718 1920
Probe hybridization intensity
B
5’
3’
Pseudo-
exon 1
Pseudo-
exon 2
Pseudo-
exon 3
Probe cluster 2
Probe cluster 3
Probe cluster 1
A target gene sequence
C
Theoretical Biology and Medical Modelling 2006, 3:19 />Page 4 of 9
(page number not for citation purposes)
Table 1: Alternative spliced genes selected by our method: Comparison of non-metastatic medulloblastomas with metastatic medulloblastomas
Affymetrix Probe Set ID Gene Symbol Number of Affymetrix Probes in
the Predicted Pseudo-exon
Nucleotide Positions
of Predicted Pseudo-
exon in the Gene
Mean Difference Standard Error Z-score Description of the Genes
M81882_at GAD2 4 (2135–2285) -1.28 0.20 -6.45 glutamate decarboxylase 2 (pancreatic
islets and brain, 65 kDa)
M13955_at KRT7 5 (1402–1474) -0.63 0.12 -5.23 keratin 7
U17327_at NOS1 7 (6805–7003) -0.66 0.13 -5.19 nitric oxide synthase 1 (neuronal)
X14329_at CPN1 4 (1569–1665) -0.62 0.12 -5.18 carboxypeptidase N, polypeptide 1, 50
kD
M89470_s_at PAX2 6 (2855–2972) -0.92 0.19 -4.91 paired box gene 2
L14542_at KLRC3 5 (916–1006) -1.18 0.24 -4.91 killer cell lectin-like receptor subfamily
C, member 3
X76648_at GLRX 3 (704–776) -1.35 0.28 -4.86 glutaredoxin (thioltransferase)
U82987_at BBC3 3 (1578–1638) 2.25 0.32 6.98 BCL2 binding component 3
U01102_at SCGB1A1 2 (409–439) 1.42 0.25 5.62 secretoglobin, family 1A, member 1
(uteroglobin)
M28219_at LDLR 15 (67–277) 0.77 0.14 5.42 low density lipoprotein receptor
(familial hypercholesterolemia)
X68194_at SYPL 5 (1915–2089) 1.67 0.31 5.42 synaptophysin-like protein
U85267_at DSCR1 10 (64–169) 1.20 0.24 5.08 Down syndrome critical region gene 1
L36051_at THPO 6 (1647–1809) 1.05 0.21 4.96 thrombopoietin (myeloproliferative
leukemia virus oncogene ligand,
megakaryocyte growth and
development factor)
Number of Affymetrix Probes in the Predicted Pseudo-exon: number of probes that are contained in a predicted alternatively spliced pseudo-exon. Nucleotide Positions of Predicted Pseudo-
exon in the Gene: nucleotide positions of the pseudo-exon from the beginning of the gene it resides. Mean difference: Mean difference of the expression values between the two tissue types
being compared for each predicted pseudo-exon in the t-test in STEP 2. Standard Error: the standard error calculated in the same t-test. Z-score: the ratio of mean difference over standard
error (noise), a measure of significance of the difference between the two tissues being compared. The sign of the Z-scores indicate direction of the difference. A negative Z-score means a lower
expression in metastatic medulloblastomas than in non-metastatic medulloblastomas, and vice-versa for a positive Z-score.
Theoretical Biology and Medical Modelling 2006, 3:19 />Page 5 of 9
(page number not for citation purposes)
Table 2: Alternative spliced genes inferred by applying Hu's method to our dataset: Comparison of normal cerebellum with medulloblastoma samples
Affy Probe Set
ID
Gene Symbol Number of Affymetrix Probes
in the Predicted Pseudo-exon
Nucleotide Positions of Predicted
Pseudo-exon in the Gene
Description of the Genes
X51362_s_at DRD2 2 (2541–2574) dopamine receptor D2
M15517_cds5_a
t
TTR 3 (155–197) transthyretin (prealbumin, amyloidosis type I)
Y10141_s_at SLC6A3 2 (96–125) solute carrier family 6 (neurotransmitter transporter, dopamine), member 3
Z14982_rna1_at PSMB8 2 (820–850) proteasome (prosome, macropain) subunit, beta type, 8 (large multifunctional protease 7)
X69654_at RPS26 2 (9–35) ribosomal protein S26
U63842_at NEUROG1 2 (834–891) neurogenin 1
M97815_at CRABP2 2 (524–554) cellular retinoic acid binding protein 2
D00017_at ANXA2 2 (1229–1265) annexin A2
U13021_s_at CASP2 3 (844–913) caspase 2, apoptosis-related cysteine protease (neural precursor cell expressed,
developmentally down-regulated 2)
U30999_at ALCAM 2 (373–403) activated leukocyte cell adhesion molecule
X04828_at GNAI2 3 (1668–1701) guanine nucleotide binding protein (G protein), alpha inhibiting activity polypeptide 2
U14971_at RPS9 2 (319–373) ribosomal protein S9
U79299_at OLFM1 2 (1342–1372) olfactomedin 1
L20298_at CBFB 2 (2298–2334) core-binding factor, beta subunit
X93017_at SLC8A3 2 (1725–1821) solute carrier family 8 (sodium-calcium exchanger), member 3
M17886_at RPLP1 2 (127–163) ribosomal protein, large, P1
D16480_at HADHA 2 (2335–2365) hydroxyacyl-Coenzyme A dehydrogenase/3-ketoacyl-Coenzyme A thiolase/enoyl-
Coenzyme A hydratase (trifunctional protein), alpha subunit
D38305_at TOB1 2 (707–749) transducer of ERBB2, 1
U32519_at G3BP 2 (1534–1564) Ras-GTPase-activating protein SH3-domain-binding protein
U07919_at ALDH1A3 3 (3363–3411) aldehyde dehydrogenase 1 family, member A3
U29953_rna1_a
t
SERPINF1 2 (1288–1324) serine (or cysteine) proteinase inhibitor, clade F (alpha-2 antiplasmin, pigment epithelium
derived factor), member 1
D55716_at MCM7 2 (2288–2396) MCM7 minichromosome maintenance deficient 7 (S. cerevisiae)
J05448_at POLR2C 2 (1575–1605) polymerase (RNA) II (DNA directed) polypeptide C, 33 kDa
U46570_at TTC1 2 (1226–1262) tetratricopeptide repeat domain 1
D87119_at TRB2 2 (4022–4136) tribbles homolog 2
X69910_at CKAP4 2 (2543–2573) cytoskeleton-associated protein 4
U50078_at HERC1 2 (14885–14915) hect (homologous to the E6-AP (UBE3A) carboxyl terminus) domain and RCC1 (CHC1)-
like domain (RLD) 1
J04164_at IFITM1 2 (798–828) interferon induced transmembrane protein 1 (9–27)
AFFX-
HUMRGE/
M10098_3_at
N/A 2 (1562–1613) N/A
HG2788-
HT2896_at
N/A 2 (N/A-N/A) N/A
HG2994-
HT4850_s_at
N/A 2 (N/A-N/A) N/A
Number of Affymetrix Probes in the Predicted Pseudo-exon: number of probes that are contained in a predicted alternatively spliced pseudo-exon. Nucleotide Positions of Predicted Pseudo-exon in
the Gene: nucleotide positions of the pseudo-exon from the beginning of the gene it resides. Mean difference: Mean difference of the expression values between the two tissue types being compared
for each predicted pseudo-exon in the t-test in STEP 2. Standard Error: the standard error calculated in the same t-test. Z-score: the ratio of mean difference over standard error (noise), a measure
of significance of the difference between the two tissues being compared. The sign of the Z-scores indicate direction of the difference. A negative Z-score means a lower expression in metastatic
medulloblastomas than in non-metastatic medulloblastomas, and vice-versa for a positive Z-score.
Theoretical Biology and Medical Modelling 2006, 3:19 />Page 6 of 9
(page number not for citation purposes)
tive splicing. For further consistency, we checked whether
the predicted pseudo-exons were reported as splice vari-
ants in the UCSC Human Genome Browser [8] under the
track named "mRNA sequences from GenBank". In the
IGB, we found four out of thirteen genes with predicted
alternatively spliced pseudo-exons resided on different
exons. These four genes were glutaredoxin (GLRX), car-
boxypeptidase N polypeptide 1 (CPN1), Keratin 7 (KRT7)
and killer cell lectin-like receptor subfamily C member 3
(KLRC3). For instance, we predicted the last three probes
for GLRX were within one pseudo-exon. In IGB, based on
RefSeq information, these three probes are on a different
exon. We searched alternatively transcribed variants
deposited in GenBank in the "mRNA sequences from
GenBank" track in UCSC Human Genome Browser for the
genes confirmed by IGB. All of them except for CPN1 have
at least two transcript sequences in the GenBank database.
At least one of these sequences lack the region that we pre-
dicted to be alternatively spliced, and at least one of these
sequences contain the predicted region. We also searched
PubMed for reported splice variants for the thirteen iden-
tified genes. Five of out of the thirteen genes were reported
in the literature to have splice variants. They are nitric
oxide synthase 1 (NOS1) [9], low density lipoprotein
receptor (LDLR) [10], thrombopoietin (THPO) [11],
Down syndrome critical region gene 1 (DSCR1) [12],
paired box gene 2 (PAX2) [13].
Comparison with Hu et al's approach
To compare our method with the Hu et al's, we imple-
mented their method and applied it to our dataset. When
comparing normal cerebellum and medulloblastomas
samples using Hu et al's method, we inferred 31 alterna-
tively spliced genes with the selection criterion used by Hu
et al in their paper (Table 2). Among these 31 genes, seven
overlapped with the findings from our approach (Table
3). For four of them, D87119_at, U14971_at,
U29953_rna1_at, X04828_at, the locations of the alterna-
tive splicing were consistent between the two methods. In
the comparison between non-metastatic and metastatic
medulloblastoma samples, we did not find any gene that
was alternatively spliced by Hu et al's method. We also
investigated the effect of different selection criteria in Hu
et al's method (i.e. the R threshold, which is the ratio of
the probe intensity in a tissue over the mean of the probe
intensities in the remaining nine tissue types for the same
probe). Table 4 shows the relation between the 577 genes
predicted by our approach and the genes selected with dif-
ferent R thresholds in Hu's approach. Numbers of pre-
dicted alternatively spliced genes increase as smaller R
values (less stringent) are used.
We checked both IGB and UCSC Human Genome Brows-
ers for supportive evidence for the seven predicted alterna-
tively spliced variants in Table 3. We found four genes that
had predicted pseudo-exons located on separate exons
according to IGB and alternative spliced mRNA from Gen-
Bank in UCSC Human Genome Browser. They are gua-
nine nucleotide binding protein alpha inhibiting activity
polypeptide 2 (GNAI2), ribosomal protein S9 (RPS9),
activated leukocyte cell adhesion molecule (ALCAM), and
minichromosome maintenance deficient 7 (MCM7).
There are splicing variants reported in PubMed literature
for ALCAM [14].
Discussion
We have developed a two-step approach to predict splice
variants between two groups of samples using GeneChip
®
gene expression array data. We illustrated the method
using empirical data from normal cerebellum, metastatic
medulloblastoma and non-metastatic medulloblastoma
samples. We predicted a total of 577 alternatively spliced
Table 3: Overlapping of the predicted gene from our method and Hu's method for the comparison of normal cerebellum and
medulloblastoma samples
Affy Probe
Set ID
Gene Symbol Number of Affymetrix Probes in
the Predicted Pseudo-exon
Nucleotide Positions of Predicted
Pseudo-exon in the Gene
Descriptions of the Genes
Ours Hu's Ours Hu's
X04828_at* GNAI2 3 3 (1668–1701) (1668–1701) guanine nucleotide binding protein
(G protein), alpha inhibiting activity
polypeptide 2
U14971_at* RPS9 19 2 (103–685) (319–373) ribosomal protein S9
U29953_rna1
_at*
SERPINF1 13 2 (1288–1492) (1288–1324) serine (or cysteine) proteinase inhibitor,
clade F (alpha-2 antiplasmin, pigment
epithelium derived factor), member 1
D87119_at* TRB2 13 2 (3824–4184) (4022–4136) tribbles homolog 2
X69910_at CKAP4 5 2 (2789–2891) (2543–2573) cytoskeleton-associated protein 4
U30999_at ALCAM 16 2 (25–337) (373–403) activated leukocyte cell adhesion molecule
D55716_at MCM7 8 2 (1952–2096) (2288–2396) MCM7 minichromosome maintenance
deficient 7 (S. cerevisiae)
* Consistent alternative splice sites between two methods.
Theoretical Biology and Medical Modelling 2006, 3:19 />Page 7 of 9
(page number not for citation purposes)
genes when we compared normal cerebellum with medul-
loblastomas tumor samples and thirteen alternatively
spliced genes when we compared non-metastatic medul-
loblastomas with metastatic medulloblastomas. A com-
parison of the results from our approach and the method
described by Hu et al on the same dataset revealed some
overlapping alternatively spliced genes.
Our proposed method can be used to predict splice vari-
ants and takes advantage of the extensive repositories of
gene expression array data. Inferred splice variants can be
used to generate alternative splicing hypotheses for subse-
quent experimental validation. Higher signal quality in
the newer generation GeneChip
®
, such as U133 Plus 2.0
array, should make our predictions more robust. Recently,
a genome-wide human exon array became available from
Affymetrix [7] to detect known alternative splicing in a
biological sample. Bypassing the need for defining
"pseudo-exons" in the STEP 1 of our approach, one can
directly use STEP 2 of our method to predict splice vari-
ants. As expected, such an exon array coupled with our rig-
orous statistical method may improve the power to
predict more splice variants.
There are some limitations associated with using Gene-
Chip
®
gene expression array data to detect alternatively
spliced variants. Currently, GeneChip
®
probes cover 600
base pairs in sequence from the 3' end. Thus we can only
detect splice variants at the 3' end. Furthermore, some 3'
end splice variants could be due to alternative polyade-
nylation sites, and our method does not differentiate
between these in the analysis. The splice variants resulting
from the 3' non-translational region could be removed by
checking whether the predicted pseudo-exons on the 3'
end are located in translational regions.
Since our approach depends on probe intensities to clus-
ter probes into pseudo-exons within a single gene, non-
specific hybridization in an expression array could com-
plicate this step (STEP 1), thus result in both false positive
and false negative findings. Cross-hybridization can be
partially addressed by excluding lower grade probe sets,
such as probe sets with the suffix _s or _x, which could
hybridize to multiple genes either before analysis or from
the gene list after analysis.
Conclusion
In this paper we describe a method that can generate
hypotheses of alternative splicing for further investiga-
tion. Our approach overcomes two limitations of a previ-
ously proposed method [5]: 1) we use t-tests instead of
fold changes, 2) we can predict splicing variants between
two groups of samples. These differences make our infer-
ence more robust and not dependent on multiple tissue
types to stabilize the inference.
Methods
Dataset
Our empirical dataset consists of GeneChip
®
Hu6800
expression array data from sixty-nine medulloblastoma
samples and four cerebellum samples as normal controls.
Among the medulloblastoma samples, forty-two are from
non-metastatic tumors and twenty-seven are from meta-
static tumors. There are 7,129 probe sets in the Hu6800
expression array, and twenty probes in each probe set.
Inferring pseudo-exons within a gene (STEP 1)
In this step, we merge probes within a gene into clusters
that represent pseudo-exons. First, we compute the differ-
ence in probe hybridization intensity between two groups
of samples for each probe. Then, for each gene, we merge
probes into clusters based on the similarity of the differ-
ences in probe intensity (between the two groups of sam-
ples) and the probe adjacency on the genome sequence.
For a gene, let Y
(i, 1)
, and n
1
be the probe intensity for
the ith probe in sample group 1, variance, and sample
S
i(,)1
2
Table 4: Comparison of the results from our approach and those from Hu's using different R thresholds when normal cerebellum
samples are compared with medulloblastomas
R used Number of Genes Found in
Hu's Approach
Number of Overlap
Between Hu's and Our 577
Genes
Percentage of the
overlapping genes based on
number of genes found in
Hu's method
Percentage of the
overlapping genes based on
our 577 selected genes
4 324 69 21% 11.9%
6 103 28 27% 4.9%
8 53 14 26% 2.4%
10 31 7 23% 1.2%
Genes found in Hu's methods using different R thresholds are compared to each other. Larger R value represents more stringent selection
criterion. Genes found using smaller R values always include those found using larger R values, i.e. gene list of 324 genes contains gene list of 103
genes, etc. Genes obtained from Hu's method are also compared with 577 genes from our approach. Numbers of overlapping genes are presented
in the third column for different R values. Similarly, overlapping genes for the smaller R values contains those for the larger R values, i.e. gene list of
69 genes contains gene list of 28 genes, etc.
Theoretical Biology and Medical Modelling 2006, 3:19 />Page 8 of 9
(page number not for citation purposes)
size, respectively. Similarly, Y
(i, 2)
, and n
2
are for the
sample group 2. Within the gene, the index i increases
from the direction of the 5' end to the 3' end. We start with
the first probe from the 5' end and compute:
where is the mean of probe intensities. If the absolute
value of t
i
does not exceed the threshold value at the sig-
nificance level
α
= 0.05, we merge the ith probe with the
(i+1)th probe to generate a pseudo-exon. The resulting
pseudo-exon becomes the new ith probe in the next itera-
tion of the t-test. The pseudo-exon extends with each iter-
ation until the results of the t-test become significant or
reach the last probe within a probe set. If t
i
exceeds the sig-
nificance threshold value, we do not merge the ith probe
with the (i+1)th probe, but start generating a new pseudo-
exon from this (i+1)th probe, using the same iteration
procedure. After we finish the last probe at the 3' end, we
may either have several pseudo-exons or only one pseudo-
exon (i.e. the entire probe set) if every t-statistic within a
probe set is not significant.
Testing for statistical significance (STEP 2)
For each pseudo-exon, we determine whether there is a
difference in hybridization intensity between the two
groups x
1
and x
2
. Our null hypothesis is that, for any
pseudo-exon, the difference in probe intensity between
S
i(, )2
2
SE
S
n
S
n
S
n
S
n
ii i i
=+++
()
++(,)(,)(,)(,)1
2
1
2
2
2
11
2
1
12
2
2
1
tyy y y SE
iii i i
=−
()
−−
()
()
++(,)(,) (,)(,)
/
12 11 12
2
y
Histogram of the Z-scores for all 10,838 pseudo-exons obtained in the comparison of normal cerebellum samples with medul-loblastomasFigure 2
Histogram of the Z-scores for all 10,838 pseudo-exons obtained in the comparison of normal cerebellum samples with medul-
loblastomas.
Theoretical Biology and Medical Modelling 2006, 3:19 />Page 9 of 9
(page number not for citation purposes)
the two groups is zero. If we reject the null hypothesis for
a pseudo-exon, meaning that the hybridization intensities
between the two groups are significant different for that
pseudo-exon, we then infer that there is a splice variant
between the two groups of samples for the corresponding
region within the gene.
In the same vein as Li and Wong's model to analyze gene
expression at the probe level [15], we propose a multipli-
cative heterogeneity factor model to associate the probe
intensities of a pseudo-exon directly with the covariate,
i.e. group indictor x
k
:
where Y
jik
is the hybridization intensity for the ith probe in
the jth pseudo-exon in the kth sample, N is the number of
probes in the jth pseudo-exon,
δ
k
and
λ
k
are heterogeneity
factors for normalization,x
k
is the group indicator for the
kth sample,
β
j
is the coefficient for jth pseudo-exon,
φ
ji
is
the multiplicative probe-specific parameter for ith probe
in jth pseudo-exon, and
ξ
is random variation term. To
avoid making any distributional assumptions, we applied
estimating equation techniques to estimate the coeffi-
cients and their standard errors for making statistical
inferences [16-19].
Abbreviations
IGB: Integrated Genome Browser; UCSC: University of
California, Santa Cruz
Competing interests
The author(s) declare that they have no competing inter-
ests.
Authors' contributions
WF performed the data analysis, drafted the manuscript
and developed method jointly with LPZ. NK revised the
manuscript. ARH and JMO conceived the study. LPZ con-
ceived the study and developed the method jointly with
WF. All authors read and approved the final manuscript.
Additional material
Acknowledgements
The authors thank Harvard and MIT researchers for allowing us to use their
microarray data for this paper. This work was supported by grants from the
National Institutes of Health.
References
1. Stickeler E, Kittrell F, Medina D, Berget SM: Stage-specific changes
in SR splicing factors and alternative splicing in mammary
tumorigenesis. Oncogene 1999, 18:3574-82.
2. Scorilas A, Kyriakopoulou L, Katsaros D, Diamandis EP: Cloning of
a gene (SR-A1), encoding for a new member of the human
Ser/Arg-rich family of pre-mRNA splicing factors: overex-
pression in aggressive ovarian cancer. Br J Cancer 2001,
85:190-8.
3. Krawczak M, Reiss J, Cooper DN: The mutational spectrum of
single base-pair substitutions in mRNA splice junctions of
human genes: causes and consequences. Hum Genet 1992,
90:41-54.
4. Faustino NA, Cooper TA: Pre-mRNA splicing and human dis-
ease. Genes Dev 2003, 17:419-37.
5. Hu GK, Madore SJ, Moldover B, Jatkoe T, Balaban D, Thomas J, Wang
Y: Predicting splice variant from DNA chip expression data.
Genome Res 2001, 11:1237-45.
6. PathwayAssist [ />way.html]
7. Affymetrix [
]
8. UCSC Human Genome Browser [
]
9. Wang Y, Newton DC, Marsden PA: Neuronal NOS: gene struc-
ture, mRNA diversity, and functional relevance. Crit Rev Neu-
robiol 1999, 13:21-43.
10. Kim DH, Magoori K, Inoue TR, Mao CC, Kim HJ, Suzuki H, Fujita T,
Endo Y, Saeki S, Yamamoto TT: Exon/intron organization, chro-
mosome localization, alternative splicing, and transcription
units of the human apolipoprotein E receptor 2 gene. J Biol
Chem 1997, 272(13):8498-504.
11. Gurney AL, Kuang WJ, Xie MH, Malloy BE, Eaton DL, de Sauvage FJ:
Genomic structure, chromosomal localization, and con-
served alternative splice forms of thrombopoietin. Blood
1995, 85:981-8.
12. Fuentes JJ, Pritchard MA, Estivill X: Genomic organization, alter-
native splicing, and expression patterns of the DSCR1 (Down
syndrome candidate region 1) gene. Genomics 1997, 44:358-61.
13. Tavassoli K, Ruger W, Horst J: Alternative splicing in PAX2 gen-
erates a new reading frame and an extended conserved cod-
ing region at the carboxy terminus. Hum Genet 1997,
279:371-5.
14. Ikeda K, Quertermous T: Molecular isolation and characteriza-
tion of a soluble isoform of activated leukocyte cell adhesion
molecule that modulates endothelial cell function. J Biol Chem
2004, 279:55315-23.
15. Li C, Wong WH: Model-based analysis of oligonucleotide
arrays: expression index computation and outlier detection.
Proc Natl Acad Sci USA 2001, 98:31-6.
16. Zhao LP, Prentice R, Breeden L: Statistical modeling of large
microarray data sets to identify stimulus-response profiles.
Proc Natl Acad Sci USA 2001, 98:5631-6.
17. Liang KY, Zeger SL: Longitudinal data analysis using general-
ized linear models. Biometrika 1986, 73:13-22.
18. Prentice RL, Zhao LP: Estimating equations for parameters in
means and covariances of multivariate discrete and continu-
ous responses. Biometrics 1991, 47:825-39.
19. Fan W, Pritchard JI, Olson JM, Khalid N, Zhao LP: A Class of Models
for Analyzing GeneChip
®
Gene Expression Analysis Array
Data. BMC Genomics 2005, 6:16.
Additional File 1
Alternative spliced pseudo-exons selected by our method: Comparison of
normal cerebellum with medulloblastomas. Complete results for the 811
pseudo-exons predicted to be alternatively spliced between normal cerebel-
lum and medulloblastomas.
Click here for file
Y
Y
Y
jk
jk
jNk
kk
j
j
jN
1
2
1
2
……
=+
δλ
φ
φ
φ
[(()]
τβ
ξ
ξ
ξ
jjk
jk
jk
jNk
x++
()
1
2
3
…
[ />4682-3-19-S1.xls]