Báo cáo y học: "Predicting iron and folate deficiency anaemias from standard blood testing: the mechanism and implications for clinical medicine and public health in developing countries" ppt
Bạn đang xem bản rút gọn của tài liệu. Xem và tải ngay bản đầy đủ của tài liệu tại đây (217.83 KB, 5 trang )
BioMed Central
Page 1 of 5
(page number not for citation purposes)
Theoretical Biology and Medical
Modelling
Open Access
Research
Predicting iron and folate deficiency anaemias from standard blood
testing: the mechanism and implications for clinical medicine and
public health in developing countries
Alan E Dugdale*
Address: Department of Paediatrics and Child Health, School of Medicine, University of Queensland, Q 4006, Australia
Email: Alan E Dugdale* -
* Corresponding author
Abstract
Background: Developing countries have high prevalence of diseases, but facilities to diagnose and
treat them are limited. We must use available resources in ways not needed where there are
sophisticated equipment and trained staff. Anaemia is common; iron deficiency affects health and
productivity; folate deficiency in pregnant women causes foetal abnormalities. Few developing
countries can measure serum folate or ferritin, but standard automated blood analyses are widely
available and can help predict folate and iron deficiency. The RDW-CV% (coefficient of variation of
the red cell width) measures the variability in the size of red blood cells (RBC) in routine automated
analysis of blood cells, but is seldom reported. Levels of RDW-CV% and haemoglobin (Hb) can
predict iron deficiency anaemia.
Method and results: I have written a computer model based on the standard mechanism for
blood formation and destruction. This shows that before anaemia develops and during recovery,
there are both normal and abnormal RBC (small in iron deficiency and large in folate deficiency) in
the circulation. The model calculates the abnormality in the RDW-CV% in standard automated
blood analyses. In early iron deficiency and during recovery the full blood count shows the Hb near
the lower limit of normal, a low MCV and a high RDW-CV%. A similar pattern, but with a higher
MCV, develops in folate deficiency. Folate deficiency is often brief and may not cause anaemia. The
high RDW-CV% may persist for three months.
Conclusion: This long footprint could be medically useful for detecting folate deficiency and so
limiting foetal damage in individuals and communities. Few clinicians or public health workers know
about RDW-CV%. Standard blood reports for clinical use should include the RDW-CV% and note
the possible significance of abnormal values.
Background
A recent paper [1] has confirmed the findings of earlier
authors [2,3] that we can predict the onset of iron defi-
ciency anaemia using output from automated blood ana-
lyzers. These papers show that the blood changes parallel
the low levels of iron stores. The main indicators are hae-
moglobin level (Hb) near the lower limit of normal and a
high level of anisocytosis measured by the coefficient of
variation (%) of the red cell distribution width (RDW-
CV%). No mechanism for this finding was proposed. I
Published: 09 October 2006
Theoretical Biology and Medical Modelling 2006, 3:34 doi:10.1186/1742-4682-3-34
Received: 20 April 2006
Accepted: 09 October 2006
This article is available from: />© 2006 Dugdale; licensee BioMed Central Ltd.
This is an Open Access article distributed under the terms of the Creative Commons Attribution License ( />),
which permits unrestricted use, distribution, and reproduction in any medium, provided the original work is properly cited.
Theoretical Biology and Medical Modelling 2006, 3:34 />Page 2 of 5
(page number not for citation purposes)
describe a computer simulation model that follows the
formation and destruction of red blood cells (RBC). When
standard assumptions about red cell formation and
destruction are used, and with an adequate supply of iron,
the output of the model corresponds to the findings in
normal blood. When iron is deficient the hitherto unex-
plained changes appear. The model also explains why
people with macrocytic anaemia may have normal folate
level even though the changes in the blood are due to
folate deficiency [4].
The mechanism of the model is as follows. When normal
bone marrow has adequate raw materials and hormonal
stimulus, it produces enough normal RBC to maintain cir-
culating Hb levels. The mean values for circulating RBC
are mean cell volume (MCV) 90 ± 10 and RDW-CV 12%.
When there is insufficient iron for normal haemopoiesis,
the marrow produces microcytes with MCV 60 ± 7. After
the start of altered haemopoiesis, the circulation contains
a mixture of normal cells and microcytes, so the RDW-
CV% increases rapidly, well before the overall levels of
MCV and Hb drop below the normal range. When folate
is lacking, the marrow produces macrocytes; the mixture
of macrocytes and normal RBC raises the RDW-CV%
before the MCV and Hb become abnormal.
The computer model
The model is a computer programme that follows the
changes in the RBC contained in one cubic millimetre of
blood. The model is based on a matrix, 120 columns
wide; each column contains the number and properties of
RBC formed in a single day. The model runs with intervals
of one (simulated) day. The new cells formed are entered
into Column 1 of the matrix. At each iteration (day), the
cohort of cells is moved one column to the right: Column
1 -> Column 2, Column 10 -> Column 11, and so on. It is
assumed that the RBC in Column 120 have been
destroyed and lost to the circulation. In this simple ver-
sion of the model, a life span of 120 days is assumed. I
also take the lower level for normal of Hb as 110 g/l (the
World Health Organisation's lower limit for normal Hb
for adult women) and the upper limit of normal RDW-
CV% as 15%.
The input data are (a) the number of cells formed, (b) the
mean cell volume, (c) the standard deviation of the mean
cell volume, (d) the mean cell haemoglobin, (e) the
number of days during which these conditions apply. It is
assumed that the type of haemopoiesis switches from one
form to another, e.g. normal to iron-deficient, within one
day, but this is not critical for the working of the model.
This simple version of the model also assumes that all
RBCs have a lifespan of 120 days.
At the start of the run the matrix is empty. To populate the
matrix, the model is run for 120 days with normal values
for each of the input parameters. At any iteration, the
characteristics of the RBC contained in one cubic millime-
tre of blood can be shown. The output values are RBC
count per cubic mm, haemoglobin g/l, mean cell volume
(MCV), mean cell haemoglobin (MCH), mean cell hae-
moglobin concentration (%) (MCHC%) and the red-cell
distribution width (RDW-CV%). Once the matrix is pop-
ulated, the type of haemopoiesis can be changed and the
effect on the RBC parameters shown.
Methods and results
Iron deficiency
Table 1 shows the effects of iron deficiency on the full
blood count. The model is first run for 120 days with nor-
mal haemopoiesis to populate the matrix (RBC/day
40000, MCV 90, SD of MCV 10, MCH 30). Following this,
the model runs for 30 days (Days 0 – 30) with normal
haemopoiesis, then for 150 days (Days 30 – 180) with
iron deficient haemopoiesis (RBC/day 30000, MCV 60,
SD of MCV 7, MCH 18).
The MCV, MCH and RDW-CV% in the blood volume are
initially normal. By the end of 30 days of abnormal hae-
mopoiesis, the Hb and the MCV have decreased but
remain within normal limits. However, the RDW-CV%
becomes abnormally high, going from 11.2% to 18.3%,
because of the mixture of circulating microcytes and nor-
mocytes. After 50 days of iron deficiency the Hb is 111,
still within the normal range, but the RDW-CV% has risen
further to 21.3%. The Hb continues to fall and the RDW-
CV% continues to rise until all the normal cells formed
before the iron-deficient haemopoiesis have been
removed from the circulation. After this, there is a uni-
form population of iron deficient RBC, the Hb level stabi-
lizes and the RDW-CV% returns to normal levels. The
critical finding is that the RDW-CV% becomes abnormal
while the Hb and MCV are still within normal range. This
explains the findings [2,3] that a high RDW-CV% predicts
later iron deficiency anaemia. When iron therapy is given
and normal haemopoiesis returns (not shown here), there
will again be both normal and iron-deficient RBC in the
circulation so the RDW-CV% will again rise to abnormal
levels until the microcytes formed during the period of
iron deficiency reach the end of their lifespan.
Folate deficiency
The body has extensive stores of iron, so iron deficiency is
likely to be a long-term event producing the typical anae-
mia. Folate is a water-soluble vitamin. Body stores are rel-
atively small and labile so temporary reduction of dietary
intake can produce short-term (less than 1 month) folate
deficiency, which is relieved by a few meals of folate-con-
taining foods. Vegetable and fruit are the usual sources of
Theoretical Biology and Medical Modelling 2006, 3:34 />Page 3 of 5
(page number not for citation purposes)
folate; in developing countries, seasonal shortages often
occur; in western countries, poor people may forgo these
foods when less cash is available from welfare or other
payments. Usually this would have little effect on health,
but if the woman is in the first trimester of pregnancy,
even a temporary deficiency of folate could produce
severe and permanent effects on the foetus. The model
shows that short-term deficiency produces characteristic
effects on the RBC parameters.
Table 2 shows the changes associated with short-term
folate deficiency. As in Table 1, the model is populated
with normal RBC and then run for another 30 days with
normal haempoiesis. From Day 10 to Day 40, haemopoi-
esis shifts from normal to the macrocytic pattern of folate
deficiency. From Day 40 onwards, the folate deficiency
has been corrected and haemopoiesis returns to the nor-
mal mode. During this short period of folate deficiency,
the Hb drops and the MCV rises, but both remain within
normal range. However, the RDW-CV% rapidly rises
beyond the normal range. It remains high for more than
100 days after the end of the folate deficiency, that is until
the cohort of macrocytes has left the circulation 120 days
after the folate level has returned to normal.
Discussion
This model puts numerical values to the well-known proc-
ess of RBC formation and destruction. In so doing it
shows the cause for hitherto unexplained observations [1-
3] and predicts other clinical applications for routine
blood analysis. The model shows that in iron deficiency,
which could be due to inadequate iron stores or unavail-
ability of iron resulting from acute infection, there is an
early and prolonged rise in the RDW-CV% before the
other parameters indicate anaemia. The RDW-CV%
remains high until the blood is populated entirely by
hypochromic cells. When iron is given and the haemopoi-
esis returns to normal, there is again an increase in the
RDW-CV% (not shown in Table 1) for as long as there is
a mixed population of normal and microcytic RBC in the
circulation.
The model shows similar findings in short-term folate
deficiency. The MCV increases and Hb decreases, but these
remain within normal limits, while the RDW-CV% rises
rapidly beyond the normal range. Folate levels can quickly
return to normal when folate is fed, but the haematologi-
cal effects remain for several months after the return of
normal haemopoiesis until the macrocytes leave the circu-
lation. This explains the lack of correlation between serum
folate levels and macrocytic anemia [4,5]).
This method of detecting early iron and folate deficiencies
is designed for use in countries where iron deficiency is
very common – up to 50% in women of child-bearing age
– folate deficiency much less common and other causes,
with the exception of malaria and thalassaemia in some
countries, uncommon. The model suggests that measures
of MCV and RDW-CV% have two functions: first, to detect
the possibility of a problem; second, to determine the
nature of the problem. Uchida [2] reported a sensitivity of
77.1% for iron deficiency anaemia, 49.2% for iron defi-
Table 1: The changes in standard haematological findings with iron-deficient haemopoiesis.
Total *RBC *MCV *MCV *MCH RBC Hb Ht MCH MCHC% MCV RDW-
Days /day fL SD Pg /10^6 g/L pg fL Cv%
0 40000 90 10 30 4.8 144 36 30 40 90 11.2
10 40000 90 10 30 4.8 144 36 30 40 90 11.2
20 30000 60 7 18 4.8 144 36 30 40 90 11.2.
30 30000 60 7 18 4.7 137 34.7 29.2 39.6 88.1 14.0
40 30000 60 7 18 4.6 130 33.3 28.4 39.3 86.1 16.3
50 30000 60 7 18 4.5 124 31.9 27.6 38.9 84.0 18.3
60 30000 60 7 18 4.4 117 30.5 26.7 38.6 81.8 19.9
70 30000 60 7 18 4.3 111 29.0 25.8 38.2 79.5 21.3
80 30000 60 7 18 4.2 104 27.6 24.9 37.9 77.1 22.4
90 30000 60 7 18 4.1 97 26.0 23.9 37.6 74.6 23.2
100 30000 60 7 18 4.0 91 24.5 22.8 37.3 72.0 23.5
110 30000 60 7 18 3.9 84 22.9 21.7 36.9 69.2 23.2
120 30000 60 7 18 3.8 78 21.3 20.5 36.6 66.3 21.9
130 30000 60 7 18 3.7 71 19.7 19.3 36.3 63.2 18.8
140 30000 60 7 18 3.6 64 18 18 36 60 11.7
150 30000 60 7 18 3.6 64 18 18 36 60 11.7
160 30000 60 7 18 3.6 64 18 18 36 60 11.7
The rows in normal print show the levels with normal haemopoiesis; the rows in bold print show the changes in levels during iron-deficiency. The
columns marked with a * show the characteristics of the RBC formed on that day. The seven columns on the right show the haematological findings
in the blood as would be found in a standard haematological report.
Theoretical Biology and Medical Modelling 2006, 3:34 />Page 4 of 5
(page number not for citation purposes)
ciency anaemia plus latent iron deficiency, and specificity
90.6%. In thalassaemia minor, the RDW-CV% is more
likely to be normal [6], but Green [7] stated that the dis-
crimination is not good and other parameters that are
measured by automated analysers but not reported, such
as the cell haemoglobin distribution, may be better. In the
anaemia of thalassaemia, the haemoglobin level is low
but the RDW-CV% is usually normal [8]. In the anaemia
if chronic illness the RDW-CV% is often within the nor-
mal range [9] and in malaria the RDW-CV% is low [10],
but the best discriminator is a low platelet count [11].
This method cannot distinguish between folate and Vita-
min B12 deficiencies, but B12 deficiency is much less
common in most developing counties. When more than
one of these essential nutrients is low, then the measure-
ments of Hb, MCV and RDW-CV% reflect only the effects
of the limiting nutrient. It is most unlikely that more than
one of these will be a limiting nutrient at the same time.
For example, if iron and folate levels are both low but iron
is limiting nutrient, then the RBC will be small and
hypochromic, with a low MCV and Hb and a high RDW-
CV%. If iron is given to correct the iron deficiency, then
there will be a partial response until haemopoiesis is lim-
ited by the low folate. At this time the MCV and RDW-
CV% will show the folate deficiency.
The sensitivity and specificity of this method of predicting
iron deficiency cannot be calculated from the computer
model but are given in the papers cited. The sensitivity
and specificity for folate deficiency cannot be determined.
If there is long-term folate deficiency, serum folate levels
will correspond with the haematological changes, but
Robinson and Mladonovic [4] note that serum folate lev-
els may be normal even in the presence of macrocytic
anaemia. For short-term folate deficiencies that do not
lead to anaemia but may cause foetal damage, the changes
in MCV and RDW-CV% remain long after the folate level
has returned to normal. There may be no other method
for detecting recent folate deficiency and hence no gold
standard to calculate sensitivity and specificity.
This is a very simple model designed to show the causes of
hitherto unexplained changes in the MCV and RDW-CV%
and their clinical significance. For simplicity, I have
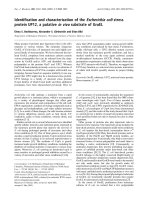
Changes in Hb and RDW-CV% with iron deficiencyFigure 1
Changes in Hb and RDW-CV% with iron deficiency.
RDW-CV% indicated by -+-
Hb indicated by -x-
0 10 20 30 40 50 60 70 80 90 100 110 120 130 140 150
Days in run
0
10
20
30
Hb g/dL and RDW-CV%
Table 2: The changes in standard haematological findings with temporary folate-deficient haemopoiesis.
Day *RBC *MCV *MCV *MCH RBC Hb Ht MCH MCHC MCV RDW
Tot /day SD /c mm CV%
0 40000 90 10 30 4.8 144 36 30 40 90 11.2
10 20000 140 14 20 4.6 136 36.1 29.6 37.7 92.2 15.7
20 20000 140 14 20 4.4 128 36.1 29.1 35.5 94.5 18.8
30 20000 140 14 20 4.2 120 36.1 28.6 33.3 97.1 21.1
40 40000 90 10 30 4.2 120 36.1 28.6 33.3 97.1 21.1
50 40000 90 10 30 4.2 120 36.1 28.6 33.3 97.1 21.1
60 40000 90 10 30 4.2 120 36.1 28.6 33.3 97.1 21.1
70 40000 90 10 30 4.2 120 36.1 28.6 33.3 97.1 21.1
80 40000 90 10 30 4.2 120 36.1 28.6 33.3 97.1 21.1
90 40000 90 10 30 4.2 120 36.1 28.6 33.3 97.1 21.1
100 40000 90 10 30 4.2 120 36.1 28.6 33.3 97.1 21.1
110 40000 90 10 30 4.2 120 36.1 28.6 33.3 97.1 21.1
120 40000 90 10 30 4.4 120 36.1 28.6 33.3 97.1 21.1
130 40000 90 10 30 4.6 128 36.1 29.1 35.5 94.5 18.8
140 40000 90 10 30 4.8 136 36.1 30 37.7 92.2 15.7
150 40000 90 10 30 4.8 144 36 30 40 90 11.4
The rows in normal print show the levels with normal haemopoiesis, the rows in bold print show the changes in levels during folate-deficiency.
Publish with BioMed Central and every
scientist can read your work free of charge
"BioMed Central will be the most significant development for
disseminating the results of biomedical research in our lifetime."
Sir Paul Nurse, Cancer Research UK
Your research papers will be:
available free of charge to the entire biomedical community
peer reviewed and published immediately upon acceptance
cited in PubMed and archived on PubMed Central
yours — you keep the copyright
Submit your manuscript here:
/>BioMedcentral
Theoretical Biology and Medical Modelling 2006, 3:34 />Page 5 of 5
(page number not for citation purposes)
assumed that RBC formation is either normal or abnor-
mal (iron deficient or folate deficient) although the
model changes little if we assume a gradual transition. I
have made no attempt to include the effects of other fac-
tors such as erythropoietin on blood formation. This
method of detecting deficiencies in iron and folate does
not supplant standard measures of serum iron and folate,
but rather provides a useful tool in regions where anaemia
is prevalent and resources limited.
Technical description of the model
The model is written in DOS BASIC language and will run
on any PC-based computer. A compiled version and the
source code are both available. Details and code of the
computer model are available from the author.
Abbreviations
Hb Haemoglobin level (g/l)
RDW-CV% Coefficient of variation of the red cell width
(%)
MCV Mean Red cell Volume (fl)
MCHC% Mean Cell Haemoglobin Concentration (%)
Ht Haematocrit
MCH Mean Cell Haemoglobin (pg)
Competing interests
The author(s) declare that they have no competing inter-
ests.
Authors' contributions
The author elucidated the mechanism described, designed
and wrote the computer program and also wrote the
paper.
Acknowledgements
I thank Dr Tommaso Cavalli-Sforza, Nutrition Adviser, WHO Regional
Office, Manila for his continuing advice and help and Ms Nisha Khan, Chief
Dietician, Government of Fiji for her help.
References
1. Casanova BF, Sammel MD, Macones GA: Development of a clini-
cal prediction rule for iron deficiency anemia in pregnancy.
Amer J Obstet Gynec 2005, 193(2):460-466.
2. Uchida T: Change in red blood cell distribution width with
iron deficiency. Clin Lab Haematol 1989, 11(2):117-121.
3. Mahu JL, Leclercq C, Suquet JP: Usefulness of the red cell distri-
bution width in association with biological parameters in an
epidemiological survey of iron deficiency in children. Int J Epi-
demiol 1990, 19(3):640-654.
4. Robinson AR, Mladonovic J: Lack of utility of folate levels in the
evaluation of macrocytosis or anaemia. Am J Med 2001,
110:88-90.
5. Mischouton D, Burger JK, Spillman MK: Anemia and macrocytosis
in the prediction of serum folate and Vitamin B12 status, and
treatment outcome in major depression. J Psychosomatic Res
2000, 49(3):183-187.
6. Rastogi A, Tripathi BN, Singh SN, Singh PK, Tripathi VN, Lalchandani
A, Saraswat P: Role of red cell width in differentiating tha-
lassemia minor from iron deficiency anemia. Ind J Hematol
Blood Transf 1999, 17(2):35-37.
7. Green R: Anemia diagnosis at the end of the second millen-
nium. 1998 [ />].
8. Lin CK, Lin JS, Chan SY, Jiang ML, Chiu CF: Comparison of hemo-
globin and red cell distributions width in the differential diag-
nosis of microcytic anemia. Arch Path Lab Med 1992,
116:1030-1032.
9. Wians FH, Urban JE, Keffer JH, Kroft SH: Discriminating between
iron deficiency anemia and anemia of chronic disease using
traditional indices of iron status vs transferring receptor
concentration. Am J Clin Path 2001, 115:112-118.
10. Helleberg M, Goka BQ, Akanmori BD, Obeng-Adjei G, Rodriques O,
Kurtzhals JAL: Bone marrow suppression and severe anaemia
associated with persistent Plasmodium falciparum infection in
African children with microscopically undetectable parasi-
taemia. Malaria J 2005, 4:56.
11. Lathia TB, Joshe R: Can hematological parameters discrimi-
nate malaria from nonmalarious febrile illnesses in the trop-
ics? Ind J Med Sc 2004, 58:239-244.
Changes in Hb and RDW-CV% with folate deficiencyFigure 2
Changes in Hb and RDW-CV% with folate deficiency.
RDW-CV% indicated by -+-
Hb indicated by -x-
0 10 20 30 40 50 60 70 80 90 100 120 130 140 150 160
Days in run
0
10
20
30
Hb g/dL and RDW-CV%