Báo cáo y học: "Patient throughput times and inflow patterns in Swedish emergency departments. A basis for ANSWER, A National SWedish Emergency Registry" ppt
Bạn đang xem bản rút gọn của tài liệu. Xem và tải ngay bản đầy đủ của tài liệu tại đây (572.43 KB, 10 trang )
ORIGINAL RESEARCH Open Access
Patient throughput times and inflow patterns in
Swedish emergency departments. A basis for
ANSWER, A National SWedish Emergency Registry
Ulf Ekelund
1*
, Lisa Kurland
2
, Fredrik Eklund
3
, Paulus Torkki
4
, Anna Letterstål
5
, Per Lindmarker
5
and Maaret Castrén
2
Abstract
Objective: Quality improvement initiatives in emergency medicine (EM) often suffer from a lack of benchmarking
data on the quality of care. The objectives of this study were twofold: 1. To assess the feas ibility of collecting
benchmarking data from different Swedish emergency departments (EDs) and 2. To evaluate patient throughput
times and inflow patterns.
Method: We compared patient inflow patterns, total lengths of patient stay (LOS) and times to first physician at six
Swedish university hospital EDs in 2009. Study data were retrieved from the hospitals’ computerized information
systems during single on-site visits to each participating hospital.
Results: All EDs provided throughput times and patient presentation data without significant problems. In all EDs,
Monday was the busiest day and the fewest patients presented on Saturday. All EDs had a large increase in patient
inflow before noon with a slow decline over the rest of the 24 h, and this peak and decline was especially
pronounced in elderly patients. The average LOS was 4 h of which 2 h was spent waiting for the first physician.
These throughput times showed a considerable diurnal variation in all EDs, with the longest times occurring 6-7
am and in the late afternoon.
Conclusion: These results demonstrate the feasibility of collecting benchmarking data on quality of care targets
within Swedish EM, and form the basis for ANSWER, A National SWedish Emergency Registry.
Keywords: Emergency department, Quality measures, Quality of care, Throughput times, Registry
Background
Large resources are used in local and regional initiatives
to improve the quality of emergency care. If such initia-
tives are to be successful, they need to be based on r eli-
able data on the quality of care at the single emergency
care center and, for benchmarking, at similar other cen-
ters. However, since benchmarking data are often lack-
ing [1], quality improvements are commonly suboptimal
and may not represent the best use of the available
resources.
Limited benchmarking data relating to emergency care
may be obtained from existing multicenter patient data-
bases or registries. However, almost all such registries
focus on single disease groups [2-6] or specific medical
interventions [3,7,8]. Very few registries focus on the
emergency care process and none were primarily formed
to reflect the quality of care. For instance, the North
Carolina Disease Event Tracking and Epidemiologic Col-
lection Tool (NC DETECT [9-11]) is an emergency
patient database with the main purpose of public health
surveillance and early detection of large medi cal events.
Another database in the United States (US), the
National Hospital Ambulatory Medical Care Survey
(NHAMCS [12]), uses a national probability sample of
visits to U.S. hospital EDs to produce annual national
estimates of ED visits. Results from this database do no t
apply to indiv idual EDs, and are delayed more than one
year which precludes their use for optimal benchmark-
ing. The Quarterly Monitoring of Accident and Emer-
gency(QMAE)[13]intheUnitedKingdom(UK)
* Correspondence:
1
Emergency Medicine, Department of Clinical Sciences at Lund, Lund
University, Sweden
Full list of author information is available at the end of the article
Ekelund et al. Scandinavian Journal of Trauma, Resuscitation and Emergency Medicine 2011, 19:37
/>© 2011 Ekelund et al; licensee BioMed Central Ltd. This is an Open Access article distributed under the terms of the Creative Commons
Attribution License (http://creati vecommons.org/licens es/by/2.0), which permits unre stricted use, distribution, and reproduction in
any medium, provided the original work is properly cited.
receives and publishes aggregated operational data
submitted by E Ds. The UK Hospital Episode Statistics
(HES) [14,15] includes individual patient data but do
not include all EDs and are only published every second
year. None of the m entioned databases include informa-
tion regarding mortality and morbidity during or after
the ED visit.
The objectives of the present study were twofold. One
was to assess the feasibility of collecting selected quality
of care data from six different Swedish EDs using auto-
mated data capture as a basis for a national quality of
care registry , and the other was to present some first
results regarding throughput times and patient presenta-
tion times. In this paper we present the basis for
ANSWER, A National SWedish Emergency Registry.
Methods
Study design and setting
This study compared variables reflecting quality targets
in the emergency care at six adult EDs in Sweden in
2009; Uppsala University Hospital, Karolinska University
Hospital in Solna and Huddinge, Södersjukhuset in
Stockholm, Sahlgrenska University Hospital in Göteborg
and Skåne University Hospital in Lund. Data in the
figures in this paper are not presented in this order. All
hospitals are teaching hospitals. The study data were
retrievedfromtheEDs’ computerized information sys-
tems during single on-site visits to each hospital in Sep-
tember-October 2009. In five of the six EDs quantitative
data, as described below, were collected. In one of the
EDs, aggregated data were obtained that enabled drilling
down into accumulated data without identifying indivi-
dual patients.
Data collection and processing
The following patient visit-specific data were extracted:
Patient age, time of arrival at the ED, time of first physi-
cian encounter and time of departure from the ED.
There w as no review of the quality of these data i n this
study. The throughput t imes length of ED stay (LOS)
and time to first physician [1] were investigated as pri-
mary quality measures. In order to valid ate the data, the
head physician, the head nurse and the data manager, or
their equivalents, were interviewed concerning the data
registering process. In addition, this process was scruti-
nized with respect to how timestamps were defined,
which personnel were responsible for the data registra-
tion, and the possibility to alter data aft er the first regis-
tration. The definitions presented in this study comply
with those recommended by Welch et al. [1] and Sol-
berg et al. [16], and are as follows:
• Time of patient arrival at EDs A, B, D, E and F was
definedasthetimewhenthepatientarrivedatthe
reception desk. Time of patient arrival at ED C was
defined as t he time when the patient took a queue
ticket to the reception desk.
• Time to first physician was defined as the time
from patient arrival to the first regist ered contact
with a physician providing medical assessment and/
or care.
• LOS was defined as the time from patient arrival
(above) to the time when the patient physically left
the ED, whether discharged or admitted to in-hospi-
tal care.
The following exclusions were made in the data set in
order to ensure comparability between the participating
EDs and to eliminate potential data errors:
• Visits with a recorded LOS exceeding 16 hours, in
most cases due to data input errors. Such visits
represented 1.5% of all visits at ED C, and less than
0.3% at the other EDs.
• Visits lacking LOS data, w hich represented 12.6%
ofthevisitsatEDE,2%atEDBand0%atthe
other EDs.
• Visits where the patient de ceased in the ED, repre-
senting less than 0.2% of the visits at all EDs.
The differences of LOS and time to first physician
between hospitals were analyzed using multivariate
regression analysis, with d ifferences being considered
statistically significant at p < 0.05.
Ethics
The present study was carried out in accordance with
The Declaration of Helsinki [17] and was a quality
assessment initiative that included no single patients
identifiable to the researchers. As such, it is exempt
from review by the regional ethics committees in
Sweden.
Results
The characteristics of the participating EDs are shown
in Table 1. During the study period, all EDs triaged
patients into different medical specialties, so that
patients were assessed by physicians from the assigned
specialty. In addition, all EDs had streaming of differ-
ent specific patient groups. All EDs except E had a
specialist training program in Emergency Medicine
(EM), but no ED had more than 1-2 EM specialists on
the floor at any time. Although the IT systems in the
EDs differed, there were no major differences in the
data registration processes in the different EDs, and all
of them provided electronic data regarding LOS, time
to first physician and patient inflow patterns without
signific ant problems.
Ekelund et al. Scandinavian Journal of Trauma, Resuscitation and Emergency Medicine 2011, 19:37
/>Page 2 of 10
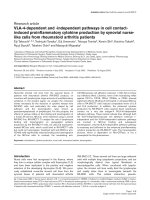
In Figures 1 , 2 an d 3, ED patient inflow is presented
by day of week, by time of arrival, and for different age
groups. I n all EDs, Monday was the busiest day (Figure
1) and Saturday was the day when the least patients
arrived. The patient inflows on Wednesdays at ED B
and on Saturdays at ED F were remarkably low in com-
parison with the other EDs. Patient inflow over t he day
(Figures 2 and 3) showed a homogenous pattern among
the EDs. All ED s had a l arge increase in inflow before
noon and a slow inflow decline over the rest of the 24
hour period. The noon peak and the following decline
were more pronounced in older patients (Figure 3).
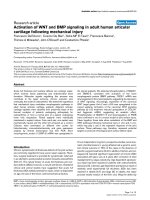
LOS data for each ED are presented in Figure 4, by
age group in Figure 5, and by time of arrival in Figure 6.
With the exception o f ED A vs ED B (NS), all LOS dif-
ferences between the EDs (Figure 4) were highly signifi-
cant (p < 0.001). Average LOS was longer for older
patients (Figure 5), sho rter in the middle of the night
(Figure 6) and clearly increased both between 6 and 7
am and in the afternoon in all EDs. The fraction of
patients who were discharged from the ED within 4
hours was for ED A 71%, B 67%, C 50% , D 57%, E 54%
and F 68%. Figures 7 and 8 show the time to first physi-
cian by ED (Figure 7) and by time of arrival (Figure 8).
With the exception of ED A vs ED F (NS), all differ-
ences in time to physician between the EDs (Figure 7)
were highly si gnificant (p < 0.001) . The time to physi-
cian (Figure 8) and the LOS (Figure 6) showed a si milar
diurnal pattern. In ED C, the LOS was almost 50%
longer and the wait to see a physician 100% longer
between 3 and 4 pm than during the early hours of the
morning.
Discussion
These results demonstrate the possibility to compile
benchmarking data on quality of care markers in six dif-
ferent EDs in Sweden. T he data presented here show
that the average LOS was approximately 4 hours, of
which 2 hours was spent waiting for the first physician.
The throughput times in all EDs we re shortest after
midnight and l ongest in the late afternoon or early
evening.
The average LOS of 4 hours and average discharge
rate of 62% at 4 h in the present EDs are clearly below
Table 1 ED characteristics, in accordance with Welch et al [1]
Emergency Department
ABCDEF
Approximate
annual
number of
patients
75000 65000 50000 100000 55000 70000
Time period
analysed
Jan 1st - June 30th
2009
Jan 1st - Jun 30th
2009
Jan 1st - June
30th 2009
Jan 1st - June 30th
2009
June 8th - Oct
10th 2009
Jan 1st - June 30th
2009
Patient visits
included
38 016 32 684 24 116 48 129 17 925 34 060
Female
patients,%
55.4 49.6 49.3 50.4 49.6 50.7
Admission
rate,%
23.3 26.9 46.3 34.6 Data missing 12.1
Trauma
level*
121212
Specialties
present
(patient
spectrum
received)
Internal Medicine,
Neurology, Surgery,
Urology, Orthopedics
& Trauma, Infectious
diseases, OB/gyn
Internal Medicine,
Neurology, Surgery,
Urology,
Orthopedics &
Trauma, Infectious
diseases
Internal Medicine,
Neurology,
Surgery,
Orthopedics &
Trauma, Infectious
diseases.
Internal Medicine,
Neurology, Surgery,
Urology,
Orthopedics &
Trauma, Infectious
diseases
Internal Medicine,
Neurology,
Surgery,
Orthopedics &
Trauma, Infectious
diseases
Internal Medicine,
Neurology, Surgery,
Urology,
Orthopedics &
Trauma, Infectious
diseases
Transplant
Service in
hospital
Yes Yes Yes No Yes Yes
Acuity High High High High High High
EM specialist
training
program
Yes Yes Yes Yes No Yes
IT system
delivering ED
data
Take care™ Patientliggaren™,
Tieto Corporation
Internally
developed system
Akusys™ Cosmic™ Take care™
*trauma level according the American College of Surgeons [43]. EM, emergency medicine
Ekelund et al. Scandinavian Journal of Trauma, Resuscitation and Emergency Medicine 2011, 19:37
/>Page 3 of 10
the quality goal set by many Swedish health care autho-
rities of an 80% discharge rate at 4 h. According to
QMAE, the average 4 h ED discharge rate in England
during the same period was above 98% [18,19], which
was also the national goal at the time. In the US, the
median ED LOS in 2008 was 2 h and 34 min [20]. In
the present study, 2 hours was instead spent waiti ng for
the first physician, as compared to 56 min in the 2006
US NHAMCS data [21] and 7 7 min (first physician or
nurse) in the 2009-10 UK HES data [14]. In the present
study, LOS was strongly age-dependent (Figure 5),
which is very similar to what has been reported from
the UK [22]. Older patients stay longer in the ED.
All others things being equal, a long stay i n the ED
and a long wait for the physician reflects a low quality
of care a nd decreases patient satisfaction [23]. The
above comparison with UK and US throughput times
supports initiatives to accelerate care in Swedish EDs.
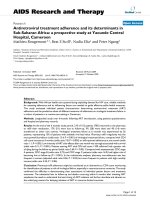
Figure 2 Patient arrival to EDs A-F by time of day.
Figure 1 Patient arrival to EDs A-F by day of week.
Ekelund et al. Scandinavian Journal of Trauma, Resuscitation and Emergency Medicine 2011, 19:37
/>Page 4 of 10
Actions to decrease process times for the elderly may be
of special importance for the overall quality of care,
since they are a significant proportion of the patients (e.
g. [24]) and on average are mor e likely to suffer from
long waiting times. Interestingly, the relative differences
in LOS between the EDs (Figure 4) were similar to the
differences in physician waiting times (Figure 7), indicat-
ing that that they are linked. Indeed, it seems likely that
a short wait for the critical decision-maker, the physi-
cian, will increase the chances of a short LOS. The rea-
sons for the long throughput times in the present EDs
are however most likely multiple, and probably include
slow turnaround times for blood samples, radiology
exams and admissions, a relative lack of personnel and,
most importantly, an ineffective organization.
In Sweden, like in Norway, Denmark and Finland,
ED patients are usually sorted into medical specialties
by a triage nurse, and then managed by physicians
from the respective specialties, most o ften internal
medicine, surgery and orthopedic surgery. We believe
that introducing more EM specialists would simplify
and increase the flexibility of the ED organization and
that this in turn would probably enhance patient
throughput. Other solutions that have been proposed
for long throughput times include streaming of
patients with less severe illnesses into fast tracks
Figure 3 Patient arrival to EDs by time of day and age group.
Ekelund et al. Scandinavian Journal of Trauma, Resuscitation and Emergency Medicine 2011, 19:37
/>Page 5 of 10
[25,26], point-of-care testing [27,28], nurse practi-
tioners in the ED [29], nurse-requested X-ray [30,31]
and team t riage [32,33]. For most of these methods
however, adequate studies regarding their precise
effects are lacking [34].
The throughput times in this study varied with the time
of patient presentation in all EDs, with the largest varia-
tion i n ED C. LOS in EDs C and F was markedly
increased at lunchtime and almost stable during the
afternoon, whereas in all other EDs, LOS increased over
the afternoon (Figure 6). The reasons for the patterns in
EDs C and F are unclear , but according to the leadership
in ED C, the pattern in ED C may be related to ho spital
crowding with admitted patients waiting in the ED for an
in-hospital bed. The LOS pattern in ED C and F is an
example of a find ing that will be useful for the individual
ED to analyze further, e.g. by using the conceptual mod-
els suggested by Asplin et al. [35,36]. A long LOS was
observed in all EDs when the patients arrived between 6
and 7 am. This was most likely caused by patient
Figure 4 Total length of ED stay by ED.
Figure 5 Total length of ED stay by age group.
Ekelund et al. Scandinavian Journal of Trauma, Resuscitation and Emergency Medicine 2011, 19:37
/>Page 6 of 10
handovers between the night and day shifts and could
thus be influenced by organizational changes.
The observed diurnal variation in LOS and waiting
times in all EDs is most likely due to a mismatch
between allocated resources and patient inflow over
the 24 hours, with a relative excess o f personnel and
resources during the night. One explanation of this
excess may be the lack of an EM physician-based
organization with a consequent need for more doctors
(from multiple specialties) to cover the spectrum o f
ED patients at night. This is supported by data from
UK, where LOS in EDs with EM physicians is instead
longer during the night than during the day [14,22],
and where this has been explained by a lower
Figure 6 Total length of ED stay by time of patient arrival at the different EDs.
Figure 7 Time to first physician by ED.
Ekelund et al. Scandinavian Journal of Trauma, Resuscitation and Emergency Medicine 2011, 19:37
/>Page 7 of 10
physician staffing at night than would be possible in
Swedish EDs [22].
The circadian pattern of ED patient inflow in this
study (Figure 2) was similar to that shown repeatedly in
the UK [14,15,37] and the US [21]. Also, the impact of
age on the pattern of presentation (Figure 3) was
remarkably similar to that in UK reports [37]. This sta-
bility over time and between a ge groups and EDs with
different organizational structures indicates that patient
inflow is little affected by the emergency health care sys-
tem, and that initiatives to change inflow are unlikely to
be successful. Instead, the ED organization needs to be
adapted to meet the inflow at hand. Published models
to forecast patient inflow [38] may be used as aids. The
different inflow patterns in the different age groups
(Figure 3) may be of importance for the distribution of
specific ED resources during the day.
As in UK EDs [37], and in contrast to US EDs [38],
Saturda ys was a low inflow day in the present EDs. The
reason for this difference is unclear and warrants further
research.
Limitations
The participating EDs are all adult EDs in university
hospitals and therefore the results are not necessarily
generalizable to smaller units, or to EDs receiving
children primarily.
In all but one ED (C), the throu ghput times were
calculated from the first registration by the personnel,
and not from the actual time of patient arrival. Since
there is often an interval between arrival and registra-
tion, the “real” LOS for all EDs except in C were some-
what longer than described in the results. Data from the
Skåne University Hospital ED in Malmö suggest that
this interval is on average some 15 min [39]. EDs A, B
and D-F have recently changed to measuring LOS from
the actual time of patient arrival, ie the taking of a
queue ticket.
The medical specialties were not similar in the EDs
(Table 1), and since some specialties have shorter LOS
and waiting times than others, these differences may
have influenced the results.
Development of ANSWER
When fully developed, ANSWER wil l encompass the
entire pre- and in-hospital emergency care system in
Sweden (approximately 2 million patients/year [40]) so
that near-real time data from all participating institu-
tions are available for quality improvement, epidemiol-
ogy, disease control and public health surveillance. The
Figure 8 Time to first physician by time of patient arrival at the different EDs.
Ekelund et al. Scandinavian Journal of Trauma, Resuscitation and Emergency Medicine 2011, 19:37
/>Page 8 of 10
large number of observations will decrease the influence
of chance on the results, and the ANSWER data will
thus also be useful for research projects. ANSWER data
may perhaps even be used as a surrogate for rando-
mized controlled trials, which are often difficult to con-
duct in EM. There ar e 71 national health care quality
registries receiving public financial support in Sweden
[41], and this abundance provides excellent o pportu-
nities for data linking and collaboration.
ANSWER will collect data for all ED patients as a first
step in its development. Automated data capture from
the patient records through XML files will be used and
allows near-real time surveillance, close to complete
patient coverage and minimal selection bias. In addition
to patient characteristics, the data variables to be col-
lected are chosen to reflect the quality of ED care as
defined by the Swedish Board of Health and Welfare
[42]. The variables include chief complaints, throug hput
times (LOS, time to physician, discharge to physically
leaving the ED etc), ED and hospital stay diagnoses,
mortality in the ED, and morbidity and mortal ity within
30 days. Information on the patient’sexperienceofthe
visit is also of interest, but a system for the collection
and automatic inclusion of such data remains to be
developed. In addition, ANSWER l ike the NC DETECT
[9,10] will face the challenge of establishing a standard
list of specific terms for the chief complaint, and also of
triage priority levels. The UK HES and QMAE data do
not include a variable for chief complaint.
Conclusions
This study demonstrates the feasibil ity of collecting
benchmarking data in emergency care in Sweden, and
forms the basis for ANSWER. In the studied six EDs,
Monday was the busiest and Sa turday the least busy
day. All EDs had a large increase in patient inflo w
before noon and a slow decline over the rest of the 24
hours. The average length of stay was 4 hours of which
2 hours was spent waiting for the first physician. These
quality measures showed a considerable diurnal varia-
tion. ANSWER aims to become a Swedish national qual-
ity registry for all emergency care, and one of its
strengths will be the automated data capture from parti-
cipating centers. By providing reliable benchmarking
data, we believe that ANSWER will facilitate systematic
quality improvement in the emergency care process,
organizational planning, and research in EM.
Acknowledgements
This work was supported by the Region Skåne, the Stockholm County
Council and the Swedish Association of Local Authorities and Regions. This
work was done for for the ANSWER Steering Committee.
We gratefully acknowledge the skilful help with data retrieval and
presentation from the personnel at all participating EDs, and Jorma Teittinen
for connecting the ANSWER steering committee with NHG.
Author details
1
Emergency Medicine, Department of Clinical Sciences at Lund, Lund
University, Sweden.
2
Karolinska Institutet, Department of Clinical Sciences
and Education and Section of Emergency Medicine, Södersjukhuset,
Stockholm, Sweden.
3
Karolinska Institutet, Medical Management Centre,
Stockholm, Sweden.
4
HEMA-Institute, BIT Research Centre, Aalto University,
Finland.
5
Emergency Medicine, Karolinska University Hospital, Stockholm,
Sweden.
Authors’ contributions
UE participated in the conception and design of the study, data
interpretation and drafted and critically revised the manuscr ipt. LK, AL, PL
and MC participated in the conception and design of the study, data
interpretation and critically revised the manuscript. FE and PT collected and
analyzed the data and critically revised the manuscript. FE also drafted the
manuscript. All authors read and approved the final version of the
manuscript.
Competing interests
The authors declare that they have no competing interests. FE and PT are
employed by Nordic Healthcare Group, NHG. NHG is a commercial company
that focuses on healthcare and welfare industries and designs models to
enhance productivity, cost-effectiveness and process quality. The business is
based on research and has employees in Stockholm, Sweden and Helsinki,
Finland.
Received: 4 April 2011 Accepted: 13 June 2011 Published: 13 June 2011
References
1. Welch S, Augustine J, Camargo CA Jr, Reese C: Emergency department
performance measures and benchmarking summit. Acad Emerg Med
2006, 13:1074-1080.
2. RIKS-HIA, The Register of Information and Knowledge about Swedish
Heart Intensive care Admissions. [ />Accessed Janaury 5, 2010
3. National Emergency Airway Registry. [ Accessed
January 5, 2010
4. International Registry of Acute Aortic Dissection, IRAD. [http://www.
aorticdissection.com/Forums/forumdisplay.php?s=&daysprune=-1&f=42],
Accessed January 5, 2010
5. RIKS-Stroke, The national stroke register in Sweden. [s-
stroke.org/index.php?content=&lang=eng&text=], Accessed January 5, 2010
6. NCDR, National Cardiovascular Data Registry:[ />webncdr/common/], Accessed February 2, 2011
7. SCAAR, the Swedish Coronary Angiography and Angioplasty Registry.
[ Accessed January 5, 2010
8. Balls A, LoVecchio F, Stapczynski SJ, Mulrow M, Levine B, Berkely R,
Panacek E, Miller A, Norquist C, Riviello R, Ary R, Rodriguez E, Young J,
Gross E, Mills L, Zeger W, CLEAR Investigators. CLEAR - Central Line
Emergency Access Registry: The CLEAR project protocol methods paper.
Am J Emerg Med 2009, 27(1):119-122.
9. The North Carolina Disease Event Tracking and Epidemiologic Collection
Tool (NC DETECT):[ Accessed January 5,
2010
10. Hakenewerth AM, Waller AE, Ising AI, Tintinalli JE: North Carolina Disease
Event Tracking and Epidemiologic Collection Tool (NC DETECT) and the
National Hospital Ambulatory Medical Care Survey (NHAMCS):
comparison of emergency department data. Acad Emerg Med 2009,
16:261-269.
11. Waller A, Hakenewerth A, Tintinalli J, Ising A: North Carolina Emergency
Department data: January 1, 2007-December 31. N C Med J 2007,
71:15-25.
12. National Hospital Ambulatory Medical Care Survey (NHAMCS):[http://www.
cdc.gov/nchs/ahcd.htm], Accessed January 5, 2010
13. The Quarterly Monitoring o f Accid ent and Emergency:[ .
gov.uk/en/Publicationsandstatistics/Statistics/
Performancedataandstatistics/AccidentandEmergency /index.h tm],
Accessed February 2, 2011
14. Accident and Emergency Attendances in England 2009-10. National
Health Service, The Health and Social Care Information Centre; 2011, 1-55,
1-55.
Ekelund et al. Scandinavian Journal of Trauma, Resuscitation and Emergency Medicine 2011, 19:37
/>Page 9 of 10
15. Accident and Emergency Attendances in England 2007-08. National
Health Service, The Health and Social Care Information Centre; 2009, 1-72,
1-72.
16. Solberg LI, Asplin BR, Weinick RM, Magid DJ: Emergency department
crowding: consensus development of potential measures. Ann Emerg
Med 2003, 42:824-834.
17. The Declaration of Helsinki:[ />10policies/b3/index.html], Accessed February 1, 2003
18. Department of Health UK: Statistics, Total Time Spent in A&E in England,
Q1 2009-2010. 2010.
19. Department of Health UK: Statistics, Total Time Spent in A&E in England,
Q4 2008-2009. 2010.
20. National Hospital Ambulatory Medical Care Survey: 2008 Emergency
Department Summary Tables. National Health Statistics Reports
Washington DC: US Department of health and human services:1-31;1-31.
21. Pitts SR, Niska RW, Xu J, Burt CW: National Hospital Ambulatory Medical
Care Survey: 2006 Emergency Department Summary. National Health
Statistics Reports Washington DC: US Department of health and human
services; 2008, 1-14, pp. 1-14.
22. Downing A, Wilson RC, Cooke MW: Which patients spend more than 4
hours in the Accident and Emergency department? J Public Health (Oxf)
2004, 26:172-176.
23. Taylor C, Benger JR: Patient satisfaction in emergency medicine. Emerg
Med J 2004, 21:528-532.
24. Downing A, Wilson R: Older people’s use of Accident and Emergency
services. Age Ageing 2005, 34:24-30.
25. Ardagh MW, Wells JE, Cooper K, Lyons R, Patterson R, O’Donovan P: Effect
of a rapid assessment clinic on the waiting time to be seen by a doctor
and the time spent in the department, for patients presenting to an
urban emergency department: a controlled prospective trial. N Z Med J
2002, 115:U28.
26. Sanchez M, Smally AJ, Grant RJ, Jacobs LM: Effects of a fast-track area on
emergency department performance. J Emerg Med 2006, 31:117-120.
27. Tsai WW, Nash DB, Seamonds B, Weir GJ: Point-of-care versus central
laboratory testing: an economic analysis in an academic medical center.
Clin Ther 1994, 16:898-910, discussion 854.
28. Singer AJ, Viccellio P, Thode HC Jr, Bock JL, Henry MC: Introduction of a
stat laboratory reduces emergency department length of stay. Acad
Emerg Med 2008, 15:324-328.
29. Sakr M, Kendall R, Angus J, Sanders A, Nicholl J, Wardrope J: Emergency
nurse practitioners: a three part study in clinical and cost effectiveness.
Emerg Med J 2003, 20:158-163.
30. Lindley-Jones M, Finlayson BJ: Triage nurse requested x rays–the results
of a national survey. J Accid Emerg Med 2000, 17
:108-110.
31. Lindley-Jones M, Finlayson BJ: Triage nurse requested x rays–are they
worthwhile? J Accid Emerg Med 2000, 17:103-107.
32. Partovi SN, Nelson BK, Bryan ED, Walsh MJ: Faculty triage shortens
emergency department length of stay. Acad Emerg Med 2001, 8:990-995.
33. Holroyd BR, Bullard MJ, Latoszek K, Gordon D, Allen S, Tam S, Blitz S,
Yoon P, Rowe BH: Impact of a triage liaison physician on emergency
department overcrowding and throughput: a randomized controlled
trial. Acad Emerg Med 2007, 14:702-708.
34. SBU: Triage och flödesprocesser på akutmottagningen. En systematisk
litteraturöversikt Stockholm: SBU - The Swedish Council on Health
Technology Assessment; 2010.
35. Asplin BR, Magid DJ, Rhodes KV, Solberg LI, Lurie N, Camargo CA Jr: A
conceptual model of emergency department crowding. Ann Emerg Med
2003, 42:173-180.
36. Asplin BR, Flottemesch TJ, Gordon BD: Developing models for patient flow
and daily surge capacity research. Acad Emerg Med 2006, 13:1109-1113.
37. Downing A, Wilson R: Temporal and demographic variations in
attendance at accident and emergency departments. Emerg Med J 2002,
19:531-535.
38. Jones SS, Thomas A, Evans RS, Welch SJ, Haug PJ, Snow GL: Forecasting
daily patient volumes in the emergency department. Acad Emerg Med
2008, 15:159-170.
39. Stavenow L: Personal communication. 2010.
40. Safwenberg U: Emergency care physicians gaining ground. 162
internships already one year after the new specialty was established.
Lakartidningen 2008, 105:205-206.
41. Nationella Kvalitetsregister:[ />Quality_Registries.aspx?pageID=94989b20-6982-417a-ac12-76feaba80de4],
Accessed February 2, 2011
42. God vård - om ledningssystem för kvalitet och patientsäkerhet i hälso-
och sjukvården. 2006-101-2. Stockholm: The Swedish National Board of
Health and Welfare; 2006.
43. The American College of Surgeons CoT: Resources for Optimal Care of the
Injured Patient The American College of Surgeons; 2006.
doi:10.1186/1757-7241-19-37
Cite this article as: Ekelund et al.: Patient throughput times and inflow
patterns in Swedish emergency departments. A basis for ANSWER, A
National SWedish Emergency Registry. Scandinavian Journal of Trauma,
Resuscitation and Emergency Medicine 2011 19:37.
Submit your next manuscript to BioMed Central
and take full advantage of:
• Convenient online submission
• Thorough peer review
• No space constraints or color figure charges
• Immediate publication on acceptance
• Inclusion in PubMed, CAS, Scopus and Google Scholar
• Research which is freely available for redistribution
Submit your manuscript at
www.biomedcentral.com/submit
Ekelund et al. Scandinavian Journal of Trauma, Resuscitation and Emergency Medicine 2011, 19:37
/>Page 10 of 10