Ethernet Networks: Design, Implementation, Operation, Management 4th phần 10 pdf
Bạn đang xem bản rút gọn của tài liệu. Xem và tải ngay bản đầy đủ của tài liệu tại đây (1002.44 KB, 59 trang )
security 529
harm that can happen has already occurred and your actions from this point
onward can prevent further harm from occurring. Unless the unwanted pro-
gram has taken control of your computer and is writing continuously to disk,
do not power off your computer. If you were not using a virus scanner and
have a program available for use, run it. The chances are high that, if you have
a virus or another type of attack program, its techniques may be recognized
and the scanner can locate the program. If a scanner is not available or fails
to locate any abnormal software, reboot your system using an original system
diskette, which loads a good write-protected copy of the operating system,
since the original system diskette is permanently write-protected.
Using the newly loaded operating system, attempt to examine the files you
used during the operating that resulted in an infection indicator. For example,
did you previously execute a command stored as an .EXE file and a directory
listing shows both .COM and .EXE files? If so, the obvious cause of the problem
is now apparent. However, what happens if you cannot access your hard drive
owing to the modification of your boot sector, FAT, or directory structure?
Although it is probably preferable to have used a disk recover program
which keeps an image of your key hard-drive sectors on another area of your
drive to facilitate data recovery, you can also attempt to use an operating
system command, such as the DOS command SYS C:, which will rewrite your
DOS boot sector on your hard drive if that area was modified.
If this still does not fix the problem and persons you consult shrug their
shoulders when asked what you should do next, you may be faced with
having to reformat your drive and reload your software, which was hopefully
backed up on a regular basis. Although this represents a situation most of
us will rarely have to encounter, if you have to reload previously backed-up
software it is important to recognize that the cause of your problem may also
have been placed on your backup tape during your last backup operation.
However, since you were able to notice an infection symptom, you also noted
an operation you performed which caused the symptom. Thus, after you
reload your software, reboot from an original version of the operating system
and attempt to locate and eliminate the cause of your problem.
chapter ten
Managing the Network
With a little bit of luck, a small network without a significant amount of usage
may require a limited amount of effort by the network manager or administrator
to tailor the network to the requirements of the organization. As networks
grow in complexity, the necessity to manage the network increases to the point
where network management tools and techniques become indispensable for
obtaining an efficiently and effectively run network.
This chapter will focus upon the tools and techniques required to effectively
manage a network. First, we will examine the Simple Network Management
Protocol (SNMP) and its Remote Monitoring (RMON) management informa-
tion base (MIB). Once this is accomplished, we will focus upon the use of
products that can provide us with some of the tools we may require to both
effectively manage the transmission of information on the network, as well as
observe the operation of file servers attached to the network.
Although an Ethernet network is a layer 2 transport facility, it is commonly
used to transport a variety of higher-layer protocols. Thus, any discussion
focused upon the management of Ethernet would be remiss if it did not
cover at least one tool you can use to observe the state of higher-layer
activity on an Ethernet network. Recognizing this fact, we will conclude this
chapter by examining the use of several software products that can be used to
provide a valuable insight concerning the utilization of an Ethernet network
to include the type of traffic transported and status of different devices on
the network.
10.1 SNMP
The Simple Network Management Protocol (SNMP) was originally developed
as a mechanism for managing TCP/IP and Ethernet networks. Since the first
SNMP Internet Draft Standard was published in 1988, the application and
utilization of SNMP has considerably expanded, and an enhanced version,
531
Ethernet Networks: Design, Implementation, Operation, Management.
Gilbert Held
Copyright
2003 John Wiley & Sons, Ltd.
ISBN: 0-470-84476-0
532 chapter ten
which was originally intended to add several security functions, but due
to conflicts among members of the standardization committee wound up
tailoring features in the first version of SNMP, was introduced in 1993. That
version of SNMP is referred to as SNMPv2. A third version of SNMP, referred
to as SNMPv3, was introduced during 2000 and added such security features
as authentication and access control. Through the use of SNMP, you can
address queries and commands to network n odes and devices that will return
information concerning the p erformance and status of the network. Thus,
SNMP provides a mechanism to isolate problems, as well as analyze network
activity, which may be useful for observing trends that if unchecked could
result in network problems.
Basic Components
SNMP is based upon three components — management software, agent
software, and management information bases (MIB), the latter representing
databases for managed devices. Management software operates on a network
management station (NMS) and is responsible for querying agents using SNMP
commands. Agent software represents one or more program modules that
operate within a managed device, such as a workstation, bridge, router, or
gateway. Each managed agent stores data and provides stored information
to the manager upon the latter’s request. The MIB represents a database
that provides a standard representation of collected data. This database is
structured as a tree and includes groups of objects that can be managed.
Concerning the latter, the first MIB, referred to as MIB-I, included 114 objects
organized into eight groups. Table 10.1 lists the groups supported by the
first MIB defined by the Internet Standards Organization to include a brief
description of each group.
In examining the MIB-I groups listed in Table 10.1, it is important to
note that SNMP represents an application layer protocol. That protocol runs
over the User Datagram Protocol (UDP), which resides on top of the Internet
Protocol (IP) in the TCP/IP protocol stack. Figure 10.1 illustrates the rela-
tionship of SNMP protocol elements to E thernet with respect to the OSI
Reference Model.
In examining Figure 10.1, note that SNMP represents the mechanism by
which remote management operations are performed. Those operations are
transported via UDP, which is a connectionless service that can be viewed as
providing a parallel service to the Transmission Control Protocol (TCP), which
also operates at layer 4 of the ISO Reference Model. At layer 3, the Internet
Protocol provides for the delivery of SNMP, controlling fragmentation and
managing the network 533
TABLE 10.1 MIB-I Groups
Group Description
System Provides vendor identification to include
configuration in information and time since the
management portion of the system was last
reinitialized.
Interfaces Provides single or multiple network interfaces
that can be local or remote, and designates the
operating rate of each interface.
AddressTranslation Table Provides a translation between the network
address and physical address equivalences.
Internet Control Message
Protocol (ICMP)
Provides a count of ICMP messages and errors.
Transmission Control
Protocol (TCP)
Provides information concerning TCP
connections, transmissions, and retransmissions
to include maintaining a list of active
connections.
User Datagram Protocol
(UDP)
Provides a count of UDP datagrams transmitted,
received, or undelivered.
Exterior Gateway
Protocol (EGP)
Provides a count of interrouter communications,
such as EGP locally generated messages, EGP
messages received with and without error, and
information on EGP neighbors.
reassembly of datagrams, the latter a term used to reference portions of a
message. Located between IP and layer 4 is the Internet Control Message
Protocol (ICMP). ICMP is responsible for communicating control messages
and error reports between TCP, UDP, and IP.
In addition to being transported via UDP, SNMP can be transported via
Novell’s IPX, within Ethernet frames and through the use of AppleTalk and
OSI transports. In 1992, a new MIB, referred to as MIB-II, became an Internet
standard. MIB-II included the eight groups of MIB-I previously listed in
Table 10.1, as well as two new groups — Common Management Information
and Services Over TCP (CMOT) and SNMP. When the effort to run ISO’s
management on top of TCP/IP was abandoned, CMOT was essentially dropped
as an active group. The addition of an SNMP group permits SNMP to track
everything to include its own traffic and errors.
534 chapter ten
Application
Presentation
Session
Transport
Network
Data link
Physical
SNMP
User Datagram
Protocol (UDP)
ICMP
Internet
Protocol (IP)
Ethernet
Physical
7
6
5
4
3
2
1
Figure 10.1 Relationship of SNMP
protocol elements to Ethernet.
Operation
SNMP has a core set of five commands referred to as protocol data units (PDUs).
Those PDUs include GetRequest, GetNextRequest, SetRequest, GetResponse,
and Trap.
The Network Management Station (NMS) issues a GetRequest to retrieve
a single value from an agent’s MIB, while a GetNextRequest is used to walk
through the agent’s MIB table. When an agent responds to either request, it
does so with a GetResponse.
The SetRequest provides a manager with the ability to alter an agent’s
MIB. Under SNMP Version 1, there was no method to restrict the use of this
command, which if used improperly could corrupt configuration parameters
and impair network services. Recognizing this problem, many vendors elected
not to support the SetRequest command in their SNMP agent software. The
introduction of SNMP Version 3 added authentication as well as encryption,
resulting in a network management message received by an agent to be
recognized if it was altered, as well as to be verified that it was issued by the
appropriate manager. This permits the S etRequest to be supported without
fear of an unauthorized person taking control of a portion of a network, or an
agent returning false information.
Since SNMP is a polling protocol, a mechanism was required to alert
managers to a situation that requires their attention. Otherwise, a long polling
managing the network 535
interval could result in the occurrence of a serious problem that might go
undetected for a relatively long period of time on a large network. The
mechanism used to alert a manager is a Trap command, issued by an agent to
a manager.
Under SNMP Version 2, two additional PDUs were added — GetBulkRequest
and InformRequest. The GetBulkRequest command supports the retrieval of
multiple rows of data from an agent’s MIB with one request. The InformRequest
PDU enables one manager to transmit unsolicited information to another
manager, permitting the support of distributed network management, which
until SNMP V2, was performed in a proprietary manner.
One of the problems associated with the development of MIBs was the
provision within the standard that enables vendors to extend their database of
collected information. Although the tree structure of the MIB enables software
to be developed by one vendor to read another vendor’s extension, doing
so requires some effort and on occasion results in interoperability problems.
To reduce a degree of interoperability, the Remote Monitoring (RMON) MIB
was developed as a standard for remote-LAN monitoring. RMON provides the
infrastructure that enables products from different vendors to communicate
with a common manager, permitting a single console to support a mixed
vendor network.
10.2 Remote Monitoring
Remote Monitoring (RMON) represents a logical evolution of the use of S NMP.
RMON provides information required for managing network segments that can
be located in your building or on the other side of the world.
Operation
RMON operations are based upon software or firmware operating either in
managed devices or managed stand-alone hardware probes. Managed devices
can include such programmable hardware products as bridges, routers, gate-
ways, hubs, workstations, minicomputers, and mainframes that are connected
to a network. Through appropriate software, each managed device responds
to network management station (NMS) requests transported via the SNMP
protocol. Although a stand-alone probe can be considered to represent a
managed device, it differs slightly from the previously mentioned devices in
that it is firmware-based and is restricted to performing one set of predefined
tasks — RMON operations.
536 chapter ten
Whether an RMON agent is a managed device or managed stand-alone probe,
it captures predefined data elements and will either send statistics and alarms
to a network management station upon request for statistics, or generate a trap
command upon occurrence of a preset threshold being exceeded, resulting in
the generation of an alarm condition that the NMS will then pool.
Figure 10.2 illustrates the relationship between a network management
station and a series of managed devices consisting of RMON agents or probes.
The MIB provides a standard representation of collected data, as well as
defines groups of objects that can be managed. At the NMS, one or more
application programs control the interaction between the NMS and each
managed device, as well as the display of information on the NMS and
generation of reports. Other functions performed by NMS applications can
include password protection to log on to and take control of the NMS,
support for multiple operators at different locations, forwarding of critical
event information via e-mail or beeper to facilitate unattended operations,
and similar functions.
The RMON MIB
Remote network monitoring devices or probes represent hardware and
software designed to provide network managers and administrators with
information about different network segments to which they are attached.
The remote networking monitoring MIB was originally defined in RFC 1271,
which was obsoleted by RFC 1757, issued in 1995. Under both RFCs the MIB
consists of objects arranged into nine groups.
RMON
agent
MIB
RMON
agent
MIB
RMON
agent
MIB
Network Management Station
(NMS)
SNMP
protocol
Managed
device
Managed
device
Managed
device
Figure 10.2 RMON operation.
managing the network 537
The key difference between RFCs is the size of the counters, which were
expanded from 32 to 64 bits under RFC 1757. This expansion was in recog-
nition of the fact that, as users installed faster Ethernet networks, counters
would reach their maximum value in a shorter period of time. Table 10.2 lists
each MIB group and provides a brief d escription of the function of each group.
All groups in the MIB listed in Table 10.2 are optional and may or may not be
supported by a managed device.
Both the statistics and history groups can provide valuable information
concerning the state of the Ethernet segment being monitored. The statistics
group contains 17 entries for which countervalues are maintained, while the
history group contains 11 entries for which countervalues are maintained. In
TABLE 10.2 Remote Network Monitoring MIB Groups
Group Description
Statistics Contains statistics measured by the RMON probe for
each monitored interface.
History Records statistical samples from a network for a
selected time interval and stores them for later
retrieval.
Alarm Retrieves statistical samples on a periodic basis from
variables stored in a managed device, and compares
their values to predefined thresholds. If the monitored
variable exceeds a threshold, an alarm event is
generated.
Host Contains statistics associated with each host
discovered on a network.
HostTopN A group used to prepare reports that describe the hosts
that had the largest traffic or error counts over an
interval of time.
Matrix Stores statistics of traffic and errors between sets of
two addresses.
Filter Permits packets to be matched based upon a filter
equation.
Packet Capture Permits packets to be captured after they flow through
a channel.
Event Controls the generation and notification of events from
the managed device.
538 chapter ten
addition, the history group includes the real-time maintenance of an integer
value that denotes the mean physical layer network utilization in hundredths
of a percent.
Table 10.3 provides a comparison of the measurements performed by the
statistics and history RMON groups. Although both groups provide essentially
the same information, there are some significant differences between the two.
The first major difference is the fact that the statistics from the statistics group
take the form of free-running counters that start from zero when a valid entry
is received, and provide information concerning the recent operational state
of the segment. In comparison, the statistics in the history group provide
TABLE 10.3 Comparing Statistics and History Group
Measurements
Statistics History
Drop Events Yes Yes
Octets Yes No
Packets Yes Yes
Broadcast Packets Yes Yes
Multicast Packets Yes Yes
CRC Alignment Errors Yes Yes
Undersize Packets Yes Yes
Oversize Packets Yes Yes
Fragments Yes Yes
Jabbers Yes Yes
Collisions Yes Yes
Packets 64 octets in length Yes No
Packets 65–127 octets in length Yes No
Packets 128–255 octets in length Yes No
Packets 256–511 octets in length Yes No
Packets 512–1025 octets in length Yes No
Packets 1024–1518 octets in length Yes No
Utilization No Yes
managing the network 539
information more useful for long-term segment trend analysis. Recognizing
these differences, the statistics group tracks different packet lengths, while the
history group ignores packet lengths and tracks network utilization.
Since a managed device or probe is essentially useless if a segment becomes
isolated from the organizational network due to a router or bridge failure
or cabling problem, some vendors provide Ethernet RMON probes with
redundant access capability. This capability is normally provided through the
use of a built-in backup modem or ISDN support. Another common feature
offered with some stand-alone p robes is a multisegment support capability.
This feature enables a single probe to be used to provide support for up to four
network segments, assuming cabling distances permit. Figure 10.3 illustrates
the use of a multisegment RMON probe to capture and report statistics for two
Ethernet segments at one location to an NMS at a remote location.
Managing Remote Networks
To illustrate the use of a network management platform to remotely mon-
itor two Ethernet LANs, this author used Network General’s Foundation
R
R
NMS
Multisegment
probe
Legend:
NMS = Network management station
R = Router
Figure 10.3 Using a multisegment RMON p robe.
540 chapter ten
Manager program. It should be noted that Network General was one of several
companies that were acquired by Network Associates during the past few
years. Figure 10.4 illustrates the selection of this program’s Remote Quick-
Stats bar, which enables you to specify an IP address of a probe on the remote
network you wish to monitor. Once this is accomplished, the program will
use that address to access the probe and retrieve p redefined MIB elements
such as the distribution of packet lengths shown in the upper left portion of
Figure 10.4. In fact, if you compare the last seven entries in Table 10.3 with
the contents of Figure 10.4, you will note that the packet distribution shown
in Figure 10.4 and the usage meters in that illustration correspond to those
seven statistics entries in the table.
One of the key features of Foundation Manager is its ability to provide
users with the capability to remotely monitor up to eight networks at one
time and simply click on an icon to change the display of statistics from one
monitored n etwork to another. This capability is shown in Figure 10.5 where
the first two of eight QuickStat buttons are darkened to indicate two remote
Figure 10.4 Using Network General’s Foundation Manager QuickStats fea-
ture enables you to view key statistics concerning the operational state of a
remote network.
managing the network 541
Figure 10.5 Through the use of up to eight QuickStat buttons, Foundation
Manager can be used to monitor up to eight remote networks.
LANs are being monitored. Here the second QuickStat button is associated
with an Ethernet LAN in S an Antonio, and clicking on the first button would
immediately bring up the statistics screen for Sacramento that was previously
shown in Figure 10.4.
In examining the screens shown in Figures 10.4 and 10.5, you will note
both provide the same key metrics for each monitored network. Those metrics
include the distribution of packets, network usage, traffic in terms of frames,
and bytes and broadcasts. In addition, the lower portion of each screen
provides a graph over time of the percentage of network utilization and
broadcast traffic. Thus, at a glance you can visually note the current use of
the monitored network and whether or not a metric indicates a potential or
existing problem that requires closer examination.
10.3 Other Network Management Functions
Now that we have an appreciation for SNMP and RMON, we can turn our
attention to a detailed discussion of a core set of network management
542 chapter ten
functions you can use as a mechanism to evaluate the suitability of different
vendor products. As we will shortly note, upon occasion no one product will
satisfy all of your management requirements and you may have to turn to
multiple products to view network operations. Thus, we will conclude this
chapter by examining the use of several network management tools you can
use to observe network performance.
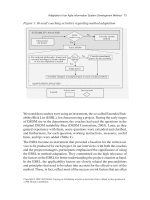
There is a core set of five functions associated with network manage-
ment. Those functions are configuration, performance, fault, accounting, and
security management. Each functional area manages a set of activities.
Figure 10.6 illustrates the functional areas commonly associated with net-
work management and the set of activities managed by each area.
Configuration M anagement
The process of configuration management covers both the hardware and soft-
ware settings required to provide an efficient and effective data transportation
highway. Thus, configuration management consists of managing the physical
hardware — including cables, computers, and network adapters — along with
the logical network configuration governed by the installation of the network
operating system, the selection of a network protocol or stack of protocols,
and the manner in which users can access server facilities. The latter concerns
the setup of the network, including permissions and routings that enable
users to access different servers. Although this may appear to involve security
management, it is mainly focused on the setting and distribution of network
Network
management
Configuration
management
Performance
management
Fault
management
Accounting
management
Security
management
Physical
configuration
Logical
configuration
Network
activity
monitoring
Problem
detection
Data usage
collection
Computation
Report
generation
Physical
security
Logical
security
Problem
isolation
Problem
resolution
Resource use
examination
Bandwidth
capacity
determination
Figure 10.6 Network management functional areas.
managing the network 543
passwords and the assignment of file permissions. Thus, logical configuration
management permits a user to reach a network facility once he or she is
connected to the n etwork, while security management involves the ability of
a user to gain access to the network and to different facilities made available
by configuration management.
Performance Management
Performance management involves those activities required to ensure that the
network operates in an orderly manner without unreasonable service delays.
This functional area is concerned with the monitoring of network activity to
ensure there are no bottlenecks to adversely affect network performance.
Monitored network activity can include the flow of data between stations
and between stations and servers; the use of bridges, routers, and gateways;
and the utilization of each network segment with respect to its total capacity.
By performing these tasks, you will obtain information that will enable you
to adjust the use of network hardware and software, as well as to consider a
variety of network segmentation options that can eliminate potential network
bottlenecks before they occur.
Fault Management
Networks have their less desirable moments in which components fail,
software is configured incorrectly, and other problems occur. Fault man-
agement is the set of functions required to detect, isolate, and correct
network p roblems.
A large number of hardware and software products are now marketed to
provide a fault management capability for cables, hardware, and network
software. The most common type of diagnostic device is a time domain
reflectometer, which generates a pulse and uses its reflected time delay (or
absence of a reflection) to isolate cable shorts and opens. LAN protocol
analyzers allow you to test individual Ethernet adapters, and to monitor
network performance and isolate certain types of network problems, such as
jabbering. Both hardware-based LAN protocol analyzers and many software
products provide a LAN frame decoding capability. This helps you determine
whether the flow of frames and frame responses provides an insight into
network problems. For instance, a station might be rejecting frames because
of a lack of buffer space, which could easily be corrected by reconfiguring
its software.
544 chapter ten
Accounting M anagement
Accounting management is a set of activities that enables you to determine
network usage, generate usage reports, and assign costs to individuals or
groups of users by organization or by department. Normally, the network
operating system provides a raw set of network usage statistics, and you will
need one or more other software packages to generate appropriate reports and
assign costs to usage. While cost assignment is commonly used in wide area
networks and for electronic mail usage, it is not commonly used to distribute
the cost of using local area networks. Instead, accounting management is
normally employed to answer such questions as, ‘‘What would be the effect on
the network if the engineering department added five new employees?’’ In this
situation, accounting management data might provide you with network usage
statistics for the engineering department, including total department usage as
well as individual and average station usage data. Using these statistics in
conjunction with performance monitoring, you could then determine the
probable effect of the addition of new employees to the network.
Security Management
As discussed in our overview of configuration management, security man-
agement involves primarily the assignment of network access passwords and
access permissions to applications and file storage areas on the network. Other
aspects of security management involve the physical placement of stations in
areas where access to those stations is restricted, and the selection and control
of specialized hardware and software security products. These products can
range in scope from programs used to encipher and decipher electronic mail
messages to network modems that can be programmed to perform a series
of operations: prompt users for a code when they dial into the network, d is-
connect the user, and then dial a number predefined as associated with the
user code.
Most network management products provide excellent coverage of a subset
of the five core functional areas, but few products actually cover all functional
areas. Most users will normally consider the use of two or more products to
perform all five network management functions.
10.4 Representative Network Management Programs
In this section we will turn our attention to obtaining an appreciation of
the operational capability of three programs that can be used to monitor an
managing the network 545
Ethernet network. The first program we will look at is EtherVision, marketed
by Triticom. E therVision is a layer 2 monitor whose operation is restricted
to primarily looking at the Ethernet frame header and computing layer 2
information. The other two programs we will examine, WebXRay from Cinco
Systems (now part of Network Associates) and EtherPeek from WildPackets
(formerly known as the AG Group), look deeper into each frame and have the
ability to provide statistics at layers 2 through 4 of the OSI Reference Model.
Triticom EtherVision
One of the earliest Ethernet software monitors is a program marketed by
Triticom of Eden Prairie, Minnesota, under the trademark EtherVision. This
program is designed to operate on a workstation, and must be used with
a specific type of Ethernet/IEEE 802.3 adapter — a Novell NE/2, NE1000, or
NE2000, a 3Com Etherlink II, a Western Digital EtherCard, or a Pure Data
PDI8023, PDI 8023-16, or PDUC8023. At the time this book was written,
EtherVision supported 14 adapter cards and Triticom was in the process
of adding program support for additional vendor adapter cards. Only the
workstation executing EtherVision requires a specific Ethernet/IEEE 802.3
adapter card; all other workstations, servers, and other devices on the network
can use any vendor adapter card. EtherVision’s rationale for requiring a
specific vendor’s adapter card is based on the necessity to write software
that accesses MAC layer buffers in the adapter, so that the program can read
frames transmitted on the network. These frames form the basis for numerous
network-operation statistics generated by the program.
Main Menu
The starting point for the use of EtherVision is the program’s main menu. This
menu contains a list of eight actions; these can be selected either by pressing
the first letter of the listed options or by moving a highlight bar over an action
and p ressing the Enter key.
Options you can select from the main menu enable you to perform a variety
of operations:
♦ Monitor network traffic
♦ Enable and disable a variety of alarms
♦ Assign names, alarms, and filters to station addresses
♦ Enable and disable network event logging
♦ Test the cable connected to the workstation’s adapter
♦ Control the configuration options of the program
546 chapter ten
♦ Generate different types of reports
♦ Quit to DOS
By examining the use of several program options, we can obtain an appre-
ciation for how EtherVision can assist you in managing your network.
Traffic Monitoring
By selecting the Monitor Traffic option from the program’s main menu, you can
monitor either source or destination addresses on a real-time basis. Figure 10.7
shows the screen display when the monitoring of source addresses is selected.
The main area of the display lists the source addresses of stations identified
on the network and the number of frames counted for each station. At the time
this screen display was printed, EtherVision was in operation for 40 seconds
and had identified 22 stations on the network. Although station addresses
are shown in Figure 10.7 in hexadecimal format, by pressing the F2 key you
can toggle the station address display to its logical name or the vendor-
adapter address. The highlighted bar over the top source address indicates
that information about that address is displayed in the third area on the screen
display, which shows the hexadecimal address, logical name, and vendor-ID
for the address highlighted. Note that in the first 40 seconds of monitoring,
the station named Sleepy was anything but, accounting for 86.3 percent of all
Figure 10.7 EtherVision source address monitoring.
managing the network 547
network traffic. If the network utilization continued to be relatively h igh for a
long monitoring period and some users complained about poor response time,
you would probably want to determine what the user with the logical name of
Sleepy was doing. Perhaps a one-time download of a large file occurred and
there is no cause for alarm.
The next area of the screen shown in Figure 10.7 provides summary informa-
tion concerning all stations that have been identified. Here, we see 22 stations
were identified, and together they transmitted 3351 frames and 1873 K of infor-
mation. A total of nine frames were broadcast to all stations, and the frames
per second (FPS) and peak frames per second activity were 127 and 220,
respectively. During the monitoring period there were no CRC errors, frame
alignment errors, or collisions, nor were there any missed or unprocessed
(MU) frames.
A missed or unprocessed frame typically results from data arriving too fast
for the adapter to keep up with network traffic. The adapter used by a station
running EtherVision must function in a promiscuous mode of operation. This
means that the adapter must pass every frame read from the n etwork to
the higher-level network layers, instead of passing only frames that have the
adapter’s destination address. This is required since EtherVision must process
each frame to compute a variety of network statistics.
When one or more stations on the network request a long file transfer, it
becomes possible that the processor of the computer running EtherVision may
not be able to process frames as they are read from the network. Thus, missed
or unprocessed frames may indicate the need to operate EtherVision on a
workstation that has a faster microprocessor to obtain more reliable statistics.
The bottom area of the display shown in Figure 10.7 indicates the function
keys and their assignments, and enables you to select different action options.
For example, pressing the F2 key changes the display of identified network
adapters to logical names or a vendor-ID display format, while pressing the
F8 key clears the display and resets all counters and the elapsed time to zero.
Skyline Displays
To obtain detailed information about network utilization, you would press
the F6 key from the traffic monitoring display. This provides you with the
ability to view the program’s skyline display of network utilization and the
FPS carried by the monitored network.
Figure 10.8 shows the EtherVision skyline display of network utilization,
and Figure 10.9 shows the skyline display with respect to the FPS rate of data
flow on the network. In examining Figure 10.8, note that the display shows
548 chapter ten
Figure 10.8 EtherVision network utilization skyline display.
Figure 10.9 EtherVision frames per second skyline display.
managing the network 549
intervals for a 60-second monitoring period. By pressing the F5 key, you can
change the monitoring period of the display to one hour — a more realistic
period for examining network utilization. Since the network utilization in
Figure 10.8 only slightly exceeded 10 percent, if this low level of utilization
continued for a longer period of time it would indicate that you could expand
your network through the addition of workstations before considering the use
of bridges to subdivide the network.
The FPS display shown in Figure 10.9 provides you with a general indi-
cation of traffic flow on your network. However, by itself this display does
not provide you with meaningful information, because it does not indicate
the average frame size nor the distribution of frames by their length. This
information can be obtained by pressing the F7 key to generate the program’s
statistics screen.
Statistics Display
Figure 10.10 illustrates the display of EtherVision’s Statistics screen. Note that
this screen provides you with summary information concerning frame counts,
distribution of frame sizes, network utilization, and frame errors. Although
this screen provides information similar to Foundation Manager’s QuickStats
display previously shown in Figures 10.4 and 10.5, there are key differences
Figure 10.10 EtherVision statistics display.
550 chapter ten
between that program and EtherVision that deserve a brief discussion. Foun-
dation Manager is an SNMP RMON manager, capable of monitoring up to eight
remote LANs. In comparison, EtherVision requires you to run the program
on a station on the network to be monitored and does not support remote
monitoring. Thus, you would use Foundation Manager or a similar p roduct if
you need to monitor remote networks while EtherVision or a similar product
could be used to monitor a local network. Returning to our discussion of
EtherVision, note that in the Frame Counts window, the average computed
frame size is displayed, while the Frames Per Second window displays the
average and peak frames per second monitored on the network. By using this
data, you can compute and verify the data in the Network Utilization window
and compute the effect of adding additional workstations to the network. For
example, the peak FPS rate is 304 for 22 stations, or approximately 14 FPS per
workstation. Adding 10 workstations with similar operational characteristics
to existing workstations can be expected to increase the network traffic flow by
140 FPS. Since the average frame size is 561 bytes, 10 additional workstations
can be expected to result in 561 bytes × 8 bits per byte × 140 FPS, or less than
630,000 bps of network traffic.
Alarms
The key to the effective management of a network is the ability to generate
alarms when important predefined events occur. EtherVision provides net-
work administrators with the ability to generate several key alarms, without
which you would have to monitor several screens constantly. You can avoid
this cumbersome process by using the program’s Network Alarms/Options
screen, illustrated in Figure 10.11. The Network Alarms/Options screen illus-
trated in Figure 10.11 allows you to enable or disable five alarms and to set
the threshold value for three alarms. When an alarm is enabled and the event
occurs or an alarm threshold is exceeded, the alarm status will be displayed
on the top line of any EtherVision screen you are using, as well as being
written to the program’s Network Event Log.
The network idle time alarm will be triggered when EtherVision senses no
traffic for the specified period of time. Since NetWare file servers periodically
transmit IPX frames to make servers aware of each other, a Novell-based
Ethernet LAN will always have at least some traffic at periodic intervals.
Thus, the occurrence of a network idle time alarm can inform you of a serious
network problem, such as the failure of a server or a faulty adapter in the
computer operating EtherVision.
The network utilization alarm allows you to determine whether your net-
work is approaching or has reached a level of saturation that warrants its
managing the network 551
Figure 10.11 EtherVision network alarms/options screen.
subdivision. Normally, a utilization level that periodically exceeds 50 percent
on an Ethernet/IEEE 802.3 network indicates a level of use that warrants the
subdivision of the network and its connection via a bridge.
The frame error alarm goes off when it reaches a specified number of frame
errors. Since the error rate on a LAN is typically 1 in a billion bits, or 1 × 10
−9
,
you can use this alarm to determine whether your network has an acceptable
error level. To do so, you would view the Statistics screen when a frame
error alarm occurs to determine the number of bits that have been transmitted
during the time it took until the frame error alarm was generated. With this
information, you could d etermine whether your LAN’s bit error rate (BER)
is at an acceptable level. For example, assume the total number of frames
in the frame count window in the Statistics display was 100,000,000 when
the frame error count reached 100 and generated an alarm. Also assume, for
simplicity, that the average frame size in the Statistics display was 1000 bytes.
An average of 100,000,000/100, or 1,000,000 frames, flowed on the network
for each frame error. Since we assumed that each frame has an average length
of 1000 bytes, 1,000,000 frames × 1000 bytes per frame × 8 bits per byte, or
8,000,000,000 bits, are transmitted per frame error. This is equivalent to a BER
of 1/8,000,000,000, or 1.25 × 10
−8
, which is about what we would expect from
a LAN that performs well, and that has properly connected cables routed a
safe distance from sources of electromagnetic interference.
The alarm count interval can be used to generate an alarm when enabled
and set to a specific time period. Then, if the number of frame errors specified
552 chapter ten
by the frame error alarm occurs within the specified alarm period, an alarm
frame count interval alarm will go off.
The intruder detection alarm operates by triggering an alarm when a new
station enters the network that was not defined to the program by the assign-
ment of a logical name. When we examine the Station Options screen, we will
see how logical names are assigned to each station address. The last alarm
shown in Figure 10.11 is Source Addr = Broadcast Alarm. Since all source
addresses must be unique, this alarm occurs when a source address with its
broadcast bit set is detected.
Station Options Display
Through EtherVision’s Station Options display screen you obtain the ability
to assign names, filters, and alarms to specific hardware adapter addresses.
Figure 10.12 illustrates the display of the program’s Station Options screen.
In examining Figure 10.12, note that the highlighted bar is positioned over
the top address, which was previously assigned the logical name Sleepy. In
this example, we are in the process of changing the station’s name to Dumbo.
By moving the highlight bar over different station addresses and/or pressing
appropriate function keys, you can control the assignment of names, alarms,
and filters to stations. For example, F2 permits you to add or change a name,
F3 prompts you to delete the n ame currently selected by the highlight bar,
and so on. When assigning names, you can specify a filter (Ftr) for each
station. Then, during monitoring, only those stations marked for filtering
Figure 10.12 EtherVision station options display.
managing the network 553
will be displayed on the program’s monitoring screen. For a large network,
filtering enables you to examine groups of stations, such as the accounting
department’s workstations. In addition to station filtering, you can use the
Station Options display to set an idle alarm from 1 to 9,999, an error alarm
of 1 to 9,999, and a usage alarm based on a percentage of network activity
for each station. Thus, you can use the Station Options display to isolate a
problem condition on a specific station or group of stations.
Network Event Logging Display
Figure 10.13 illustrates EtherVision’s Network Event Logging screen. From
this screen, you can enable and disable the logging of events to the program’s
log file and select the logging of error frames and peak utilization data. In
addition, from this screen you can view the event log.
Figure 10.14 displays a portion of the network event log, which can be
scrolled through a window on your display. Since we previously enabled
the logging of both frame errors and peak utilization, the contents of the log
reflect both types of activities. In examining Figure 10.14, note that ‘‘Frame
Short’’ refers to any frame shorter than the minimum length of 64 bytes — a
condition usually caused by a collision. Although collisions normally occur
on an Ethernet/IEEE 802.3 network, a situation in which one station has a
large number of collisions associated with its transmission may indicate a
faulty adapter. Thus, from an examination of Figure 10.14 it appears that the
Figure 10.13 EtherVision network event logging screen.
554 chapter ten
Figure 10.14 EtherVision network event log.
adapter used on the station whose logical address is Sleepy may be in need of
an awakening action, during which the adapter is tested, and if it continues
to generate short frames, replaced.
As indicated by our short review of EtherVision, it permits you to perform
most of the major functions associated with network management. Regardless
of which management tool you use, you should always ensure that you have
one available. The periodic use of an appropriate network management tool
provides you with a detailed view of network activity, which can be invaluable
in performing your network management functions.
Cinco Network’s WebXRay
As previously discussed in this chapter, it is important to note that Ethernet
is a layer 2 transport protocol that operates at the data link layer of the
ISO Reference Model. This means that different types of protocols can be
transported over Ethernet, which is both a key advantage of the n etwork
as well as the cause of many network-related problems. In this section we
will turn our attention to the use of Cinco Network’s WebXRay network
monitoring and troubleshooting tool, which can be of considerable assistance
when looking at IP traffic. As noted earlier in this chapter, Cinco Networks
was one of several companies acquired by Network Associates over the past
few years. WebXRay is now marketed as Sniffer Basic by Network Associates.
Due to the growing role of the Internet and corporate intranets, most Ethernet