analog bicmos design practices and pitfalls phần 2 doc
Bạn đang xem bản rút gọn của tài liệu. Xem và tải ngay bản đầy đủ của tài liệu tại đây (231.25 KB, 22 trang )
where A is the cross-sectional area of the junction. Since x
d
, the width
of the depletion region, is a function of voltage, the junction capacitance
is also a function of voltage. Plugging Equation 1.24 into Equation 1.27
C
J
=
C
J0
1+
V
R
Ψ
o
(1.28)
where
C
J0
= A
qN
D
2Ψ
o
(1.29)
Equations 1.29 and 1.27 apply to the single-sided junction with uniform
doping in the p-sides and n-sides. If the doping varies linearly with dis-
tance, junction capacitance varies inversely as the cube root of applied
voltage.
1.3.3 The Law of the Junction
The law of the junction is used to calculate electron and hole densities
in pn junctions. It is based on Boltzmann statistics. Consider two sets
of energy states. They are identical, except that set 1, at energy level
E
1
, is occupied by N
1
electrons and set 2, at energy level E
2
, is occupied
by N
2
electrons. The Boltzmann assumption is that
N
2
N
1
= e
−
E
2
−E
1
KT
(1.30)
In a pn junction, the built-in potential Ψ
o
, across the junction causes
an energy difference. The conduction band edge on the p-side of the
junction is at a higher energy than the conduction band on the n-side of
the junction. On the n-side of the junction, outside the depletion region,
the density of electrons is N
D
, the donor concentration. On the p-side
of the junction, outside the depletion region, the density of electrons in
the conduction band is n
2
1
/N
A
. Conduction band states in the n-side are
occupied but conduction band states in the p-side tend to be unoccupied.
Boltzmann’s Equation 1.30 can be used to find the relationship between
the densities of conduction electrons on the n-sides and p-sides of the
junction and the junction built-in potential. Let N
1
equal the density
of conduction electrons on the p-side of the junction and N
2
equal the
density of electrons on the n-side of the junction. Then using Equation
1.30,
N
2
N
1
=
n
2
i
N
A
N
D
= e
Ψ
o
V
T
Ψ
o
= V
T
ln
n
2
i
N
A
N
D
where V
T
= KT/q is the thermal voltage.
And since potential (voltage) is energy per unit charge and the charge
involved is -q, the charge of an electron, Ψ
o
, the potential of the n-side
of the junction relative to the p-side due to the different doping on the
p-sides and n-sides: Ψ
o
= −(E
2
− E
1
)/q.
The relationship between voltage and electron energy is a point of
confusion. The voltage is the negative of the energy expressed in electron
volts. If electron energy is expressed in Joules, the voltage is the energy
per unit charge, V = −E/q, where the electronic charge is −q. The
minus sign is due to the negative charge on electrons. Where voltage
is higher, electronic energy is lower. Electrons move to higher voltages
where their energy is lower.
If a forward voltage is applied to the junction, it subtracts from the
built-in potential. It reduces the barrier to the flow of carriers across the
junction. Holes move from the p-side to the n-side and electrons move
from the n-side to the p-side. This is the injection process described by
the law of the junction. Boltzmann statistics predicts p
n
(0), the hole
density at the edge of the depletion region in the n-side of the junction
p
n
(0) = p
n0
e
V
a
V
T
(1.31)
where p
n0
= n
2
i
/N
D
is the equilibrium hole concentration in the n-side
and V
a
is the applied voltage. Applying a forward voltage decreases the
energy of the levels on the n-side occupied by holes. Equation 1.31 uses
Boltzmann’s statistics to determine the density of holes on the n-side
of the junction as a function of the applied forward voltage V
a
. With
no applied forward voltage the hole density on the n-side is equal to
the equilibrium density p
n0
. With an applied forward voltage, the hole
energy levels on the n-side decrease and the number of holes increase
exponentially.
Equation 1.31 is referred to as the law of the junction. A similar
equation applies to electrons injected into the p-side.
1.3.4 Diffusion Capacitance
Forward current in a pn junction is due to diffusion and requires a gradi-
ent of minority carriers. For example, in the p
+
n single-sided junction,
current is dominated by holes injected into the n-side. These holes in-
jected into the n-region are called excess holes because they cause the
number of holes to exceed the equilibrium number. The excess holes
represent charge stored in the junction. If the voltage applied to the
diode V
be
changes, the number of holes stored in the n-region changes.
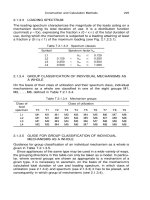
Figure1.7showsaplotoftheholesinthen-regionasafunctionofx.
The number of holes in the n-region decreases from the injected value
at the boundary of the n-region and the depletion region (x =0)to
the equilibrium hole concentration at the contact. The total charge due
to the holes stored in the n-region is the total number of holes in the
n-region multiplied by q, the charge per hole
Q = AqW
B
[p
n
(0) − p
n0
]
2
=
AqW
B
n
2
i
2N
D
e
V
be
V
T
+1
(1.32)
where p
n0
= n
2
i
/N
D
has been used, A is the junction area, and W
B
is the
distance of the n-side contact from the junction. Diffusion capacitance
describes the incremental change in charge Q due to an incremental
change in voltage V
be
.ForV
be
greater than a few V
T
, e
V
be
v
T
1 and the
1 can be dropped in Equation 1.32. Then the diffusion capacitance is
C
diff
=
∂Q
∂V
be
=
AqW
B
n
2
i
2N
D
V
T
e
V
be
V
T
(1.33)
Diffusion capacitance is significant only in forward biased pn junction
diodes where it increases exponentially with applied voltage.
1.4 Diode Current
Diffusion is the dominant mechanism for current flow in pn junctions.
Carriers injected across the depletion region produce a carrier density
gradient that results in diffusion current flow. Holes are injected from
the p-side to the n-side and electrons are injected from the n-side to the
p-side. Current density due to diffusion is a function of the concentration
gradient and of the carrier mobility. Consider the component of current
due to holes injected into the n-region. Current density (amperes per
cm
2
)is
J
p
= −qD
p
dp
dx
(1.34)
where D
p
is the diffusion constant in cm
2
per second, q is electronic
charge in coulombs, and
dp
dx
is the hole concentration gradient in holes
per cm
3
per cm (cm
−4
).
In the short diode approximation, the width of the n neutral region
from the depletion region to the contact W
B
is short, recombination is
neglected. This is true for most bipolar integrated devices where dimen-
sions are less than a few microns. When recombination is neglected, the
holedensitygradientisconstantasshowninFigure1.7.
The hole concentration gradient is the slope of p
n
(x) as shown in
Figure1.7:
Figure 1.7 Holes injected into the n-side of the pn junction become mi-
nority carriers that diffuse across the n neutral region. P
n0
= n
2
i
/N
D
is the
equilibrium density of holes in the n-region.
dp
dx
= −
p
n
(0) − p
n0
W
B
(1.35)
Heavy doping at the contact reduces carrier lifetime and causes the hole
concentration to equal the equilibrium concentration, p
n0
. Using the
law of the junction, Equation 1.31, and Equation 1.35, the hole current
density, Equation 1.34 becomes
J
p
=
qD
p
p
n0
W
B
e
V
be
V
T
− 1
(1.36)
where P
n0
= n
2
i
/N
D
.
There is a similar expression for the current due to electrons injected
in to the p-side. The total current density is the sum of the electron and
hole components
J =
qD
p
n
2
i
N
D
W
B
+
qD
n
n
2
i
N
A
W
A
e
V
be
V
T
− 1
(1.37)
where W
A
is the distance of the contact on the p-side to the depletion
region. Typically one side of the junction is more heavily doped than
the other. For the case where the p-side is the heavily doped side, hole
current dominates over electron current and Equation 1.37 reduces to
J =
qD
p
n
2
i
N
D
W
B
e
V
be
V
T
− 1
(1.38)
The diode current in amperes is the current density multiplied by the
cross-sectional area A
I =
AqD
p
n
2
i
N
D
W
B
e
V
be
V
T
− 1
(1.39)
We now define a process constant called saturation current I
s
where
I
s
=
qD
p
An
2
i
N
D
W
B
(1.40)
Equation 1.39 becomes
I = I
s
e
V
be
V
T
− 1
(1.41)
Equation 1.41 is called the rectifier equation. It describes the pn junc-
tion voltage current relationship. It is the governing equation not only
for pn junction diodes but bipolar transistors as well. For typical inte-
grated circuit diodes and transistors I
s
is quite small (10
−16
is a typical
value). Since I
s
is small, the term in the brackets has to be large for
measurable currents. That means the “1” in the bracket is negligible
and can be dropped for V
be
more than a few V
T
.ForV
be
=0.1 V ,
e
V
be
V
T
=46.8, since V
T
=0.026 V at room temperature. Equation 1.41
becomes
I = I
s
e
V
be
V
T
(1.42)
Small changes in V
be
produce large changes in current. For typical values
of I
s
, V
be
is about 0.7 V for forward conducting silicon diodes.
Example
If V
be
=0.7 V when I = 100 µA, what is I
s
?
Answer
I
s
= Ie
−
V
be
V
T
=10
−4
e
−
0.7
0.026
=2x10
−16
A
1.5 Bipolar Transistors
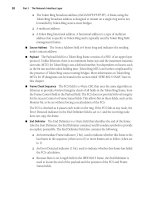
ThestructureofaverticalnpntransistorisshowninFigure1.8.The
transistor is formed by growing a lightly doped n-type epitaxial layer on
a p-type substrate. This layer becomes the collector. The p-type base
is diffused into the epitaxial collector and the n-type emitter is diffused
intothebaseasshowninFigure1.8.Ap-typeisolationwell(ISO)
is diffused from the surface to the substrate. During circuit operation,
the substrate is biased at the lowest voltage in the circuit. This reverse
biases the collector-iso pn junction isolating the collector epi. In nor-
mal operation the base-emitter pn junction is forward biased and the
base-collector pn junction is reversed biased. Since the emitter is more
Figure 1.8 The structure of a vertical npn transistor is shown. The p-type
substrate and iso are held at a low voltage, reverse biasing the substrate-epi pn
junction to isolate the transistor. The high conductivity buried layer provides
a low resistance path for collector current.
heavily doped than the base, the forward current across the base-emitter
junction is dominated by electrons. The electrons injected into the base
cause an electron concentration gradient in the base that results in dif-
fusion of electrons across the p-type base.
1.5.1 Collector Current
The law of the junction, Equation 1.31, expresses the electron con-
centration in the base at the edge of the base-emitter depletion region,
as a function of the voltage applied to the base-emitter junction. It
also expresses the electron concentration in the base at the edge of the
base-collector depletion region as a function of the voltage applied to
the base-collector junction. In the base at the edge of the base-emitter
depletion region, the electron concentration is
n
p
(0) =
n
2
i
N
D
e
−
V
be
V
T
(1.43)
The electron concentration in the base at the emitter is many orders of
magnitude greater than the equilibrium concentration. In the base at
the collector the electron concentration is
n
p
(W
B
)=
n
2
i
N
D
e
−
V
bc
V
T
(1.44)
where V
bc
is the voltage applied to the base relative to the collector.
In normal operation the collector is biased positive relative to the base,
so V
bc
is a negative voltage. The exponent in Equation 1.44 is a
large negative number and the electron concentration in the base at the
collectorapproacheszero.ThisisillustratedinFigure1.9.
Figure 1.9 The gradient of the minority carrier concentration
dn
p
(x)
dx
in the
base determines the collector current.
Electrons diffusing across the base to the collector results in collector
current that depends on the electron density gradient in the base
I
c
= −A
E
qD
n
dn
dx
(1.45)
where A
E
is the emitter area. The minus sign is because I
c
flows in the
negative x direction.
For a transistor biased in the normal operating range, V
bc
is a negative
number and n
p
(W
B
)approacheszero.FromFigure1.9
dn
dx
= −
n
p
(0)
W
B
(1.46)
Using Equation 1.46 in Equation 1.45,
I
c
= I
s
e
V
be
V
T
(1.47)
where
I
s
=
A
E
qD
n
n
2
i
W
B
N
D
(1.48)
and where N
D
is the base doping, donors per cm
3
.
Equation 1.47 describes the collector current as a function of base
to emitter voltage. It is an important equation, widely used in bipolar
circuit design.
1.5.2 Base Current
Bipolar transistors are current gain devices. The collector current is a
multiple of the base current. The current gain β = I
c
/I
b
varies over a
wide range for transistors produced by a given process. Generally better,
higher gains are achieved by reducing base current I
b
. Two physical
mechanisms are responsible for base current. The first is due to holes
injected from the base to the emitter. With the base-emitter junction
forward biased, electrons are injected from the emitter to the base and
holes are injected from the base to the emitter. The electrons diffuse
across the base to the collector where they form the main component
of collector current. Holes injected into the emitter from the base are
the main source of base current. Every hole leaving the base has to
be replaced by a hole from the base contact, thereby producing base
current. Holes are injected from the base to the emitter in order to
maintain the hole density p
n
(0) in the n-type emitter at the edge of the
base-emitter depletion region, predicted by the law of the junction
p
n
(0) = p
n0
e
V
be
V
T
(1.49)
where p
n0
= n
2
i
/N
DE
is the equilibrium hole concentration in the emit-
ter. N
DE
is the donor doping concentration in the emitter.
Holes injected into the emitter diffuse to the emitter contact. Assum-
ing negligible recombination in the emitter, this hole current is given
by Equation 1.41 applied here to hole current in the npn base-emitter
junction
I
b
= I
se
e
V
be
V
T
− 1
(1.50)
where
I
se
=
qD
p
A
E
n
2
i
N
DE
W
E
(1.51)
where D
p
is the diffusion constant for holes in the emitter and W
E
is
the distance of the emitter-base junction to the emitter contact.
Recombination in the base also contributes to base current. Every hole
that recombines with an electron has to be replaced by a hole from the
base contact. This contributes to base current. For modern integrated
circuit transistors, this component is small. Here we ignore it.
The transistor gain β is the ratio of I
c
/I
b
. Using Equations 1.47 and
1.50
β =
I
c
I
b
=
D
n
D
p
W
E
W
B
N
DE
N
A
. (1.52)
High β is achieved by keeping the width of the base W
B
small and dop-
ing the emitter more heavily than the base.
1.5.3 Ebers-Moll Model
The Ebers-Moll model describes the large signal DC operation of the
bipolar transistor. Consider the distribution of minority carriers shown
inFigure1.10.Weareinterestedinthreecomponentsofcurrent:
Figure 1.10 Minority carrier distribution in an npn transistor.
1. I
pe
holes flowing in the n-type emitter.
2. I
nc
electrons flowing in the p-type base.
3. I
pc
holes flowing in the n-type collector.
I
nc
is composed of electrons injected from the emitter that diffuse across
the base and are swept into the collector by the base-collector junction
potential. The emitter current is composed of this current plus holes
diffusing across the emitter
I
E
= −(I
pe
+ I
nc
) (1.53)
The collector current is due to electrons diffusing across the base to the
base-collector depletion region, and holes diffusing across the collector
to the base-collector depletion region
I
C
= I
nc
− I
pc
(1.54)
Here we observe the convention of positive currents flowing into the
transistor. The current flow mechanism is diffusion
I
nc
= A
E
qD
n
dn
dx
= A
E
qD
n
n
p
(0) − n
p
(W
B
)
W
B
(1.55)
Invoking the Law of the Junction, Equation 1.31, to determine carrier
densities
I
nc
=
A
E
qD
n
n
2
i
W
B
N
A
e
V
be
V
T
− e
V
bc
V
T
(1.56)
Similarly,
I
pe
=
A
E
qD
pe
n
2
i
W
E
N
de
e
V
be
V
T
− 1
(1.57)
and
I
pc
=
A
C
qD
pc
n
2
i
W
epi
N
dc
e
V
bc
V
T
− 1
(1.58)
where A
E
is the emitter area, q is the electronic charge, D
n
is the electron
diffusion constant in the base, n
i
is the intrinsic carrier concentration,
W
B
is the base width, N
A
is the base doping, V
T
= KT/q is the thermal
voltage, D
ne
is the diffusion constant in the emitter, W
E
is the emitter
width, N
de
is the emitter doping, A
C
is the area of the collector-base
junction, D
pc
is the hole diffusion constant in the collector, W
epi
is the
width of the collector, and N
dc
is the collector doping.
Rewriting Equations 1.56, 1.57, and 1.58 using constants, A, B, C,
where
A =
A
E
qD
n
n
2
i
W
B
N
A
B =
A
E
qD
pe
n
2
i
W
E
N
de
C =
A
C
qD
pc
n
2
i
W
epi
N
dc
Using the constants A, B, and C in Equations 1.56, 1.57, and 1.58:
I
nc
= A
e
V
be
V
T
− e
V
bc
V
T
I
pe
= B
e
V
be
V
T
− 1
(1.59)
I
pc
= C
e
V
bc
V
T
− 1
Plugging Equations 1.59 into Equations 1.53 and 1.54:
I
E
= A
e
V
be
V
T
− e
V
bc
V
T
+ B
e
V
be
− 1
I
E
= −A
e
V
be
V
T
− e
V
bc
V
T
+ C
e
V
bc
− 1
Note there are only three constants A, B, and C.
If the following new constants are defined:
I
ES
= −(A + B)
I
CS
= −(C − A)
α
R
I
CS
= α
F
I
ES
= −A
then
I
E
= −I
ES
(e
V
be
V
T
− 1) + α
R
I
CS
(e
V
bc
V
T
− 1) (1.60)
I
C
= α
F
I
ES
(e
V
be
V
T
− 1) − I
CS
(e
V
bc
V
T
− 1) (1.61)
Figure 1.11 Ebers-Moll model I
F
= I
ES
(e
V
be
V
T
− 1) I
R
= I
CS
(e
V
bc
V
T
− 1).
Equations 1.60 and 1.61 describe the Ebers-Moll model. A schematic
diagramfortheEbers-Mollmodel,isshowninFigure1.11.Inthenormal
operating range, the base-collector junction is reversed biased. V
bc
is a
negative voltage.
e
V
bc
V
T
=⇒ 0
Under this condition Equations 1.60 and 1.61 become
I
E
= −I
ES
(e
V
be
V
T
− 1) − α
R
I
CS
(1.62)
I
C
= α
F
I
ES
(e
V
be
V
T
− 1) + I
CS
(1.63)
Neglecting the small leakage current I
CS
I
E
= −I
ES
(e
V
be
V
T
− 1) (1.64)
I
C
= −α
F
I
E
(1.65)
α
F
is slightly less than one. The base current is
I
B
= −(I
C
+ I
E
)=I
C
(
1
α
F
− 1) (1.66)
The transistor current gain is
I
C
I
B
= h
FE
= β
F
=
α
F
1 − α
F
(1.67)
When β
F
= 100, α
F
=0.99. For larger β, α gets closer to 1.
1.5.4 Breakdown
When the electric field in a reversed biased pn junction exceeds a critical
value of about 3x10
5
V/cm the junction breaks down causing current
to flow. In breakdown, the junction voltage is stable over a wide range
of currents. A pn junction in breakdown is used as a voltage reference
called a “zener diode.” If current is limited, the junction recovers when
the reverse voltage is reduced. Designers use these zeners for a wide
variety of clipping and protection circuits. Transistors are designed to
operate over a range of voltages without breakdown occuring. In bipolar
transistors, higher breakdown voltages are achieved by reducing collector
(epi) doping.
In the normal operating mode, breakdown in bipolar transistors occurs
at the reversed biased base-collector junction. There are two breakdown
voltages of interest: BV
CBO
and BV
CEO
. BV
CBO
is less than BV
CEO
.
BV
CEO
is the collector-base breakdown voltage with the emitter open.
BV
CBO
is the collector-emitter breakdown voltage with the base open.
Electron-hole pairs are generated at the base-collector junction by the
breakdown process. The collector-base junction electric field moves the
holes into the p-type base. This constitutes base current and is am-
plified by transistor action producing a larger collector current. Holes
accumulating in the floating base raise the base potential. This forward
biases the base-emitter junction, turning the transistor on. Assuming
an avalanche multiplication mechanism, we can derive a relationship be-
tween BV
CBO
and BV
CEO
. As the collector-base voltage V
cb
approaches
the breakdown voltage BV
CBO
currents normally flowing through the
junction are multiplied by a factor M given by the empirical relation
M =
1
1 −
V
cb
BV
CBO
n
(1.68)
Since the avalanche multiplication process increases the collector current
by a factor of M
I
C
= −Mα
F
I
E
h
FE
=
I
C
I
B
=
Mα
F
1 − Mα
F
At breakdown, M =1/α
F
and the current gain h
FE
goes to infinity.
Setting M equal to 1/α
F
and V
cb
equal to BV
CEO
in Equation 1.68
BV
CEO
= BV
CBO
n
√
1 − α
F
≈ BV
CBO
(h
FE
)
−
1
n
(1.69)
BV
CEO
can be substantially less than BV
CBO
. n is between 2 and 4 in
silicon. If h
FE
= 100 and n =3,BV
CEO
is approximately one fifth of
BV
CBO
.
1.6 MOS Transistors
ArepresentationofaMOStransistorisshowninFigure1.12.The
gate-oxide-substrate form the metal-oxide-silicon (MOS) structure. The
Figure 1.12 NMOS Transistor.
aluminum gates of early transistors have been replaced by polycrystalline
silicon (POLY) because poly has a higher melting point. This permits
the gate to be placed before the source and drain. With the gate in place
first, it acts as a mask for the source and drain diffusions, producing self-
aligned structures. The heavily doped poly has a high conductivity. It
behaves like a metal.
Current flow between the source and the drain is controlled by the
gate voltage. For the NMOS transistor shown, a positive gate voltage
attracts electrons to the p-type substrate region between the source and
drain, turning the transistor on. When the voltage applied to the gate is
below a threshold, there are no mobile electrons in the channel between
the source and drain. No current flows. The drain to substrate and sub-
strate to source silicon regions represent two back to back pn junctions,
blocking current flow in either direction. With a positive voltage applied
to the drain relative to the source, the drain-substrate pn junction is re-
versed biased. The source substrate pn junction is forward biased. A
positive gate voltage attracts mobile electrons to the interface between
the silicon and the oxide below the gate. These electrons form the chan-
nel. Channel electrons drifting to the substrate-drain pn junction are
swept across by the drain-substrate junction voltage. This forms the
drain current.
For a channel of mobile electrons to form, the gate to source voltage
must exceed a threshold voltage. The MOS structure is a capacitor
formed by the poly gate, the oxide, and the silicon substrate. A positive
voltage on the gate relative to the substrate results in a positive charge
on the poly and a negative charge in the substrate at the substrate-oxide
interface. Initially, at low gate voltages, the negative charge in the p-type
silicon substrate is due to the absence of positively charged holes. This
negative charge is ionized acceptor atoms. As the gate voltage becomes
more positive, a depletion region forms as holes are repelled by the
positive gate voltage. As the gate voltage increases further, the negative
Figure 1.13 Band bending at the onset of moderate inversion.
charge in the silicon increases to include electrons as well as ionized
acceptors. The electrons are mobile and can contribute to current flow.
A positive gate voltage reduces electron energy in the silicon under the
gate.ThiscanberepresentedusingthebanddiagramshowninFigure
1.13.Withelectronsascarriersinthep-typesilicon,thechannelissaid
to be inverted. It is convenient to define the onset of moderate inversion
to be when the bands at the silicon surface at the oxide interface are
2φ
f
below their values in the bulk away from the surface. The surface is
at a voltage 2φ
f
above the bulk due to the influence of the gate. Recall
that voltage is energy per unit charge. Since electrons have a negative
charge, when electron energy decreases, voltage increases. Also φ
f
, the
Fermi energy, is the position of the intrinsic energy level relative to the
FermilevelinthebulksemiconductorasshowninFigure1.13.
The gate to bulk voltage at the onset of moderate inversion is the sum
of:
1. The surface potential V
s
. This is the voltage at the oxide interface
relative to the bulk.
2. The voltage across the oxide.
3. The contact potential between the gate and the bulk Φ
ms
.
V
GB
= V
s
+ V
ox
+Φ
ms
(1.70)
At the onset of moderate inversion V
s
=2φ
f
asshowninFigure1.13.
The voltage across the oxide is the electric field in the oxide multiplied by
the oxide thickness t
ox
. From Gauss’ law, the electric field in the oxide
is the charge per unit area on the gate divided by the oxide permittivity:
E
ox
= Q
G
/
ox
. The voltage across the oxide is
V
ox
= E
ox
t
ox
=
Q
G
ox
t
ox
(1.71)
Since the positive charge on the gate must be balanced by negative
charge in the silicon and in the oxide
Q
G
= Q
B
− Q
ox
+ Q
I
(1.72)
where Q
B
is the charge due to ionized acceptors in the depletion region.
Q
B
= qN
A
x
d
where N
A
is the substrate doping and x
d
is the width of the
depletion region. Q
ox
is positive charge trapped in the oxide. Here we
assume Q
ox
is all trapped at the oxide silicon interface. Q
I
is charge due
to mobile electrons in the channel. At the onset of moderate inversion,
Q
I
is small and does not contribute to Q
G
. The charge Q
B
, due to
ionized acceptors in the depletion region depends on V
s
, the surface
potential. V
s
is the amount the bands are bent. V
s
is the voltage across
the depletion region. Equation 1.24 describing the depletion region in a
pn junction can be used to determine the width of the depletion region
and the charge Q
B
Q
B
=
2qN
A
V
s
At the onset of moderate inversion V
s
=2φ
f
Q
B
=
4qN
A
φ
f
From Equations 1.70, 1.71 and 1.72
V
GB
=Φ
ms
+ V
s
+
Q
B
− Q
ox
ox
t
ox
(1.73)
Since the gate capacitance per unit area is
C
ox
=
t
ox
ox
V
GB
=Φ
ms
+ V
s
+
Q
B
− Q
ox
C
ox
At the onset of moderate inversion V
s
=2φ
f
.
V
GB
=Φ
ms
−
Q
ox
C
ox
+2φ
f
+
4qN
A
φ
f
C
ox
(1.74)
V
GB
, given in Equation 1.74, is the gate to bulk voltage at the threshold,
when the transistor begins to turn on. When the bulk is connected to the
source V
GB
, the gate to bulk voltage at the onset of moderate inversion
is V
TO
, the gate to source threshold voltage at zero bulk bias
V
TO
=Φ
ms
−
Q
ox
C
ox
+2φ
f
+ γ
2φ
f
(1.75)
Figure 1.14 The gate to body voltage, V
GB
is the sum of the surface po-
tential, V
s
, the voltage across the oxide, Vox, and the body to gate contact
potential Φ
ms
.
where γ =
√
2qN
A
/C
ox
. γ (GAMMA) is the body effect parameter.
The contact potential between the gate and the bulk Φ
ms
contributes
tothegatevoltage.ConsiderFigure1.14.Whenthegateisshorted
to the bulk, V
GB
= 0, there is an internal contact potential that can
be expressed in terms of the positions of the Fermi levels relative to
the intrinsic level in the polysilicon gate and the bulk. In the bulk, the
position of the Fermi level relative to the intrinsic level is φ
f
. In the
gate, the position of the Fermi level depends on the gate material. The
two cases of interest for MOS transistors are polysilicon gates heavily
doped either n-type or p-type. For n-type poly gates the Fermi level
approaches the conduction band and is E
g
/2 above the intrinsic level.
For p-type gates the Fermi level approaches the valence band and is
E
g
/2 below the intrinsic level. When the gate is shorted to the bulk,
charge moves and the energy bands adjust so the Fermi levels will be
the same in both materials. This results in a contact potential of
Φ
ms
= ±
E
g
2
− φ
f
(1.76)
where E
g
/2 is positive for p-type poly gates and negative for n-type
poly gates. When the gate is a metal instead of polysilicon, this contact
potential would be expressed as the difference in the work functions of
the gate and bulk.
In the complementary metal-oxide-semiconductor (CMOS) structure
showninFigure1.15,NMOSandPMOStransistorsworktogetherto
realizecircuitfunctions.Figure1.15showsoneCMOSimplementation
with an NMOS transistor in a p-well and a PMOS transistor in the
n-type epitaxial layer. While most of the discussion in this chapter
involves the NMOS transistor, the PNOS transistor functions in the
same way with the difference that diffusion types are reversed. N-type is
replaced by p-type, and p-type is replaced by n-type. Voltage polarities
and current directions are also reversed. Current flow in the channel of
PMOS transistors is due to holes rather than electrons. As more holes
are attracted to the channel, the more negative the gate to source voltage
becomes. This complementary nature of NMOS and PMOS transistors
is useful in the design of analog and digital circuits.
Figure 1.15 CMOS structure.
1.6.1 Simple MOS Model
A simple model for the MOS transistor, useful for hand calculations, can
be derived by considering the channel to be a variable resistor whose
value depends on the gate to channel voltage, then summing the voltage
across this channel resistance from the source to the drain.
Here we use the source as the voltage reference point by setting the
source voltage equal to zero. With the source as the voltage reference,
V
g
= V
gs
. The drain current I
D
flowing in the channel causes the channel
voltage V
cs
, and therefore the gate to channel voltage V
gc
to be a function
ofthedistancexfromthesourceasshowninFigure1.16.V
gc
is the
voltage across the oxide. The channel consists of electrons attracted by
the positive gate voltage. The mobile charge in the channel is
Q(x)=C
ox
(V
gc
− V
th
) Coul/square meter (1.77)
where C
ox
is the capacitance of the gate oxide per unit gate area. The
channel does not exist until V
gc
is greater than the threshold voltage
V
th
. That is, V
gs
− V
cs
− V
th
> 0. Also the maximum value of V
cs
is
Figure 1.16 The channel resistance varies with x because channel voltage
and therefore mobile charge varies with x.
V
ds
. Therefore, since the largest value of V
cs
is V
ds
, V
gs
− V
th
must be
greater than V
ds
for this derivation to hold. Otherwise, at the drain end
of the channel where the channel voltage is the greatest, there will be
no mobile charge. The resistive channel can be represented as a series of
small resistances dr. The current I
D
flowing through these resistances
causes the voltage drop in the channel. The voltage across each of these
incremental resistances is dV
cs
= I
D
dr where dr = dx/(σtW) where W
is the width of the gate and σ is the conductivity of the channel and t
is the effective channel thickness.
σ = charge per unit volume times the mobility
σ =
µQ(x)
t
where Q(x) is the mobile channel charge per unit gate area. Q(x)/t is the
mobile channel charge per unit volume. Therefore, dr = dx/[µQ(x)W ].
Using Equation 1.77 for Q(x)
dV
cs
=
I
D
dx
µW C
ox
(V
gs
− V
cs
− V
th
)
Rearrange and integrate
L
0
I
D
dx =
V
ds
0
µW C
ox
(V
gs
− V
th
− V
cs
) dV
cs
I
D
= µC
ox
(W/L)
(V
gs
− V
th
)V
ds
−
V
2
ds
2
V
ds
<V
gs
− V
th
I
D
increases as V
ds
increases to a maximum value that occurs when
V
ds
= V
gs
− V
th
.
Saturation
Drain current is self limiting. As the drain to source voltage V
ds
increases, drain current increases. This increases the channel voltage
reducing the gate to channel voltage and the mobile channel charge.
When V
ds
>V
gs
− V
t
, Q(x) vanishes at the drain end of the channel
causing the transistor to operate in the saturation or constant current
region. Voltages applied to the drain are absorbed across the channel-
drain depletion region where no mobile charge exists. The drain is more
positive than the channel. Channel electrons entering this depletion
region are swept into the drain by the built-in potential and the voltage
applied to the drain. Since increases in drain voltages appear across the
drain-channel depletion region, channel voltages and therefore channel
current does not change with drain voltage. The drain current remains
constant with changes in drain voltage.
With all voltages referenced to the source, V
g
becomes V
gs
and the
drain current is
I
D
=
µ
n
C
ox
(V
gs
− V
th
) V
ds
−
V
2
ds
2
V
ds
≤ V
gs
− V
th
µ
n
C
ox
2
(V
gs
− V
th
)
2
V
ds
≥ V
gs
− V
th
(1.78)
Equation 1.78 is a simple model useful for hand calculations.
1.7 DMOS Transistors
Double diffused MOS (DMOS) transistors rely on the control of the
lateral diffusion to achieve short channel lengths. One implementation
isshowninFigure1.17.Polysiliconisgrownoverathinoxideanda
small hole is etched in the polysilicon. A p-well is diffused through the
hole into the n-type epitaxial layer. The p-well diffuses laterally as well
as vertically into the epi. The center of the hole is masked and a second
diffusion is done. This time the n-type source is diffused through the
hole. These two diffusions define the MOS transistor. The epi acts as
the drain. The channel forms in the p-well between the source and the
epi drain. The length of the channel is the difference between the lateral
diffusion of the p-well and the source. The width is approximately the
perimeter of the hole in the polysilicon. A heavily doped P-diffusion is
placed in the center of the device through the n-source diffusion to the
p-well. This diffusion is used to make contact with the p-well. The hole
is then covered with metal. A metal contact shorts the p-well to the
Figure 1.17 A double diffused DMOS transistor is fabricated by diffusing
first a p-well into the n-type epi through a hole in the polysilicon. A second
n-type diffusion forms the source. The epi acts as drain and the channel forms
in the p-well. Channel length depends on lateral diffusion of the p-well and
the n-type source.
source. The drain contact is made to the epi. Arrays of these devices
result in efficient layouts for power transistors.
1.8 Zener Diodes
Pn junctions operating in breakdown are used as voltage references and
in clipping and clamping circuits. The breakdown voltage varies in-
versely with the square root of the doping in the lightly doped side of
the junction, as described in Equation 1.26. If a zener is to survive
breakdown, it is important that the current be distributed across the
cross-sectional area of the junction. Doping and electric field nonuni-
formity results in breakdown occurring first where the doping and the
electricfieldarelargest.Thedeepburiedlayerisozener,showninFig-
ure1.18,hasasmoothcross-sectionalareawithauniformdistribution
of dopants. Currents tend to be distributed over a larger area than in
thesurface,shallow-nshallow-pzenershowninFigure1.18,wheredop-
ing varies with distance from the surface and has sharp corners where
the electric field is large. These zeners are destroyed by large currents.
They fail at corners near the surface. If the current is limited by ex-
ternal circuits so that power dissipation in the junction is maintained
within safe limits, the junction is not damaged. Pn junctions operated
in reverse breakdown are called “zener diodes” and are used as voltage
references or in clipping and clamping circuits for protection of sensitive
structures.
Figure 1.18 A. The deep lying pn junction formed by the buried layer
and the isolation diffusion breaks down at about 12 V and can conduct large
currents. B. The pn junction formed at the surface using shallow-n (SN) and
shallow-p (SP) diffusions breaks down at about 6 V.
1.9 EpiFETs
Large value resistors can be achieved by enhancing the sheet resistance
of the epitaxial layer with a junction field effect transistor called an
epiFET.
Figure 1.19 Current flow in the n-type epitaxial region is restricted by the
depletion region associated with the base-epi pn junction. Sheet resistance of
the epiFET can be significantly higher than the epi sheet resistance.
P-typebasediffusion,showninFigure1.19,inthelightlydopedn-
type epitaxial layer(epi) forms a junction field effect transistor(JFET).
Current flowing in the epi is modulated by voltages on the P-type base
diffusion acting as the JFET gate. The depletion region associated with
the base-epi pn junction increases in size as the gate becomes more nega-
tive relative to the epi. As the width of the depletion region increases, it
penetrates further into the epi, robbing the epi of carriers. This reduces
current flow in the epi creating an apparent increase in epi resistance.
The width of the depletion region x
d
increases when the epi to gate volt-
age increases. Since the drain is at a higher voltage than the source, the
depletion region is wider at the drain. Current tends to be self-limiting,
asshowninFigure1.20,sinceitincreasestheepivoltageandtherefore
Figure 1.20 Measured epiFET characteristics are shown. The threshold
voltage VTO is about -20 V. The constant current region is Vds>Vgs− V
th
.
For Vgs= −3, the constant current region starts at about Vds=17V . [7]
the width of the depletion region. No buried layer is present because it
would short out the epiFET.
In a typical configuration three regions, the gate, isolation well and
the substrate are connected to the negative supply. As the epi becomes
more positive, the depletion regions from all three regions extend into
the epi reducing the cross-section for current flow.
1.10 Chapter Exercises
1. Calculate the resistivity of silicon doped with 5x10
18
phospho-
rus(group 5) atoms per cubic centimeter. Assume total ionization.
2. Calculate the conductivity of intrinsic silicon.
3. Show that
J
n
= qµ
n
E
is equivalent to Ohm’s law.
4. Calculate the position of the Fermi level relative to the intrinsic
level for the silicon in problem 1.
5. A silicon wafer is doped with 10
16
acceptors per cm
3
and then
doped with 5x10
17
donors per cubic cm
3
. What is the resistivity?
EstimatemobilityusingFigure1.2.
6. Consider a silicon pn junction. The p-side is uniformly doped with
10
18
acceptors/cm
3
. The n-side is doped with 10
16
donors/cm
3
.
•
Whatisthebuilt-inpotential?