A Basic Guide for valuing a company phần 10 ppsx
Bạn đang xem bản rút gọn của tài liệu. Xem và tải ngay bản đầy đủ của tài liệu tại đây (147.26 KB, 35 trang )
260 ‘‘Dot-Com’’—Information Technology
always differentiated in business valuation has been tangible asset value
and intangible asset value as homogenous components of a collective
value—to wit, hard assets as employed to produce cash flows producing
total values. But as any small-business owner or serious-minded small-
business buyer/seller can attest, that handy-dandy loan-to-value ratio of
one’s friendly banker does not get elevated much over collateralizing what
can be touched and felt (tangible property). Fair market values of hard
assets will continue for some time to call the shots in terms of borrowed
capital from the host of banking institutions. But means for borrowing
shifted. Why? The new kid on the block: intellectual property.
The online technology era has elevated Angels and Venture Capitalists
(VC) into their full glory. Few traditional lending sources are incorporated
to accept the high risks associated with lending on intangible assets, and
the dreams of would-be entrepreneurs. Differing from traditional lenders,
Angels and VCs often take ownership stakes in ventures funded. Holding
these ‘‘equity’’ positions gives them the perfect right to get in one’s face,
even when things appear to be going well. The VC is commonly the highly
educated and competent financial person, but tends to lack hands-on op-
erating skill. On the other hand, the Angel is most apt to be the high-net-
worth individual with direct hands-on management experience. Unlike
traditional lenders, VC and Angel alike hasten for quick returns from their
vested capital. The exit objective for both is generally five to seven years
(i.e., impatient capital). Exit strategies target public offerings of stock
(IPOs) or the enterprise’s outright sale. From the date of birthing, the
dot-com founder was forced into maintaining high focus on satisfying
investors’ short-term needs versus long-term operation—not that he or
she hadn’t been interested in the quick-buck-and-out all along, too. The
arena is now full of the walking wounded—or the dead. Many r emaining
founders are disillusioned, disheartened, or downright discouraged. Ac-
cording to numerous articles, it seems those outfits faring best are the
ones who self-funded or used other ‘‘patient’’ capital and stuck to old
concepts of planned long-term growth. Venture Capitalist, Angel, and
founder greed played a major role in launching a host of ill-conceived
ideas. The teacher has taught.
Why so much failure cresting at once? Prosperous times, for one reason.
Another, summed by something heard at an MIT Capital Forum near the
peak of this period: ‘‘Too much money chasing too few good deals!’’ You
don’t experience such widespread business failure until two or more ele-
ments play in the game. Running a business becomes a financial matter
only after you have gained sufficient customer-buying to cause sales to
generate expenses, the need to pay the bills. During its launching stage,
Why Is It So Difficult to Pick Winners? 261
a potential business must remain steeped with marketing concentration.
Pure financial people do poorly assessing this early stage development. In
this instance, the right hand (entrepreneurs) and the left (investors) re-
mained yards apart in their (mis)understanding of each other’s skills. In-
vestors trusted too much to the pr eexistence of entrepreneurial knowledge
that did not exist. Entrepreneurs trusted too much that investors would
provide links to gaps in essential knowledge. Financial people do far better
at assessing the overall concept once businesses gain performance histo-
ries. Huge mistakes were made by valuation tacticians who had little or
no hands-on experience with the general management scenario. ‘‘Com-
parable sale’’ comparison as the benchmark in the valuation model proved
abysmally inadequate to estimating a dot-com business’s worth. In fact,
history now shows that the comparable sale method only multiplied upon
the original error.
Thanks to information technology, this past decade has ushered in an
explosion of new intellectual property. One of the fundamental changes
wrought by information technology is the availability of data unprotected
by the traditional barriers of time, space, and matter. This liberating effect
also creates significant risks. If you can gain access to the information of
others on computers all over the world, then so can others gain access to
your information on your computer and in your communications. For
aeons, key information of the successful business derived and held onto
its value by that information not being widely known. Now, the new risk
for getting into and staying in business is against the priority that every-
body can know everything about ever yone else. Copyright and patent laws
go far toward guiding proprietary data, but once the cat is out of the bag
and trade secrets are lost, they no longer provide the catalyst to the added-
value once planned.
Highly suspect to any valuation undertaking must be a thorough ques-
tioning of the foundation on which all forecast financial data are based.
Of the six or seven major reasons attached to dot-com failures, overestimating
consumer preference/demand and underestimating the cost of acquiring cus-
tomers rank at least third and fourth. We in the valuation trade always
thought we had a good grasp on evaluating the marketing elements of
new enterprise, but experience now r eveals we didn’t know nearly enough,
or we didn’t engage our knowledge. Thus, we, too, contributed to dot-
com failures.
Of the six or seven major reasons attached to dot-com failures, the re-
mainder cling tightly to human error, for example, clueless overspending
done in unaffordable places, seeking to attract ill-defined customers; a
failure to understand the industry in which the dot-commer chose to do
262 ‘‘Dot-Com’’—Information Technology
business (in fact, a demonstrated blatant expectation they could compete
against established brick-and-mortar players without needing in-depth
knowledge about the industries they entered); a gross lack of real-world
knowledge about how business works; abominable fiscal controls, or none
at all; and just about every failed dot-com never really got to flight because
they couldn’t execute ideas even when concepts were generally good ones
at the get-go. The one reason that sticks out foremost to me is the failure
to ensoul business ambitions by surrounding their dreams and efforts with
people who possess strengths greater than their own. The talent issue!
The methods for starting any new enterprise have not changed. The
quality of its founder; the character of its customers and marketplace; the
capital and environment to do what must be done—these are still the
essential ingredients for moving any business idea forward. For a time, we
(the host of us) all forgot these primary rules.
The Japanese way to learning: ‘‘If you want to know something, you
must become one with it.’’ My father captured it this way: ‘‘If you ever
wannna learn about something—really learn about it—you have to com-
mit something that makes you stay glued to the learning experience.’’ In
this case, I invested dollars in the dot-com arena and stuck around for
what became a wild ride. Mesmerized like many, I, too, made pretty good
bucks before being shaken back into reality. In time, I lost pretty much
what I’d earned. With more time, I learned not to be stupid. What hasn’t
changed is the investor’s eventual need for sanity at the bottom line, that
tangible factor of quality returns for invested capital. Nature’s law may be
‘‘what goes up must come down,’’ but business investors follow the lateral
law: ‘‘What goes in must come out (with greater value upon exit).’’
Focus on Factors That Drive Markets to
Know If You Have Any Business to Value
at All
‘‘Just about anyone you ask will give you just about any kind of
answer. Ask the unqualified person and you’re just about done.’’
‘‘You cannot be conquered from without until you have destroyed
yourself from within.’’
Rome
Focus on Factors That Drive Markets 263
What Should My Business Be?
As simple as this question sounds, few people in business ask it. That’s
most unfortunate, because not knowing the answer is a major reason that
businesses fail. Peter Drucker coined the phrase this way, ‘‘Indeed, the
question looks so simple that it is seldom raised, the answer seems so
obvious that it is seldom given.’’ A real-estate business sells real estate. A
furniture manufacturer sells furniture. A paint store sells paint. A dot-
commer might operate via technology, but it does not sell technology. Most
are either retailers or distributors, not too unlike brick-and-mortar com-
petitors. Dot-commers are not invisible to competitors, and they certainly
compete in the same arena for the very same consumer purchases.
Amazon.com is a giant distributor and retailer differing mainly by its
lack of a traditional storefront. But its need for warehousing space, ship-
ping and handling, and support staffing does not vary in cost structure
from its brick-and-mor tar cousins.
So really, what does Amazon.com sell? Books and their other product
lines? I think almost definitely not. Sure, books and so forth are bought
at Amazon.com, but most customers shop there for the simple conve-
nience—avoiding the traffic and parking hassles common to visiting store-
front shops. Thus, when building an Amazon.com-like customer model,
one must segregate unto its own model only for those customers who
might be most motivated to purchase for convenience reasons.
Anyone can buy books through one of hundreds of bookstores pep-
pering the landscape, in nearly every town in the world. Talking face to
face with dealers lulls us into believing that customer service in general
will remain within our control. This is the shopping model most of us
grew up using. Buying ‘‘blind’’ is still quite foreign to most shoppers, and
although attitudes ar e changing, something extra must be provided to
hook the new adventurer into online purchasing. Purchasing regularity is
even more key to building the long-range sales model, but getting the
customers is only one thing. Keeping them coming back is another. So
the plan for customer r etention must be reliable. Consistent and excep-
tional customer service is essential—actually, the unique handling of cus-
tomer needs is more important still. And because nearly anyone can learn
nearly everything about everyone else on the Internet, explicit assurance
of the privacy of credit card numbers and other financial information used
to make purchases must be given. Minimizing returned merchandise is
key to the least-cost modeling. Examine most closely the thought behind
the planning. Wrapped and tied-up-in-a-bow plans reflect merely the ef-
fect of whatever thoughts went into them. Evaluating ‘‘effect’’ is a mean-
ingless wandering away from finding truth.
264 ‘‘Dot-Com’’—Information Technology
‘‘The thought behind all things which is the cause of all things.’’
Walter Russell
Not too many years ago nearly everyone in small and large towns and
cities alike needed to schedule the purchase of almost every commodity
around nine-to-five business hours. Today, nearly everything anyone
could want is available at nearly any hour. Products and services have taken
on so many added varieties, and new items being introduced every day
make choice a complex and wearisome process for customers. Businesses
that are formed today without the most clairvoyant of purposes simply
get lost in the maze of brick-and-mortar enterprises. Information tech-
nology only layers another jungle on top of the maze for shopper con-
fusion. So many available customers will only divide into so many
competitor outfits so many times. Only founders unique in purpose and
direction will find paths out of this jungle.
Generational Influences Affect Markets
Generational preferences, attitudes, and habits play a crucial role in shap-
ing consumer trends. What’s funny, what’s stylish, what’s status, what’s
taboo, what works, and what doesn’t vary by generation. The dot-com/
online buying arena is impacted more significantly than all other types of
businesses by the generational split in buying habits. Why?
First, 46 percent of U.S. households are without computers. Non-
computerized households worldwide range downward from 86% to 29%
as the average. Those who do not own a computer, or own a computer
but are not connected to the Internet, are unlikely to be customers in the
dot-com/online buying arena. We all know that computer ownership is
more often found in younger family households. Much of the world’s
older population is not comfortable using this technology. Still, the
world’s older population may be among the most avid book consumers
(sticking to Amazon.com-type purchases). It is important that the cus-
tomer profile factor in the impact of unavailable technology on the overall
business model.
The vast majority of buying online is done through credit card pur-
chase. While these cards are relatively easy to obtain in this day and age,
they are just as easy to lose. Prevailing economic status within age cate-
gories must be factor ed into the customer profile. Young people, who
may be the most excessive and impulsive of all spenders, may also be
unlikely to meet minimal financial standards for credit card ownership.
Focus on Factors That Drive Markets 265
We’ve known for years that getting the customer model down pat is
the critical basis for business forecasts—the crux for the long-term success
of any enterprise. However, interpreting even well-assembled market re-
search can be like reading tea leaves to the novice, and the dot-com arena
oozed with its high share of untrained adventurers.
As co-founder and longtime advisor to a successful seed-capital invest-
ment exchange/technology forum, I’ve reviewed the business plans of
hundreds of would-be owners. Some get funded—most do not. The fol-
lowing reflects the primary reasons why Angels might refuse to fund a
business plan.
1. Failure to define customers clearly
2. Failure to reveal exciting management planning
3. Failure to define—clearly—the mission and product or service
4. Failure to include a plan to attract and hold employees whose sat-
isfaction is measured in responsibility and accomplishment, not
wages
5. Failure to display entrepreneurial smarts and ambition, not luck
6. Failure to identify and demonstrate how alternative opportunities
might present themselves, and what plan of action would be con-
templated
7. Lack of assessment of industry trends and the prognosis for sliding
into niche markets
8. Lack of thorough assessment of competition as such plays into the
proposer’s plan for success
9. Failure to systematically identify horizontal trends af fecting a prod-
uct or service
10. Failure to systematically describe how marketing and sales will be
accomplished. More specifically, a marketing plan without a de-
scription as to how $1 of sales in the financial plan has been ex-
pectantly achieved.
11. Failure to budget for costs of new infrastructure with growth
12. Too focused on overall profits, versus a budgeting of cash require-
ments on a daily and/or monthly period (unwillingness to rec-
ognize and accept that cash flow, rather than profit, matters most
to enterprise)
266 ‘‘Dot-Com’’—Information Technology
13. Failure to reconcile monthly profit/loss forecasts with actual pay-
able and receivable practice (commonly shows up in plans as out-
of-control spending)
14. Lack of succession planning—particularly, step-aside strategy for
if/when the business reaches beyond the capability, or interest, of
the founder
Peter Drucker said, ‘‘So many new businesses start out with high prom-
ise. They do extremely well the first year or two and then suddenly, are
up to their ears in trouble. If they survive at all, they are forever stunted.’’
Big, small, tiny, or still the dream, there simply is no way to avoid the real
world.
As we age, we carry yesteryear’s comforts and thought patterns with
us. These were inconsequential to the business environment until the ex-
ponential growth in communication and the advent of medical miracles
gave each new generation a longer lifespan. The following section high-
lights specific differences between generations and why generational pref-
erence must be so thoughtfully considered when developing the customer
profile.
Matures Born 1909 to 1945 Very slow at relating to new prod-
ucts and change
Factors affecting: Great Depression, New Deal, WWII, GI Bill. Grew
up during tough times. More constrained set of expectations—dis-
cipline, self-denial, hard work, obedience to authority, financial
and social conservatism.
Example: With excessive talking, my dad used to say, ‘‘Son, you go
on like a br oken record. You sound like you were vaccinated with
a phonograph needle.’’ I understood this because I owned and
played a phonograph. My children, on the other hand, grew up
in an era where music is played from a CD burned on a computer.
They have no concept of the phonograph; thus, will not really
understand statements such as my dad used with me.
Example: (social conservatism) One of my sons, not married, lives
with his girlfriend and they have a child—marriage is not being
contemplated. To his grandparents that was a real taboo and pur-
pose for outcast.
Focus on Factors That Drive Markets 267
Baby Boomers Born 1946 to 1964 Born to prosperity—they take
most things for granted.
Factors affecting: A great society, general economic prosperity, expan-
sion of suburbia, Nixon, color TV, sexual liberation. It’s the ‘‘me’’
generation, built on the sense of entitlement. Most pursue personal
goals with a vengeance and tolerate nothing short of instant grat-
ification. Great customers to have!
Generation X-ers Born 1965 to 1987 Bore easily and will trek
next door for products NOW!
Factors affecting: Divorce, AIDS, Sesame Street, MTV, crack cocaine,
Game-Boy, the PC. It’s the ‘‘why me?’’ generation. Wary and un-
certain, but savvy and enthusiastically ready, willing, and able to
take on new challenges they face. Curiously, X-ers embrace some of
the values of Maturers.
Generation To Be Named (Generation Y?) Born 1988 to present
This generation’s preferences cannot yet fully be known. The oldest
member is perhaps aged 13. An important input to modeling,
however, because this fledgling generation holds the tightest grip
on longer-term future sales of any business just starting out today.
The start-up, with no funds to spar e, cannot misstep by not iden-
tifying this generation’s reactions to product introductions.
Each generation’s communication model varies with the conditions
prevailing in the world around them as they grew up. 1987’s Black Mon-
day is significant to me, but to individuals entering college this fall (born
1980–1981), it’s no more relevant than the Gr eat Depression of 1929.
These youngsters were 11 years old when the Soviet Union broke apart.
They are too young to remember the Challenger space shuttle blowing
up. Stamps have always cost 32/33/34 cents. The compact disc was in-
troduced when they were 1 year old, and the expression ‘‘you sound like
a broken record’’ means nothing because they have never operated a rec-
ord player. The movie Star Wars looks very fake to them and the special
effects are pathetic. Over half of this generation will complete college (in
my era, the rate was around 15%).
And add these data to deliberations: By 2015, Matures will be aged 70
to 106; Baby Boomers, 51 to 69; and Generation X-ers, 32 to 50. The
new segment (Generation Y?) will be between 20 and 31. The forecast is
for roughly 63 million in this new generation—5.8 million more than in
268 ‘‘Dot-Com’’—Information Technology
their mother’s and father’s Gen-X. This math doesn’t compute. The birth
rate was down in Gen-X. As of July 1, 1990, the median age was 32.8
years. By July 1, 2015, the median age is estimated to move up to 37.3.
The total U.S. population is expected to grow from about 250 million to
over 310 million in this period. On the one hand, our population is ex-
pected to live longer and include more of us; but on the other, the young
population—having had fewer children—is expected to increase by nearly
20 million? How is that possible? Look closely at U.S. immigration plans.
My guess is that we will import most of this growth. Serious discussions
are already under way in D.C. The government has targeted mostly well-
educated tech types—immediately job-capable folks who hit the U.S.
streets bringing in good paychecks and paying taxes from day one.
Assuming that all customers behave in the same manner can be a serious
mistake. We must always be on guard to avoid one-dimensional strategies.
Marketers who pay close attention to generational marketing and consider
all external changes to target-market populations usually thrive and grow.
How Would I Find You If I Didn’t Know About You?
The key to drawing customers to a website is to give them a variety of
options to access the site. To that end, one must utilize both online and
offline marketing techniques, and also find ways to integrate the two so
that they complement each other.
Off-site marketing is only marginally available for the start-up that has
not acquired deep pocket resources. But even when given the resources,
too many start-ups squander more than they can afford, and spend inef-
fectively. While off-site marketing can be quite effective, there is no real
way to tell who is receiving the message, or if they are even active Internet
participants. Each source for off-site marketing maintains demographics
of their listening, viewing, or reading audiences. The dot-commer must
target offline advertising dollars carefully and then only spend where ad-
vertising hits audiences that are most in line with its own customer pro-
files. My sampling size was too small to project meaningful statistical
incidence, but overspending on off-site advertising prevailed in 19 of 21
online failures studied. At least eight recent articles on dot-com failure
highlight overspending on offline advertising among major reasons for
demise.
Eighty to 85 percent of traffic arrives at a website because an interested
individual was able to locate the site online. Internet market research firms
claim that 70 percent of all online traffic will arrive at the new site through
major directories (e.g., Yahoo!, Look Smart, and The Mining Co.) or
Focus on Factors That Drive Markets 269
through search engines (e.g., Alta Vista, Excite, HotBot, InfoSeek, and
Lycos). Unfortunately, it’s not just as simple as connecting up with any
directory or search engine. The web host-selection problem is not really
different from radio stations and the music played to listening audiences.
Individual stations take great effort to appeal largely to a specific listening
group (country and western, blues, jazz, rock, etc.). Online directory and
search engine hosts seek to minimize competition by appealing to defined
segments of the market; therefore, situating the new website cannot be
left to random positioning.
How consumers learn about a site or are directed to a site should be
detailed through formidable architecture that shows alternative planning
for the failure of original actions to target consumers effectively.
Who Is the Customer?
There is only one purpose for starting a business: to create customers! Are
customers male, female, or taken from both sexes? Do customers come
from the Mature, Baby Boomer, Gen-X, or Gen-Y demographic? What
primary territory might draw the most customers? What features or bene-
fits do customers expect in the product or service? Will they be repeating
customers, and if so, how often will they buy? What buying motivations
would cause them to buy from me (online)? Is ther e something I can do
to my product or service or website that would stimulate increased buying
(e.g., color and psychographic components of design or packaging)? Will
this batch of customers be profitable? Dot-commers did far too much
guesswork constructing customer profiles. They also expected too much
draw from the techno curiosity factor, expecting customers to come shop
at a website just for the technology reason alone. Inadequate thought was
given to how the customer definition changes in the no-see-um environ-
ment of online marketing.
As the old saying goes, ‘‘Garbage in, garbage out.’’ Reasonably pre-
dictable sales and expense forecasts have always hinged on some basic
premise of truth. This should not have been news! This is elementary
statistics—high school stuff—yet, they (and we) missed it! Vis-a-vis, a lack
of talent issue. Building a business plan is first the test of a hypothesis for its
containment of customer reality. And second, if passing on its fundamental
principle, it is a projection outward from one source of truth. Sadly, with
too much hope and idle prayer for an idea, the first step is too often
skimmed over entirely. Only when the profile of the most ideal (and most
likely) customer has been well framed can primary, secondary, and tertiary
customer profiles be adequately developed. Sales forecast may then be ex-
270 ‘‘Dot-Com’’—Information Technology
trapolated—one customer at a time—from each of these ranks. But these
data remain characteristically unreliable until passing safely beyond bom-
bardments from the realities found in market demographics, real-world
competitions, factors of (or inhibiting) supply and demand, conditions of
prevailing and future economies of scale, issues of production and/or
distribution, and, undeniably, the reasonable availability of proper talent
to execute plans for accomplishment.
Who Is the Competition?
There is only one proper and safe assumption to hold sacred about the
competition: Great ideas attract vultures! Someone else will develop the
better mousetrap the day after any new product goes into production. A
competitor’s ease of market entry is the cancer to launching and holding
on to ideas. The only surefire defense lies in knowing more about them
than they know about you. Once all is launched, the brass ring for success
eventually goes to the one maintaining the most unfair advantage over
all the other competition. There is no end to anxieties drafted from the
competition unless one knows their strengths and weaknesses. It is careless
to attack the greater strength. Niche market holders sift through com-
petitor weaknesses to match against strengths in themselves for seizing
upon the unfair market advantage.
What Makes the Customer Buy from One Business over
Any Other?
Customer loyalty is a figment of the imagination for anyone who thinks
such an animal exists. Customers are only loyal to the vision they see
through their own eyes. Roadblocks to the mounting of sales come down
to three generic essentials: price, quality, and service being offered. Rarely,
if ever, will any business possess all three to advantage. The price advantage
(mass merchandising, for example) usually gives up quality or service or
both, the service advantage might give up price and possibly quality, and
the quality advantage most likely gives up price and might give up service.
These distinctions identify how consumers view dealing with any business
through their eyes. Planned architecture that fails to realize how the con-
sumer personally views the total shopping experience at a new enterprise
also reveals the initiate’s lack of thought about going into business.
Time, space, and matter do still apply at the point of purchase. Early in
the dot-com buildup, founders learned that deeper discounts than antic-
Summary 271
ipated were needed to jump-start consumer buying. They also gradually
learned that discounted selling would remain the high need in the con-
sumer model. Giving then reneging doesn’t work. Thus, they should also
have known that the most initial competition would come from the mass-
merchandiser, the deep-pocket specialist in discounted merchandise. It’s
doubtful that a gnat on the back is worrisome to any elephant. Wal-Mart,
for example, is the leader in wholesale leveraged buying. They can afford
to discount and still maintain profitable margins. The dot-commer can
neither buy nor sell on such competitive margins and stay whole. Attack-
ing service or quality or both might have led to better choices.
Summary
Time is the precious commodity that creates wealth. Time to make, to
package, to deliver, to retool, and to repeat the processes over and over
again pits every business owner against everyone else in the game. The
more efficient they become with their time, the more they hold an ad-
vantage over everyone else. Milt Friedman said that inflation is too much
money chasing too few goods. During past eras, inflation of this sort was
more in evidence because of the time limitations on production. Today,
information technology equals saving time, cutting costs, increasing prof-
its, and decreasing error and waste.
Every corner of the globe is now the shopping haven for even the least-
traveled among us. Click a mouse today and you are anywhere in the world
you want to be. Computers are becoming as commonplace in the house-
hold as knives and forks. In a decade, nearly everyone will be using them
more than the phone. In two decades, few people will remember when
we didn’t have them. Space, once the constraint of doing nearly every-
thing, will only advocate definition for traveling outside our universe.
Teleporting matter becomes real. Products and services extended by a
thread, through data bytes, will weave the new shopping interface into
common habit. When we do go out to shop, it will be for the antique
experience. Behemoth real-estate structures will not be needed to house
the increasing thousands working from their homes. I know this last par-
agraph may sound a bit ridiculous, but the framework is already in place,
and for even more unthinkable events to happen to life and the shopping
experience.
If any great change occurs in the equation for how we value companies,
it will lie in how we view present and future usages of time, space, and
272 ‘‘Dot-Com’’—Information Technology
matter in business operation. It will lie in how we keep up with changes
made possible through information technology for consumer purchasing.
It will lie in how we view the impact of increasingly savvy tech-oriented
competition. It will lie in how we as tacticians comprehend the growth of
the New Era business enterprise. It will lie in how well we learn what we
don’t now know. The math for doing valuation work doesn’t change, but
the people doing the math must. I know we will both learn and make
essential change.
Thus, on a Minor Note
Stock market activity has been a barometer on how well we have come to
accept change. Values have risen from P/E ratios of 15 to as high as 40
in terms of safety margins investors will accept. What investors accept
conditions what valuation tacticians do.
Louis Rukeyser’s March 2001 ‘‘hype and buy-me newsletter’’ carried
the headlining question, ‘‘Are Technology Stocks Dead?’’ I loved his re-
sponse: ‘‘My Answer is ‘BULL!’ ’’ He went on, ‘‘Anyone who hasn’t
noticed that Wall Street has a perennial penchant for panic clearly hasn’t
been paying attention. Tighten the screws for a few hours, and fear beats
greed by a landslide.’’ A new crop of better developed, better funded, and
better managed online technology businesses will come out of the embers.
However, I disagree with Mr. Rukeyser’s thoughts about fear beating out
greed (for too long), because the market-watchers and players were still
plunking down cash in the NASDAQ as recently as just a few days ago.
On March 12, 2001, fear hit again; it can’t help but return. But greed
only sleeps for a while. It, too, r eturns.
Case of Shot Myself in the Foot
In 1963 I came up with what ended in a bird-brained debacle—a ‘‘Pheas-
ant Under Glass’’ restaurant/franchise concept. Chicken franchises were
hot; pheasant, consider ed the meal of kings—this idea would certainly
take a new business up and out of sight. I had even enlisted a top radio
announcer to be partner and to lend the use of his name. We became
excited: collected and analyzed tons of chicken data, had special under-
glass-like containers designed, commissioned architectural renderings for
buildings, designed a flexible distribution system, set standards for book-
keeping—the whole nine yards! But the most important yard missing was
the first yard. Production! How does one commercially grow a supply of
Thus, on a Minor Note 273
pheasant sufficient to feed an army that might not stop growing? The U.S.
Department of Agriculture pointed us to the nation’s largest grower. For
many years, he’d been in the business of supplying the U.S. Fish and Game
people with ready-for-release birds to seed in places where populations of
pheasant were dying out. Try as he may, and for over 10 years, he could
never get his adult-bird production beyond 250,000 per year. We learned
that pheasant is an incredibly complex and high-risk bird to raise. We also
learned that 250,000 birds would be unlikely to supply more than 2.3
facilities in less than one year from opening. Breakeven on initial devel-
opment costs could not occur until the sixth facility was up and running.
$175,000 and much wasted time now foolishly out the window, I had
spent less than $500 on phone calls and travel to learn from a professional
grower that my original hypothesis was broken. I started out looking for
answers in all the wrong places.
274
Appendix A
Valuation of a Marina
Author’s Responses
Until a business actually sells, there are no right or wrong answers as to its
value; there are only estimates as to what buyers and sellers might accom-
plish through arm’s-length negotiations. For all practical purposes, arm’s
length simply means that a buyer and a seller are ‘‘free’’ to accept or reject
any and all proposals made by each other. For example, in cases of divorce,
death of owners, or impending bankruptcies, sellers may not have much
choice and thus may not be as freewheeling in their negotiations as they
might otherwise be without the influence of these external pressures.
Estimating fair market value of businesses assumes that the only exter-
nal influence is one of supply and demand economics, which is tradition-
ally rooted in a concept of scarcity. Asset values, cash flows, financing
conditions, and freedom of choice for both parties set that stage. However,
Alchemic* economics (belief that today’s markets are no longer driven by
scarcity but rather by a concept of creating abundance) offers that pre-
dicting most-likely selling prices may or may not entirely fit conditions
based on scarcity. The issue of estimating fair market value has traditionally
been scientific in nature, and the process has frequently been completed
by an individual whose primary strengths lie in finance or accounting. In
that respect, and at least on the small-company valuation scene, knowl-
edge about the motivations (emotional makeup) of a sole decision maker
in the closely held enterprise can be missing. Unless the value processor
also possesses intimate marketplace awareness, these estimates for fair mar-
ket value can quickly become ruled by the numbers game. As a rather too
*Alchemy—A medieval chemical science and speculative philosophy aiming to achieve
the transmutation of the base metals into gold, the discovery of a universal cure for
disease, and the discovery of a means of indefinitely prolonging life. In effect, a power
or process of transforming something common into something special. C.G. Jung, in
his 1944 book Psychology and Alchemy, offered that the aim for gold was the human
wholeness of individualism (a process rather than a goal).
Valuation of a Marina 275
common practice, the prediction of most-likely prices under which busi-
nesses might elicit transfers of ownership is derived from the spectrum and
wide use of ‘‘comparable’’ sales techniques. It is indeed hard to compare
the educations, experiences, skills, and driving forces of individuals who
presume to operate these so-called comparable businesses. Thus, small
businesses can possess both fair market values forecast through the num-
bers game and most-likely values, which are largely an emotional game
played out by buyers and sellers themselves (and measured best by the
marketing representatives who sell these small businesses). If Alchemic
economics plays any role in small-business purchase, and I strongly suspect
that it does, then buyers might frequently enter negotiations with addi-
tional unmeasurable criteria that is not based in any past occurrence of
comparability. Mix this well, as in our case example, with the ambiance of
a body of navigable water, then even the skills of a rocket scientist may be
unable to predict where the projectile of ‘‘price’’ will land.
Our Case
The owner of this marina has scraped out a living during the past 11 years
of ownership. He has improved the business considerably during his ten-
ure, but cash has always been in short supply. From a business standpoint,
he is under no duress to sell; however, he has an opportunity to manage
an oceanfront complex at a very good salary. I purposely left this vital detail
out so that readers would view the practice exercise through an ar m’s-
length window (which, incidentally, is the more traditional viewpoint as-
sumed by a majority of players). The dilemma (emotional) faced by our
seller could be assessed as follows:
1. Eleven years of ownership without much to show for it in the way
of financial returns.
2. Time-fuse on a job opportunity that represents a better lifestyle and
escape from financial struggle.
Do not be misguided by the ‘‘grass is greener on the other side of the
fence’’ theory. Pride and self-esteem, contained in item 1, are major hur-
dles to overcome. Item 2 can conjure a sense of r unning away from the
battle. The entrepreneurial nature of small-business owners is to fight with
pride until the battle is over. For the benefit of readers, let me summarize
what I believe this seller has been thinking: ‘‘I want as much cash from
my sale as possible so that I can go on to the job with a sense of pride.’’
276 Appendix A
The beginning balance sheet 11 years ago reveals approximately what he
paid for the business originally. With the exception of inventory
($148,790 at the time of his purchase), 1999 discloses the rest.
Inventory $148,790
Land 30,000
Buildings/Docks 368,178
Vehicles 30,435
Furniture/Equipment 7,608
Tools 14,565
Signs 6,438
Goodwill 30,000
Less: Floor-Plan Interest מ 36,014
Approximate Price Originally Paid $600,000
Why is this important to know? Psychologically (by reason of self-
esteem), few sellers will part with their businesses below this number,
unless ‘‘forced’’ to do so by external influences beyond their control.
Compelling though it may seem, accepting or rejecting the ‘‘job’’ is,
never theless, within the seller’s control. This sets the stage for estimating
a most-likely selling price. Will the fair market estimate accommodate at
least $600,000, and, if not, what ‘‘sale features’’ can be included to arrest
potential feelings of low self-esteem and still encourage sale?
Our first task is to review what is being held out for sale with the
business:
Appraised Value of Assets Held Out For Sale
Land/Buildings/Docks
(Includes Improvements) $358,178
Vehicles 21,000
Furniture/Equipment 6,000
Tools 9,000
Other/Signs 5,000
‘‘Owned’’ Inventory 212,385*
Total $611,563
*$72,261 of the products are in ‘‘floor-plan’’ inventory at 2% per month carrying cost. For a
properly qualified buyer, these may be assumed and thus do not require additional financing.
However, bear in mind that a lender would add these costs to other debt-service payments as
they consider the extent of other capital they might loan.
Based on the footnote above, total assets held out for sale could, sub-
sequently, be reduced to $539,302. Floor-plan interest is already included
in operating expenses.
At this stage, we must determine whether cash flows will support the
Valuation of a Marina 277
purchase of assets ($539,302) plus the difference to $600,000 ($60,698)
of goodwill . . . or even more in value. The balance sheets and income
statements are repeated here for your convenience.
Practice Session—Marina
Balance Sheets
1999 2000 2001
Assets
Current Assets
Cash $ 5,049 $ 2,256 $ 2,307
Acct./Rec. 17,691 12,684 16,026
Inventory 215,814 204,300 212,385
Prepaid Expenses 8,733 6,933
Total Current Assets $247,287 $226,173 $230,718
Fixed
Land $ 30,000 $ 30,000 $ 30,000
Bldg./Docks 368,178 368,178 368,178
Improvements 42,537 46,785 46,785
Vehicles 30,435 30,435 30,435
Furn./Equip. 7,608 7,608 7,608
Tools 14,565 14,565 14,565
Signs 6,438 6,438 6,438
Less: Deprec. מ125,328 מ142,398 מ148,242
Total Fixed $374,433 $361,611 $355,767
Other
Reorg. Exp. $ 756 — —
Goodwill 30,000 30,000 30,000
Total Other $ 30,756 $ 30,000 $ 30,000
TOTAL ASSETS $652,476 $617,784 $616,485
1999
2000 2001
Liabilities
Current
Acc./Payable $ 3,270 $ 1,647 $ 2,604
Deposits 4,293 828 1,074
Notes—Floor Plan 104,529 97,242 72,261
Mortgage 57,567 43,500 45,990
Total Current $169,659 $143,217 $121,929
Long-Term Mortgage $257,709 $246,381 $234,234
Total Long Term $257,709 $246,381 $234,234
TOTAL LIABILITIES $427,368 $389,598 $356,163
Equity $225,108 $228,186 $260,322
TOTAL LIABILITIES & EQUITY $652,476 $617,784 $616,485
278 Appendix A
Practice Session—Marina
Reconstructed Income Statements for Valuation
1999 2000 2001
Sales $550,521 $583,656 $538,776
Cost of Sales 357,387 345,201 314,811
Gross Profit $193,134 $238,455 $223,965
% Gross Profit 35.1% 40.9% 41.6%
Expenses
Advertising $ 13,392 $ 7,893 $ 10,650
Vehicle Exp. 231 1,608 696
Prof. Fees 6,924 5,031 4,311
Insurance 22,743 19,023 29,979
Office Supplies 1,944 1,986 1,596
Repair/Maint. 3,450 3,252 7,707
Wages 17,832 23,331 17,895
Floor-Plan Int. 19,107 19,434 16,671
Shop Supplies 6,420 6,288 10,686
Taxes—Real Est. 3,351 6,660 6,660
Taxes—Payroll 5,517 6,999 3,669
Telephone 3,729 3,747 3,711
Travel 3,891 1,992 2,043
Uniforms 450 540 630
Utilities 4,578 4,350 3,138
Miscellaneous 6,435 10,938 4,938
Total Expenses $119,994 $123,072 $124,980
Recast Income $ 73,140 $115,383 $ 98,985
% Recast Income 13.3% 19.8% 18.4%
Ratio Study
Financial experts will not always agree as to which ratios are particularly
germane to the small and privately owned enterprise. I feel that it is es-
sential to examine the following:
Gross Profit
Ratio for Gross Margin ס or
Sales
1999
2000 2001
Industry
Median
35.1 40.9 41.6 58.0
This ratio measures the percentage of sales dollars left after goods are
sold. Although gross margins have improved, they remain below the in-
dustry median. A number of potentially adverse conditions could be pull-
Valuation of a Marina 279
ing these margins down in our target company. It may be in product
‘‘mix,’’ due to poor buying decisions, low ‘‘quantity’’ buying, low profit-
yield services offered, and so on. A prospective buyer might be advised to
look into what effect unavailable cash has had on gross margins.
The current ratio pr ovides a rough indication of a company’s ability to
service its obligations due within one year. Progressively higher ratios signify
increasing ability to service short-term obligations. Bear in mind that liquidity
in a specific business is a critical element of asset composition. Thus the acid
test ratio that follows is perhaps a better indicator of liquidity overall.
Total Current Assets
Current Ratio ס or
Total Current Liabilities
1999
2000 2001
Industry
Median
1.5 1.6 1.9 .8
The quick, or acid test, ratio is a refinement of the current ratio and
more thoroughly measures liquid assets of cash and accounts receivable
in the sense of ability to pay off current obligations. Higher ratios indicate
greater liquidity as a general rule. Our target company seems to be im-
proving in this department.
Cash and Equivalents ם Receivables
Quick Ratio ס or
Total Current Liabilities
1999
2000 2001
Industry
Median
.1 .1 .2 .2
A ratio of less than 1.0 can suggest a struggle to stay current with
obligations. The median suggests that the industry as a whole may wrestle
with liquidity problems by the nature of doing business and, even the top
25% of reported companies reflect only a ratio of .5. This comprises our
third index signaling a ‘‘downside’’ nature.
(Income Statement)
Sales
Sales/Receivable Ratio ס or
Receivables
(Balance Sheet)
1999
2000 2001
Industry
Median
31.1 46.0 33.6 34.3–186.1
280 Appendix A
This is an important ratio and measures the number of times that re-
ceivables turn over during the year. While erratic in nature and about
average in sense of the industry median, we cannot put much weight on
this ratio, since receivables tend to be so small.
365
Day’s Receivable Ratio ס or
Sales/Receivable Ratio
1999
2000 2001
Industry
Median
12 8 11 11–2 days
This highlights the average time in terms of days that receivables are
outstanding. Generally, the longer that receivables are outstanding, the
greater the chance that they may not be collectible. Slow-turnover ac-
counts merit individual examination for conditions of cause. Turnover in
our target seems acceptable by industry standards.
Cost of Sales
Cost of Sales/Payables Ratio ס or
Payables
1999
2000 2001
Industry
Median
109.3 209.6 120.9 27.3
Generally, the higher their turnover rate, the shorter the time between
purchase and payment. Lower turnover suggests that companies may fre-
quently pay bills from daily in-house cash receipts due to slower receivable
collections. This practice may be somewhat misguided in light of invest-
ment principles whereby one normally attempts to match collections rela-
tively close to payments so that more business income can be directed into
the pockets of owners. Some businesses may, however, have little choice.
Our target company is exceptionally attentive in paying bills. This raises a
question of floor-plan management. For example, is there a good balance
of cash being used to pay floor-plan interest, versus a better use toward
purchased inventory? How might this play out in terms of incr easing gross
margins?
Sales
Sales/Working Capital Ratio ס or
Working Capital*
Valuation of a Marina 281
1999 2000 2001
Industry
Median
7.1 7.0 5.0 21.9
*Working capital equals curr ent assets less current liabilities.
A low ratio may indicate an inefficient use of working capital, whereas
a very high ratio often signals a vulnerable position for creditors. This
minus industry median indicates that working capital is quite regularly
scarce or that inefficient uses of working capital prevail thr oughout this
industry. The results of this ratio indicate positive signs. Though working
capital increased in each of these years ($77,628 to $82,956 to $108,789),
the ratio dropped off in 2001 because of the lowest sales performance
during the three-year period. Ratios, by themselves, may not always tell
the whole story.
To analyze how well inventory is being managed, the cost of sales to
inventory ratio can identify important potential shortsightedness.
Cost of Sales
Cost of Sales/Inventory Ratio ס or
Inventory
1999
2000 2001
Industry
Median
1.7 1.7 1.5 3.8
A higher inventory turnover can signify a more liquid position and/or
better skills at marketing, whereas a lower tur nover of inventory may in-
dicate shortages of merchandise for sale, overstocking, or obsolescence.
These lower turnovers of inventory leave me skeptical about conditions
in this asset. My first inclination would be to look, item by item, to de-
termine what, if any, products could be changed from stock to ‘‘custom’’
order, or dropped entirely. $140,124 ($212,385 מ $72,261 in floor plan)
is a great deal of money to be turning over at less than twice per year.
The Valuation Exercise
Book Value Method
Total Assets at Year-End 2001 $ 616,485
Total Liabilities 356,163
Book Value at Year-End 2001 $ 260,322
282 Appendix A
Adjusted Book Value Method
Assets
Balance Sheet
Cost
Fair Market
Value
Cash $ 2,307 $ 2,307
Acct./Rec. 16,026 16,026
Inventory 212,385 212,385
Prepaid Exp.
Land 30,000 358,178
Real Estate/Docks 368,178 Included
Improvements 46,785 Included
Vehicles 30,435 21,000
Furniture/Equip. 7,608 6,000
Assets
Balance Sheet
Cost
Fair Market
Value
Tools 14,565 9,000
Signs 6,438 5,000
Other 30,000 Included
Accumulated Deprec. מ148,242
N/A
Total Assets $ 616,485 $ 629,896
Total Liabilities $מ356,163
$מ356,163
$ 260,322
Adjusted Book Value at 2001 $ 273,733
Weighted Average Cash Flow
1999 $ 73,140 (1) ס $ 73,140
2000 115,383 (2) ס 230,766
2001 98,985 (3)
ס
296,955
Totals (6) ס $ 600,861
Divided by 6
Weighted Reconstr ucted Income $ 100,144
The flip-side nature of three years of sales and income suggests the
possibility that revenues might have peaked and that income is now largely
dependent upon each year’s economy. However, to assure oneself of such
assumptions, several other years’ performances should be examined. You
can take this assumption for granted in our case.
Hybrid Method
(This is a form of the capitalization method.)
1 ס High amount of dollars in assets and low-risk business venture
Valuation of a Marina 283
2 ס Medium amount of dollars in assets and medium-risk business
venture
3 ס Low amount of dollars in assets and high-risk business venture
1 2 3
Yield on Risk-Free Investments Such as
Government Bonds
a
(often 6%–9%) 8.0% 8.0% 8.0%
Risk Premium on Nonmanagerial Investments
a
(corporate bonds, utility stocks) 4.5% 4.5% 4.5%
Risk Premium on Personal Management
a
7.5% 14.5% 22.5%
Capitalization Rate 20.0% 27.0% 35.0%
Earnings Multipliers 5.0 3.7 2.9
a
These rates are revised periodically to reflect changing economies. They can be composed
through the assistance of expert investment advisers if need be.
This particular version of a hybrid method tends to place 40% of busi-
ness value in book values.
Book Value at Year-End 2001 $260,322
Add: Appreciation in Assets 13,411
Book Value as Adjusted $273,733
Weight to Adjusted Book Value 40%
$109,493
Weighted Reconstr ucted Income $100,144
Times Multiplier ן3.7
$370,533
Total Business Value $480,026
Market Value of Assets Held Out for Sale
Inventory $212,385
Less: Floor-Plan Inventor y מ 72,261
Subtotal $140,124
Land/Buildings/Docks 358,178
Vehicles 21,000
Furniture/Equipment 6,000
Tools 9,000
Signs 5,000
Total $539,302
Excess Earnings Method
(This method considers cash flow and values in hard assets, estimates in-
tangible values, and superimposes tax considerations and financing struc-
tures to prove the most-likely equation.)
284 Appendix A
Reconstructed Cash Flow $ 100,144
Less: Comparable Salary (provided) מ27,000
Less: Contingency Reserve מ 5,000
Net Cash Stream to Be Valued $ 68,144
Cost of Money
Market Value of Tangible Assets
(See reconstructed balance sheet) $ 539,302
Times: Applied Lending Rate ן10%
Annual Cost of Money $ 53,930
Excess of Cost of Earnings
Net Cash Stream to Be Valued $ 68,144
Less: Annual Cost of Money מ53,930
Excess of Cost of Earnings $ 14,214
Intangible Business Value
Excess of Cost of Earnings $ 14,214
Times: Intangible Net Multiplier Assigned ן2.0
*
Intangible Business Value $ 28,428
Add: Tangible Asset Value 539,302
TOTAL BUSINESS VALUE (Prior to Proof) $ 567,730
(Say $570,000)
Financing Rationale
Total Investment $ 570,000
Less: Down Payment מ 142,500
Balance to Be Financed $ 427,500
*Refer to Figure 9.1 in Chapter 9.
At this point, we must gauge the amount in prospective bank financing.
It’s important to use a good deal of logic at this stage of valuation or you
will waste a lot of time coming up with reliable estimates. One can set up
the financing scenario in any way appropriate to local conditions.
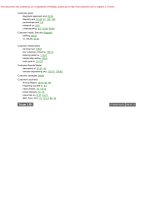
Real Estate ($358,178) at 65% of FMV $232,816
Furniture/Equip. ($6,000) at 30% of FMV 1,800
Tools ($9,000) at 50% of FMV 4,500
Vehicles ($21,000) at 30% of FMV 6,300
Inventory ($140,124) at 50% of Book Value 70,062
*
Estimated Bank Financing $315,478
(Say $315,000)
*While inventory is stated at $212,385, bear in mind that $72,261 of that inventory is already
under floor-plan financing.
Bank (10% x 15 years)
Amount $315,000
Annual Principal/Interest Payment 40,620