Effective Project Management Traditional, Adaptive, Extreme Third Edition phần 6 pot
Bạn đang xem bản rút gọn của tài liệu. Xem và tải ngay bản đầy đủ của tài liệu tại đây (552.76 KB, 50 trang )
Control versus Quality
Quality will not happen by accident. It must be designed into the project man-
agement process. Chapter 2 discusses the Continuous Quality Management and
Process Quality Management Models. You might want to refer to Chapter 2 to
see what those management models are and what they do regarding quality.
Fortunately, control and quality are positively correlated with one another. If
we do not take steps to control the product and the process, we will not enjoy
the benefits that quality brings to the equation.
Progress Reporting System
Once project work is underway, you want to make sure that it proceeds
according to plan. To do this, you need to establish a reporting system that
keeps you informed of the many variables that describe how the project is pro-
ceeding as compared to the plan.
A reporting system has the following characteristics:
■■ Provides timely, complete, and accurate status information
■■ Doesn’t add so much overhead time as to be counterproductive
■■ Is readily acceptable to the project team and senior management
■■ Warns of pending problems in time to take action
■■ Is easily understood by those who have a need to know
To establish this reporting system, you will want to look into the hundreds of
reports that are standard fare in project management software packages. Once
you decide what you want to track, these software tools will give you several
suggestions and standard reports to meet your needs. Most project manage-
ment software tools allow you to customize their standard reports to meet
even the most specific needs.
Types of Project Status Reports
There are five types of project status reports:
Current period reports. These reports cover only the most recently com-
pleted period. They report progress on those activities that were open or
scheduled for work during the period. Reports might highlight activities
completed and variance between scheduled and actual completion dates. If
any activities did not progress according to plan, the report should include
Monitoring and Controlling Progress
211
12 432210 Ch10.qxd 7/2/03 9:33 AM Page 211
a discussion of the reasons for the variance and the appropriate corrective
measures that will be implemented to correct the schedule slippage.
Cumulative reports. These reports contain the history of the project from
the beginning to the end of the current report period. They are more infor-
mative than the current period reports because they show trends in project
progress. For example, a schedule variance might be tracked over several
successive periods to show improvement. Reports can be at the activity or
project level.
Exception reports. Exception reports report variances from plan. These
reports are typically designed for senior management to read and interpret
quickly. Reports that are produced for senior management merit special
consideration. Senior managers do not have a lot of time to read reports
that tell them that everything is on schedule and there are no problems
serious enough to warrant their attention. In such cases, a one-page, high-
level summary report that says everything is okay is usually sufficient. It
might also be appropriate to include a more detailed report as an attach-
ment for those who might wish to read more detail. The same might be
true of exception reports. That is, the one-page exception report tells senior
managers about variances from plan that will be of interest to them, while
an attached report provides more details for the interested reader.
Stoplight reports. Stoplight reports are a variation that can be used on any
of the previous report types. We believe in parsimony in all reporting. Here
is a technique you might want to try. When the project is on schedule and
everything seems to be moving as planned, put a green sticker on the top
right of the first page of the project status report. This sticker will signal to
senior managers that everything is progressing according to plan, and they
need not even read the attached report. When the project has encountered
a problem—schedule slippage, for example—you might put a yellow
sticker on the top right of the first page of the project status report. That is
a signal to upper management that the project is not moving along as
scheduled but that you have a get-well plan in place. A summary of the
problem and the get-well plan may appear on the first page, but they can
also refer to the details in the attached report. Those details describe the
problem, the corrective steps that have been put in place, and some esti-
mate of when the situation will be rectified. Red stickers placed on the top
right of the first page signal that a project is out of control. Red reports are
to be avoided at all costs because they mean that the project has encoun-
tered a problem, and you don’t have a get-well plan or even a recommen-
dation for upper management. Senior managers will obviously read these
reports because they signal a major problem with the project. On a more
positive note, the red condition may be beyond your control. For example,
Chapter 10
212
12 432210 Ch10.qxd 7/2/03 9:33 AM Page 212
there is a major power grid failure on the East Coast and a number of com-
panies have lost their computing systems. Your hot site is overburdened
with companies looking for computing power. Your company is one of
them, and the loss of computing power has put your project seriously
behind in final system testing. There is little you can do to avoid such acts
of nature.
Variance reports. Variance reports do exactly what their name suggests—
they report differences between what was planned and what actually
happened. The report has three columns:
■■
The planned number
■■
The actual number
■■
The difference, or variance, between the two
A variance report can be in one of two formats:
■■
The first is numeric and displays a number of rows with each row giv-
ing the actual, planned, and variance calculation for those variables in
which such numbers are needed. Typical variables that are tracked in a
variance report are schedule and cost. For example, the rows might
correspond to the activities open for work during the report period
and the columns might be the planned cost to date, the actual cost to
date, and the difference between the two. The impact of departures
from plan is signified by larger values of this difference (the variance).
■■
The second format is a graphical representation of the numeric data. It
might be formatted so that the plan data is shown for each report
period of the project and is denoted with a curve of one color; the
actual data is shown for each report period of the project and is
denoted by a curve of a different color. The variance need not be
graphed at all because it is merely the difference between the two
curves at some point in time. One advantage of the graphic version of
the variance report is that it can show the variance trend over the
report periods of the project, while the numeric report generally shows
data only for the current report period.
Typical variance reports are snapshots in time (the current period) of the
status of an entity being tracked. Most variance reports do not include data
points that report how the project reached that status. Project variance
reports can be used to report project as well as activity variances. For the
sake of the managers who will have to read these reports, we recommend
that one report format be used regardless of the variable being tracked. Top
management will quickly become comfortable with a reporting format that
is consistent across all projects or activities within a project. It will make
life a bit easier for the project manager, too.
Monitoring and Controlling Progress
213
12 432210 Ch10.qxd 7/2/03 9:33 AM Page 213
There are five reasons why you would want to measure duration and cost
variances:
■■
Catch deviations from the curve early. The cumulative actual cost or
actual duration can be plotted against the planned cumulative cost or
cumulative duration. As these two curves begin to display a variance
from one another, the project manager will want to put corrective mea-
sures in place to bring the two curves together. This reestablishes the
agreement between the planned and actual performance. This topic is
treated in detail later in the chapter in the section Cost Schedule Control.
■■
Dampen oscillation. Planned versus actual performance should display
a similar pattern over time. Wild fluctuations between the two are
symptomatic of a project that is not under control. Such a project will
get behind schedule or overspent in one period, be corrected in the
next, and go out of control in the next report period. Variance reports
can give an early warning that such conditions are likely and give the
project manager an opportunity to correct the anomaly before it gets
serious. Smaller oscillations are easier to correct than larger oscillations.
■■
Allow early corrective action. As just suggested, the project manager
would prefer to be alerted to a schedule or cost problem early in the
development of the problem rather than later. Early problem detection
may offer more opportunities for corrective action than later detection.
■■
Determine weekly schedule variance. In our experience, we found that
progress on activities open for work should be reported on a weekly
basis. This is a good compromise on report frequency and gives the
project manager the best opportunity for corrective action plans before
the situation escalates to a point where it will be difficult to recover
any schedule slippages.
■■
Determine weekly effort (person hours/day) variance. The difference
between the planned effort and actual effort has a direct impact on
both planned cumulative cost and schedule. If the effort is less than
planned, it may suggest a potential schedule slippage if the person is
not able to increase his or her effort on the activity in the following
week. Alternatively, if the weekly effort exceeded the plan and the
progress was not proportionately the same, a cost overrun situation
may be developing.
Early detection of out-of-control situations is important. The longer we have to
wait to discover a problem, the longer it will take for our solution to bring the
project back to a stable condition.
Chapter 10
214
12 432210 Ch10.qxd 7/2/03 9:33 AM Page 214
How and What Information to Update
As input to each of these report types, activity managers and the project man-
ager must report the progress made on all of those activities that were open for
work (in other words, those that were to have work completed on them during
the report period) during the period of time covered by the status report.
Recall that your planning estimates of activity duration and cost were based
on little or no information. Now that you have completed some work on the
activity, you should be able to provide a better estimate of the duration and
cost exposure. This reflects itself in a reestimate of the work remaining to com-
plete the activity. That update information should also be provided.
The following is a list of what should actually be reported.
Determine a set period of time and day of week. The project team will
have agreed on the day of the week and time of day by which all updated
information is to be submitted. A project administrator or another team
member is responsible for seeing that all update information is on file by
the report deadline.
Report actual work accomplished during this period. What was planned
to be accomplished and what was actually accomplished are two different
things. Rather than disappoint the project manager, activity managers are
likely to report that the planned work was actually accomplished. Their
hope is to catch up by the next report period. Project managers need to
verify the accuracy of the reported data rather than simply accept it as
accurate. Spot-checking on a random basis should be sufficient. If the
activity was defined according to the completion criteria, as is discussed
in Chapter 2, verification should not be a problem.
Record historical and reestimate remaining (in-progress work only). Two
kinds of information are reported:
■■
All work completed prior to the report deadline is historical information.
It will allow variance reports and other tracking data to be presented
and analyzed.
■■
The other kind of information is futures-oriented. For the most part, this
information is reestimates of duration and cost and estimates to com-
pletion (both cost and duration) of the activities still open for work.
Report start and finish dates. These are the actual start and finish dates of
activities started or completed during the report period.
Record days of duration accomplished and remaining. How many days
have been spent so far working on this activity is the first number
reported. The second number is based on the reestimated duration as
reflected in the time-to-completion number.
Monitoring and Controlling Progress
215
12 432210 Ch10.qxd 7/2/03 9:33 AM Page 215
Report resource effort (hours/day) spent and remaining (in-progress work
only). Whereas the preceding numbers report calendar time, these num-
bers report labor time over the duration of the activity. There are two
numbers. One reports labor completed over the duration accomplished.
The other reports labor to be spent over the remaining duration.
Report percent complete. Percent complete is the most common method
used to record progress because it is the way we tend to think about what
has been done in reference to the total job that has to be done. Percent com-
plete isn’t the best method to report progress, though, because it is a sub-
jective evaluation. When you ask someone “What percent complete are
you on this activity?” what goes through his or her mind? The first thing
he or she thinks about is most likely “What percent should I be?” followed
closely by “What’s a number that we can all be happy with?”
To calculate the percent complete for an activity, you need something quan-
tifiable. At least three different approaches have been used to calculate the
percent complete of an activity:
■■
Duration
■■
Resource work
■■
Cost
Each of these could result in a different percent complete! So when we say
percent complete, what measure are we referring to?
If you focus on duration as the measure of percent complete, where did the
duration value come from? The only value you have is the original estimate.
You know that original estimates often differ from actual performance. If
you were to apply a percent complete to duration, however, the only
one you have to work with is the original estimated one. Therefore,
percent complete is not a good metric.
Our advice is to never ask for and never accept percent complete as input
to project progress. Always allow it to be a calculation. Many software
products will let you do it either as an inputted value or as a calculated
value. The calculated value that we recommend above all others is one
based on the number of tasks actually completed in the activity as a pro-
portion of the number of tasks that currently define the activity. Recall that
the task list for an activity is part of the work package description. Here we
count only completed tasks. Tasks that are underway but not reported as
complete may not be used in this calculation.
Frequency of Gathering and Reporting Project Progress
A logical frequency for reporting project progress is once a week, usually on
Friday afternoon. There are some projects, such as refurbishing a large jet
Chapter 10
216
12 432210 Ch10.qxd 7/2/03 9:33 AM Page 216
airliner, where progress is recorded after each shift, three times a day. We’ve
seen others that were of such a low priority or long duration that they were
updated once a month. For most projects, start gathering the information
about noon on Friday. Let people extrapolate to the end of the workday.
Variances
Variances are deviations from plan. Think of a variance as the difference
between what was planned and what actually occurred. There are two types of
variances: positive variances and negative variances.
Positive Variances
Positive variances are deviations from plan that indicate that an ahead-of-schedule
situation has occurred or that an actual cost was less than a planned cost. This
type of variance is good news to the project manager, who would rather hear that
the project is ahead of schedule or under budget. Positive variances bring their
own set of problems, which can be as serious as negative variances. Positive vari-
ances can allow for rescheduling to bring the project to completion early, under
budget, or both. Resources can be reallocated from ahead-of-schedule projects to
behind-schedule projects.
Not all the news is good news, though. Positive variances also can result from
schedule slippage! Consider budget. Being under budget means that not all
dollars were expended, which may be the direct result of not having com-
pleted work that was scheduled for completion during the report period.
CROSS-REFERENCE
We return to this situation later in the Cost Schedule Control section of this chapter.
On the other hand, if the ahead-of-schedule situation is the result of the proj-
ect team’s finding a better way or a shortcut to completing work, the project
manager will be pleased. This situation may be a short-lived benefit, however.
Getting ahead of schedule is great, but staying ahead of schedule presents
another kind of problem. To stay ahead of schedule, the project manager will
have to negotiate changes to the resource schedule. Given the aggressive proj-
ect portfolios in place in most companies, there is not much reason to believe
that resource schedule changes can be made. In the final analysis, being ahead
of schedule may be a myth.
Negative Variances
Negative variances are deviations from plan that indicate that a behind-schedule
situation has occurred or that an actual cost was greater than a planned cost.
Monitoring and Controlling Progress
217
12 432210 Ch10.qxd 7/2/03 9:33 AM Page 217
Being behind schedule or over budget is not what the project manager or his
reporting manager wants to hear. Negative variances, just like positive vari-
ances, are not necessarily bad news. For example, you might have overspent
because you accomplished more work during the report period than was
planned. But in overspending during this period, you could have accom-
plished the work at less cost than was originally planned. You can’t tell by look-
ing at the variance report.
CROSS-REFERENCE
More details are forthcoming on this topic in the Cost Schedule Control section later
in this chapter.
In most cases, negative time variances affect project completion only if they are
associated with critical path activities or if the schedule slippage on noncritical
path activities exceeds the activity’s total float. Variances use up the float time
for that activity; more serious ones will cause a change in the critical path.
Negative cost variances can result from uncontrollable factors such as cost
increases from suppliers or unexpected equipment malfunctions. Some nega-
tive variances can result from inefficiencies or error. We discuss a problem
escalation strategy to resolve such situations later in this chapter.
Applying Graphical Reporting Tools
As mentioned earlier in the chapter, senior managers may have only a few
minutes of uninterrupted time to digest your report. Respect that time. They
won’t be able to fully read and understand your report if they have to read 15
pages before they get any useful information. Having to read several pages
only to find out that the project is on schedule is frustrating and a waste of
valuable time.
Gantt Charts
As we discussed in Chapters 4 and 6, a Gantt chart is one of the most convenient,
most used, and easy-to-grasp depictions of project activities that we have
encountered in our practice. The chart is formatted as a two-dimensional repre-
sentation of the project schedule with activities shown in the rows and time
shown across the horizontal axis. It can be used during planning, for resource
scheduling, and for status reporting. The only downside to using Gantt charts is
that they do not contain dependency relationships. Some project management
Chapter 10
218
12 432210 Ch10.qxd 7/2/03 9:33 AM Page 218
software tools have an option to display these dependencies, but the result is a
graphical report that is so cluttered with lines representing the dependencies
that the report is next to useless. In some cases, dependencies can be guessed at
from the Gantt chart, but in most cases, they are lost.
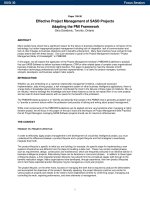
Figure 10.2 shows a representation of the Cost Containment Project as a Gantt
chart using the format that we prefer. The format shown is from Microsoft
Project 2000, but it is typical of the format used in most project management
software packages.
Milestone Trend Charts
Milestones are significant events in the life of the project that you wish to track.
These significant events are zero-duration activities and merely represent that
a certain condition exists in the project. For example, a milestone event might
be that the approval of several different component designs has been given.
This event consumes no time in the project schedule. It simply reflects the fact
that those approvals have all been granted. The completion of this milestone
event may be the predecessor of several build-type activities in the project
plan. Milestone events are planned into the project in the same way that activ-
ities are planned into the project. They typically have FS relationships with the
activities that are their predecessors and their successors.
Let’s look at a milestone trend chart for a hypothetical project (see Figure 10.3).
The trend chart plots the difference between the planned and estimated date of
a project milestone at each project report period. In the original project plan,
the milestone is planned to occur at the ninth month of the project. That is the
last project month on this milestone chart. The horizontal lines represent one,
two, and three standard deviations above or below the forecasted milestone
date. Any activity in the project has an expected completion date that is
approximately normally distributed. The mean and variance of its completion
date are a function of the longest path to the activity from the report date. In
this example, the units of measure are one month. For this project, the first
project report (at month 1) shows that the new forecasted milestone date will
be one week later than planned. At the second project report date (month two
of the project), the milestone date is forecasted on target. The next three project
reports indicate a slippage to two weeks late, then three weeks late, then four
weeks late, and finally six weeks late (at month 6 of the project). In other
words, the milestone is forecasted to occur six weeks late, and there are only
three more project months in which to recover the slippage. Obviously, the
project is in trouble. The project appears to be drifting out of control, and in
fact, it is. Some remedial action is required of the project manager.
Monitoring and Controlling Progress
219
12 432210 Ch10.qxd 7/2/03 9:33 AM Page 219
ID Description
24 Determ. chars. of a departmental profile
25 Profile usage of each department
49 Analyze current office supplies in use
57 Estab. CS dist. service levels
71 Det. corp. usage of office/copy supplies
50 Propose office supplies standards
56 Estimate CS walk-up service levels
8 Define copy machine re-stocking procedure
4 Design copy services cost red. brochure
51 Dist. office sup's standards for commence
107 Research new vendors
9 ID alternative copy charge back sys's
5 Print copy services cost red. brochure
58 Inform staff of CS service levels
26 Collect office sup. expenses by type
72 Inventory existing corp. office/copy supplies
January
February
2431714212841
118253
Chapter 10
220
Figure 10.2
Gantt chart project status report.
12 432210 Ch10.qxd 7/2/03 9:33 AM Page 220
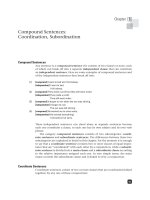
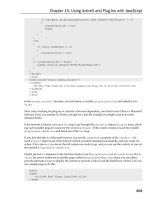
Figure 10.3 A run up or down of four or more successive data points.
Certain patterns signal an out-of-control situation. These are given in Figures
10.3 through 10.6 and are described here:
Successive slippages. Figure 10.3 depicts a project that is drifting out of
control. Each report period shows additional slippage since the last report
period. Four such successive occurrences, however minor they may seem,
require special corrective action on the part of the project manager.
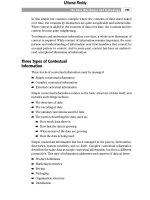
Radical change. Figure 10.4, while it does show the milestone to be ahead
of schedule, reports a radical change between report periods. Activity
duration may have been grossly overestimated. There may be a data error.
In any case, the situation requires further investigation.
Successive runs. Figure 10.5 signals a project that may have encountered a
permanent schedule shift. In the example, the milestone date seems to be
varying around one month ahead of schedule. Barring any radical shifts
and the availability of resources over the next two months, the milestone
will probably come in one month early. Remember that you have negoti-
ated for a resource schedule into these two months, and now you will be
trying to renegotiate an accelerated schedule.
Figure 10.4 A change of more than three standard deviations.
987654321
3
Early
2
1
On Schedule
1
2
3
Late
Project Month
987654321
3
Early
2
1
On Schedule
1
2
3
Late
Project Month
Monitoring and Controlling Progress
221
12 432210 Ch10.qxd 7/2/03 9:33 AM Page 221
Figure 10.5 Seven or more successive data points above or below the planned milestone
date.
Schedule shift. Figure 10.6 depicts a major shift in the milestone schedule.
The cause must be isolated and the appropriate corrective measures taken.
One possibility is the discovery that a downstream activity will not be
required. Perhaps the project manager can buy a deliverable rather than
build it and remove the associated build activities from the project plan.
Cost Schedule Control
Cost schedule control is used to measure project performance and, by tradi-
tion, uses the dollar value of work as the metric. As an alternative, resource
person hours/day can be used in cases where the project manager does not
directly manage the project budget. Actual work performed is compared
against planned and budgeted work expressed in these equivalents. These
metrics are used to determine schedule and cost variances for both the current
period and cumulative to date. Cost and resource person hours/day are not
good objective indicators with which to measure performance or progress.
While this is true, there is no other good objective indicator. Given this, we are
left with dollars or person hours/day, which we are at least familiar working
with in other contexts. Either one by itself does not tell the whole story. We
need to relate them to one another.
One drawback that these metrics have is that they report history. Although
they can be used to make extrapolated predictions for the future, they primar-
ily provide a measure of the general health of the project, which the project
manager can correct as needed to restore the project to good health.
Figure 10.7 shows an S curve, which represents the baseline progress curve for
the original project plan. It can be used as a reference point. You can compare
your actual progress to date against the curve and determine how well the
project is doing. Again, progress can be expressed as either dollars or person
hours/day.
987654321
3
Early
2
1
On Schedule
1
2
3
Late
Project Month
Chapter 10
222
12 432210 Ch10.qxd 7/2/03 9:33 AM Page 222
Figure 10.6 Two successive data points outside three standard deviations from the planned
milestone date.
By adding the actual progress curve to the baseline curve, you can now see the
current status versus the planned status. Figure 10.8 shows the actual progress
curve to be below the planned curve. If this represented dollars, we might be
tempted to believe the project is running under budget. Is that really true?
Figure 10.7 The standard S curve.
Time
Progress
1/3 Time – 1/4 Progress
2/3 Time – 3/4 Progress
987654321
3
Early
2
1
On Schedule
1
2
3
Late
Project Month
Monitoring and Controlling Progress
223
12 432210 Ch10.qxd 7/2/03 9:33 AM Page 223
Figure 10.8 Baseline versus actual cost curve illustrating cost variance.
Projects rarely run significantly under budget. A more common reason for the
actual curve to be below the baseline is that the activities that should have
been done have not been, and thus the dollars or person hours/day that were
planned to be expended have not been. The possible schedule variance is high-
lighted in Figure 10.9.
Figure 10.9 Baseline versus actual cost illustrating schedule variance.
Progress
Cost Variance
Time
Update
Date
Baseline
Actual
Schedule
Variance
Progress
Cost Variance
Time
Update Date
Baseline
Actual
Chapter 10
224
12 432210 Ch10.qxd 7/2/03 9:33 AM Page 224
To determine whether there has really been a progress schedule variance, you
need some additional information. Cost schedule control (CSC) comprises
three basic measurements: budgeted cost of work scheduled, budgeted cost of
work performed, and actual cost of work performed. These measurements
result in two variance values: schedule variance and cost variance. Figure
10.10 is a graphical representation of the three measurements.
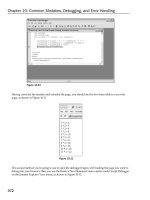
The figure shows a single activity that has a five-day duration and a budget of
$500. The budget is prorated over the five days at an average daily value of
$100. The left panel of Figure 10.10 shows an initial (baseline) schedule with
the activity starting on the first day of the week (Monday) and finishing at the
end of the week (Friday). The budgeted $500 value of the work is planned to
be accomplished all within that week. This is the planned value (PV). The cen-
ter panel shows the actual work that was done. Note that the schedule slipped
and work did not begin until the third day of the week. Using an average daily
budget of $100, we see that we were able to complete only $300 of the sched-
uled work. This is the earned value (EV). The rightmost panel shows the actual
schedule as in the center panel, but now we see the actual dollars that were
spent to accomplish the three days’ work. This $400 is the actual cost (AC).
The PV, EV, and AC are used to compute and track two variances. The first is
schedule variance (SV). SV is the difference between the EV and PV, which is –$200
(EV – PV) for this example. That is, the SV is the schedule difference between
what was done and what was planned to be done, expressed in dollar or person
hours/day equivalents. The second is cost variance (CV). CV is the difference
between the EV and the AC, which is $100 in this example. That is, we overspent
by $100 (AC – EV) the cost of the work completed.
Figure 10.10 Cost/performance indicators.
5 days
PV EV AC
$500
5 days
$300 $200
5 days
$400 $200
Schedule slippage
permits only 3 days/$300
work to be performed
EV=$300
Schedule variance = ($200)
Scheduled/Budgeted
to do $500 work
over 5 days in a
5-day window
PV = $500
Actual cost of work
performed = $400
AC=$400
Actual cost
variance = ($100)
Monitoring and Controlling Progress
225
12 432210 Ch10.qxd 7/2/03 9:33 AM Page 225
Management might react positively to the news shown in Figure 10.8, but they
might also be misled by such a conclusion. The full story is told by comparing
both budget variance and schedule variance, shown in Figure 10.11.
To correctly interpret the data shown in Figure 10.9, you need to add the EV
data that was given in Figure 10.10 to produce Figure 10.11. Comparing the EV
curve with the PV curve, you see that you have underspent because all of the
work that was scheduled has not been completed. Comparing the EV curve to
the AC curve also indicates that you overspent for the work that was done.
Clearly, management would have been misled by Figure 10.8 had they ignored
the data in Figure 10.10. Either one by itself may be telling a half-truth.
Figure 10.11 The full story.
Progress
Schedule
Variance
Cost
Variance
Time
PV
AC
EV
Chapter 10
226
Cost/Schedule Control Terminology
For those who are familiar with the older cost/schedule control terminology, we
have used the new terminology as defined in PMBOK 2000. The old terminology
compares to the new terminology as follows:
◆ ACWP is the actual cost (AC).
◆ BCWP is the earned value (EV).
◆ BCWS is the planned value (PV).
12 432210 Ch10.qxd 7/2/03 9:33 AM Page 226
In addition to measuring and reporting history, CSC can be used to predict the
future status of a project. Take a look at Figure 10.12. By cutting the PV curve
at the height from the horizontal axis, which has been achieved by the EV, and
then pasting this curve onto the end of the EV curve, you can extrapolate the
completion of the project. Note that this is based on using the original esti-
mates for the remaining work to be completed. If you continue at the rate at
which you have been progressing, you will finish beyond the planned
completion date. Doing the same thing for the AC shows that you will finish
over budget. This is the simplest method of attempting to “estimate to com-
pletion,” but it clearly illustrates that a significant change needs to occur in the
way this project is running.
The three basic indicators yield one additional level of analysis for us. Sched-
ule performance index (SPI) and cost performance index (CPI) are a further
refinement. They are computed as follows:
SPI = EV/PV
CPI = EV/AC
Figure 10.12 PV, EV, and AC curves.
Progress
Time
PV
AC
EV
Estimate to Complete
Baseline
Finish
Date
Update Date
Monitoring and Controlling Progress
227
12 432210 Ch10.qxd 7/2/03 9:33 AM Page 227
Schedule performance index. The schedule performance index is a mea-
sure of how close the project is to performing work as it was actually
scheduled. If we are ahead of schedule, EV will be greater than PV, and
therefore the SPI will be greater than 1. Obviously, this is desirable. On the
other hand, an SPI below 1 would indicate that the work performed was
less than the work scheduled. Not a good thing.
Cost performance index. The cost performance index is a measure of how
close the project is to spending on the work performed to what was
planned to have been spent. If you are spending less on the work per-
formed than was budgeted, the CPI will be greater than 1. If not, and you
are spending more than was budgeted for the work performed, then the
CPI will be less than 1.
Some managers prefer this type of analysis because it is intuitive and quite
simple to equate each index to a baseline of 1. Any value less than 1 is unde-
sirable; any value over 1 is good. These indices are displayed graphically as
trends compared against the baseline value of 1.
Using the WBS to Report Project Status
Because the Work Breakdown Structure (WBS) shows the hierarchical struc-
ture of the work to be done, it can be used for status reporting, too. In its sim-
plest form, each activity box can be shaded to reflect completion percentages.
As lower-level activities are completed, the summary activities above them
can be shaded to represent percent complete data. Senior managers will
appreciate knowing that major parts of the project are complete. Unfortu-
nately, the WBS does not contain scheduling or sequencing information. To the
extent that this adds to the value of the report, narrative data or brief tabular
data might be added to the report. Figure 10.13 shows an example status
report using the WBS.
Although this report is rather intuitive, it does not contain much detail. It
would have to be accompanied by an explanatory note with schedule and cost
detail.
Chapter 10
228
12 432210 Ch10.qxd 7/2/03 9:33 AM Page 228
ID Description
47 Central stores operations
48 CS standardize supplies
49 Analyze current office supplies in use
50 Propose office supplies standards
51 Dist. office sup's standards
52 Revise office supplies standards
53 Obtain office supply standards
54 Notify depart's of final supplies standard
55 CS ordering
56 Estab. CS dist. service levels
57 Estimate CS walk-up service levels
58 Inform staff of CS service levels
59 Design elect. order interface
60 Layout CS office/copy supply
61 Build elect. order interface
62 Test elect. order interface
January
February
31 7 14 21 28 4 11
18
325
Monitoring and Controlling Progress
229
Figure 10.13
Status reporting with the WBS.
12 432210 Ch10.qxd 7/2/03 9:33 AM Page 229
Deciding on Report Level of Detail
There are always questions about the level of detail and frequency of reporting
in project status reports. Our feeling is that the more you report, the more
likely it is that someone will object or find some reason to micromanage your
project. Let’s examine this issue in more detail by considering the reporting
requirements at the activity manager, project manager, and senior manager
levels.
Activity Manager
The activity manager will want the most detailed and granular information
available. After all, the activity manager is directly responsible for getting the
work done. Because he or she manages the resources that are used to complete
project work, he or she will want to know what happened, what was sched-
uled to happen, who did what (or didn’t do what), why it happened as it did,
what problems have arisen, what solutions are within reach, and what
changes need to be made. Reports that reflect very detailed information are of
use to the activity manager and the project manager but, because of their very
detail, are of little value to anyone outside of the project team.
Project Manager
The project manager is concerned with the status information of all activities
open for work during the report period. Activity reports are for the use of the
project manager. He or she may decide to pass them forward to senior man-
agement in his or her report. The activity-level reports can follow a format sim-
ilar to project-level reports.
Reports for the project manager present data at the activity level and show
effects on the project schedule. If project management software is used, the
posted data from the activity managers is used to update the project schedule
and produce reports on overall project status. Any slippage at the activity level
ripples through the successor activities, triggers a new activity schedule, and
recomputes project completion dates. These reports display all scheduling
information, including float and resource schedule data. In effect, they become
working documents for the project manager for schedule adjustments and
problem resolution. Because these reports are at a very detailed level, they are
not appropriate for distribution beyond the project team. In many cases, they
may be for the project manager’s eyes only.
Chapter 10
230
12 432210 Ch10.qxd 7/2/03 9:33 AM Page 230
Senior Management
We recommend using a graphical exception report structure to report project
status to senior management. For many projects, reports at the activity level
will be appropriate. For large projects, either milestone-level or summary task-
level reports are more effective. Senior managers have only a few minutes to
review any single project report. Keeping a report to a single page is a good
strategy. The best report format, in our experience, is the Gantt chart. These
charts require little explanation. Activities should be listed in the order of
scheduled start date, a line designating the report date should be given, and all
percent completed displayed.
TIP
If the project is sick, attach a one-page get-well plan to your report. This plan usually
is in the form of a narrative discussion of the problem, alternative solutions, recom-
mended action, and any other details relevant to the issue at hand.
Managing Project Status Meetings
To keep close track of progress on the project, the project manager needs to
have information from his or her team on a timely basis. This information will
be given during a project status meeting. At a minimum, you need to have a
status meeting at least once a week. On some of the major projects on which
we’ve worked, daily status meetings were the norm for the first few weeks,
and then as the need for daily information wasn’t as critical, we switched to
twice a week and finally to weekly status.
Who Should Attend?
To use the status meetings correctly and efficiently, it’s important to figure out
who should be in attendance. This information should be a part of your com-
munication plan.
When choosing who should attend, keep a couple points in mind:
■■ At first your status team may have a tendency to include people who are
needed only in the planning phase. If they don’t have a need to know
information, don’t make them come to a meeting and sit there without a
good reason. You are going to put out meeting minutes anyway, so those
people that aren’t needed at the actual meeting will get the minutes in
any case.
Monitoring and Controlling Progress
231
12 432210 Ch10.qxd 7/2/03 9:33 AM Page 231
■■ There will be times in a status meeting when two people will get into a
discussion where the other people in the meeting aren’t needed. If this
happens, ask them to do a sidebar meeting so that your own status meet-
ing can go on. A sidebar meeting is one in which a limited number of peo-
ple need to participate, and these types of meetings can be done more
effectively away from your status meeting. Having everyone in the room
listen to these sidebar topics isn’t useful.
Ask the people who are going to the sidebar meeting to let you know
what happens in the meeting, particularly if what they talk about impacts
the project. If possible, get a meeting summary from the people, even if
it’s only a sentence or two long. Get this circulated to the rest of the team
with your minutes so that everyone on the team is kept up-to-date. Typi-
cal attendees at sidebar meetings will be the people who must have the
problem solved and those who should be able to solve it, or at least those
who can escalate it to those who can solve it.
When Are They Held?
Usually, status meetings are held toward the end of the week. Whatever
the day, make sure it’s the same one time after time. People get used to prepar-
ing information for a status meeting if they know exactly when the meeting
will occur.
What Is Their Purpose?
The reason for a status meeting is to get information to the whole team. It may
be that on large projects the participants in the status meeting are actually rep-
resentatives of their department. You can’t have all the people on a 250-person
project team come into a meeting once a week, so make sure that someone is
there to represent the rest of the people in their section. The purpose of the
meeting is to encourage free flow of information, and that means being
sure that the people who need to have information to do their jobs get the
information at the status meeting. Remember once again that you are going to
send out minutes of the meeting, so that will take care of the people who aren’t
in attendance.
TIP
Project size may be the determining factor, but in general, we prefer a one-hour
limit. This is the maximum, and an entire hour should not be needed at every project
status meeting. Good judgment is needed here. Do not waste people’s time.
Chapter 10
232
12 432210 Ch10.qxd 7/2/03 9:33 AM Page 232
What Is Their Format?
While the format of the status review meetings should be flexible, as project
needs dictate, certain items are part of every status meeting. We recommend
that you proceed in a top-down fashion:
1. The project champion reports any changes that may have a bearing on the
future of the project.
2. The customer reports any changes that may have a bearing on the future
of the project.
3. The project manager reports on the overall health of the project and the
impact of earlier problems, changes, and corrective actions as they impact
at the project level.
4. Activity managers report on the health of activities open or scheduled
open for work since the last status meeting.
5. Activity managers of future activities report on any changes since the last
meeting that might impact project status.
6. The project manager reviews the status of open problems from the last
status meeting.
7. Attendees identify new problems and assign responsibility for their reso-
lution (the only discussion allowed here is for clarification purposes).
8. The project champion, customer, or project manager, as appropriate, offers
closing comments.
9. The project manager announces the time and place of the next meeting
and adjourns the meeting.
Minutes are part of the formal project documentation and are taken at each
meeting, circulated for comment, revised as appropriate, distributed, and filed
in the project notebook (electronic, we hope). Because there is little discussion,
the minutes contain any handouts from the meeting and list the items assigned
for the next meeting. The minutes should also contain the list of attendees, a
summary of comments made, and assigned responsibilities.
A project administrative support person should be present at the project status
review meetings to take minutes and monitor handouts. The responsibility
might also be passed around to the project team members. In some organiza-
tions, the same person is responsible for distributing the meeting agenda and
materials ahead of time for review. This advance distribution is especially
important if decisions will be made during the meeting. People are very
uncomfortable if they are seeing important information for the first time, are
expected to read and understand it, and then are expected to make a decision,
all at the same time.
Monitoring and Controlling Progress
233
12 432210 Ch10.qxd 7/2/03 9:33 AM Page 233
Managing Change
It is difficult for anyone, regardless of his or her skills at prediction and fore-
casting, to completely and accurately define the needs for a product or service
that will be implemented 6, 12, or 18 months in the future. Competition, cus-
tomer reactions, technology changes, a host of supplier-related situations, and
many other factors could render a killer application obsolete before it can be
implemented. The most frequent situation starts something like this: “Oh, I
forgot to tell you that we will also need ” or “We have to go to market no later
than the third quarter instead of the fourth quarter.” How often have you
heard sentences that start something like those examples? Let’s face it, change
is a way of life in project management. We might as well confront it and be pre-
pared to act accordingly.
Because change is constant, a good project management methodology has a
change management process in place. In effect, the change management
process has you plan the project again. Think of it as a mini-JPP session.
Two documents are part of every good change management process: project
change request and project impact statement.
Project change request. The first principle to learn is that every change is a
significant change. Adopt that maxim and you will seldom go wrong.
What that means is that every change requested by the customer must be
documented in a project change request. That document might be as simple
as a memo but might also follow a format provided by the project team. In
any case, it is the start of another round of establishing Conditions of Satis-
faction. Only when the request is clearly understood can the project team
evaluate the impact of the change and determine whether the change can
be accommodated.
Project impact statement. The response to a change request is a document
called a project impact statement. It is a response that identifies the alterna-
tive courses of action that the project manager is willing to consider. The
requestor is then charged with choosing the best alternative. The project
impact statement describes the feasible alternatives that the project man-
ager was able to identify, the positive and negative aspects of each, and
perhaps a recommendation as to which alternative might be best. The final
decision rests with the requestor.
Six possible outcomes can result from a change request:
It can be accommodated within the project resources and time lines. This
is the simplest of situations for the project manager to handle. After consid-
ering the impact of the change on the project schedule, the project manager
decides that the change can be accommodated without any harmful effect
on the schedule and resources.
Chapter 10
234
12 432210 Ch10.qxd 7/2/03 9:33 AM Page 234
It can be accommodated but will require an extension of the deliverable
schedule. The only impact that the change will have is to lengthen the
deliverable schedule. No additional resources will be needed to accommo-
date the change request.
It can be accommodated within the current deliverable schedule, but addi-
tional resources will be needed. To accommodate this change request,
the project manager will need additional resources, but otherwise the
current and revised schedule can be met.
It can be accommodated, but additional resources and an extension of the
deliverable schedule will be required. This change request will require
additional resources and a lengthened deliverable schedule.
It can be accommodated with a multiple release strategy and prioritizing of
the deliverables across the release dates. This situation comes up more
often than you might expect. To accommodate the change request, the proj-
ect plan will have to be significantly revised, but there is an alternative. For
example, suppose that the original request was for a list of 10 features, and
they are in the current plan. The change request asks for an additional two
features. The project manager asks the customer to prioritize all 12 fea-
tures. He or she will give the customer eight of them earlier than the deliv-
ery date for the original 10 features and will deliver the remaining four
features later than the delivery date for the original 10. In other words, the
project manager will give the customer some of what is requested earlier
than requested and the balance later than requested. We have seen several
cases where this compromise has worked quite well.
It cannot be accommodated without a significant change to the project.
These change requests are significant. They are so significant, in fact, as to
render the current project plan obsolete. There are two alternatives here.
The first is to deny the change request, complete the project as planned,
and handle the request as another project. The other is to call a stop to the
current project, replan the project to accommodate the change, and launch
a new project.
An integral part of the change control process is the documentation. First, we
strongly suggest that every change be treated as a major change until proven
otherwise. To do otherwise is to court disaster. That means that every change
request follows the same procedure. Figure 10.14 is an example of the steps in
a typical change process. The process is initiated, and the change request is
submitted by the customer, who uses a form like the one shown in Figure
10.15. This form is forwarded to the manager or managers charged with
reviewing such requests. They may either accept the change as submitted or
return it to the customer for rework and resubmission. Once the change
request has been accepted, it is forwarded to the project manager, who will
perform an impact study.
Monitoring and Controlling Progress
235
12 432210 Ch10.qxd 7/2/03 9:33 AM Page 235