Effective Project Management Traditional, Adaptive, Extreme Third Edition phần 9 pot
Bạn đang xem bản rút gọn của tài liệu. Xem và tải ngay bản đầy đủ của tài liệu tại đây (568.83 KB, 50 trang )
opportunities in the pipeline, and even lesser on the ? because the industry
isn’t in the research and development mode. In a volatile, high-growth, high-
tech industry the allocations might be very different. More resources will be
spent on the stars and ? and fewer on the cash cows. Cash cows will have a
very short useful life, and any investments in them will be risky.
Project Distribution Matrix
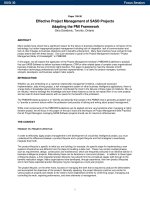
Simple, yet elegant in its simplicity, the Project Distribution Matrix model,
shown in Figure 20.4, says that there must be a mix of projects in the portfolio.
This mix will be dictated by the skill inventory of those who will work on
projects, as well as the needs of the organization to attain and sustain market
share. It can be used in conjunction with the models shown previously to
ensure a healthy mix is present in the project portfolio. The Project Distribution
Matrix is similar to the Strategic Alignment Model in that it defines a rule for
classifying projects. The rule is a two-way classification, as shown in the figure.
New—Enhancement—Maintenance
The columns of the matrix classify projects according to whether they are New,
Enhancement, or Maintenance.
Figure 20.4 Project Distribution Matrix.
Project Focus
Strategic
Tactical
Operational
New Enhancement Maintenance
Project Portfolio Management
361
24 432210 Ch20.qxd 7/2/03 9:34 AM Page 361
New. A new project is one that proposes to develop a new application,
process, or product.
Enhancement. An enhancement project is one that proposes to improve an
existing process or product.
Maintenance. A maintenance project is one that simply proposes to conduct
the normal care and feeding of an existing operation, which could include
fixing errors that have been detected or otherwise updating some features
that have become obsolete or are part of a process that has been changed.
Strategic—Tactical—Operational
The rows of the matrix classify projects based on their role in the enterprise:
Strategic. Astrategic project is one that focuses on the strategic elements of the
enterprise. Applications that extract basic data from businesses, society, and
the economy and translate that data into policy formulation are examples of
Strategic projects.
Tactical. Tactical projects are projects that look at existing processes and proce-
dures and propose ways to make improvements by changing or replacing
the process or procedure.
Operational. Operational projects are those that focus on existing processes
and try to find ways to improve efficiency or reduce costs.
How Are You Going to Allocate Your Resources?
The application of this model is also quite straightforward. The enterprise that
has defined a project classification rule must now decide what resources will
be allocated to each of the nine categories. With that decision made, the enter-
prise accepts project proposals from its various departments as to what
projects they wish to undertake. A feature of this model is that it can be tied to
the resource pool of skilled employees. The required skills across each of these
nine categories are different. To some extent that may dictate how much
emphasis is placed on each category. The enterprise will want to use its avail-
able skills, so the relative priority of each category can help or hinder that
effort.
NOTE
The Graham-Englund Selection Model (discussed later in this chapter) incorporates
available staff capacity based on skills as part of its selection strategy.
Chapter 20
362
24 432210 Ch20.qxd 7/2/03 9:34 AM Page 362
Growth versus Survival Model
This way of categorizing projects is the simplest of all that we are presenting.
Projects are either focused on growth or survival. Growth projects are those that
propose to make something better in some way. Obviously, these are discre-
tionary projects. Survival projects, on the other hand, are the “must-do” projects.
These projects must be done, or the enterprise will suffer irreparable damage.
Another way of looking at this model is that survival projects are projects that
must be done, and all other projects are growth projects.
How Are You Going to Allocate Your Resources?
If the budget is in a contracting phase, you will probably allocate most of your
resources to the survival category. On the other hand, if you are in an expan-
sion phase, you will allocate most of your resources to the growth category.
Project Investment Categories
The Project Investment Categories Model is a close kin of the financial invest-
ment portfolio. It identifies categories of investments. These categories define
types of projects just as a financial portfolio defines types of investment instru-
ments. In the case of projects, you define the following categories:
Infrastructure. Projects that strengthen the hardware and software systems
that support the business
Maintenance. Projects that update existing systems or products
New products. Projects that propose entirely new products or services
Research. Projects that investigate new products, services, or systems to
support the business
Each type of project will receive some percentage of the resource pool.
How Are You Going to Allocate Your Resources?
This model operates just like the BCG Products/Services Matrix discussed ear-
lier in the chapter. Both models require the portfolio manager to establish a
distribution across existing and new products and services. The distribution
will most likely be directly related to whether the enterprise is in a growth or
maintenance posture with respect to its coming investment strategy.
Project Portfolio Management
363
24 432210 Ch20.qxd 7/2/03 9:34 AM Page 363
Choosing Where to Apply These Models
Depending on the particular application that you have in mind, you will want
to choose the most appropriate model. This section helps you consider some of
the possibilities.
Corporate Level
If your organization has an enterprise-wide project management office that
has management responsibility for the project portfolio, then your choice of
model is limited to two. Both the BCG Products/Services Matrix and the
Strategic Alignment Model are good candidates. Both focus on the strategic
goals of the organization at the highest levels and can directly relate a single
project to how well it aligns with defined strategies. That provides a basis for
prioritizing a project.
Functional Level
At the corporate level, dollars are allocated to strategic initiatives that impact
the entire organization, whereas at the functional level, the information tech-
nology department, for example, the situation can be quite different. Resources
are allocated to operational- or tactical-level projects. Rather than allocating
dollars, it is more likely that the resource to be allocated is professional staff. In
that case, the Project Distribution Matrix, Growth versus Survival Model, or
Project Investment Categories will do the job.
NOTE
Later in this chapter we discuss the Graham-Englund Selection Model. It doesn’t fit
into the framework of the other models, so we treat it separately. In fact, the Graham-
Englund Selection Model is built around the allocation of professional resources to
prioritized projects as its basic operating rule. That would make the Graham-Englund
Selection Model a good choice for functional-level projects.
Evaluating Project Alignment to the Portfolio Strategy
This evaluation is a very simple intake task that places a proposed project into
one of several funding categories as defined in the model being used. The
beginning of the project intake process involves determining whether the proj-
ect is in alignment with the portfolio strategy and placing it in the appropriate
“bucket.” These buckets are defined by the strategy that is used, and each
bucket contains a planned dollar or resource amount. Once all of the projects
Chapter 20
364
24 432210 Ch20.qxd 7/2/03 9:34 AM Page 364
have been placed in buckets, each bucket is passed to the next phase, where
the projects that make up a bucket are prioritized.
There are two ways that this intake process can take place:
■■ The person proposing the project does the evaluation.
■■ The intake person does the evaluation.
It can work well both ways. If the person proposing the project does the eval-
uation, he or she will need a clear definition of each funding category in the
portfolio strategy. The project proposal may be returned to the proposer for
clarification or revision before being placed in a funding category. Some pro-
cedures may ask the proposer to classify the project, and then this intake
process is nothing more than an administrative function. This does place the
burden on the proposer and not on the portfolio manager. However, there is
the possibility of biasing the evaluation in favor of the proposer. The bias
arises when the proposer, having such intimate familiarity with the proposal,
will subjectively evaluate it rather than objectively evaluate it. There is also the
strong likelihood that these types of evaluations will not be consistent across
all projects. Having an intake person conduct the evaluations ensures that all
proposals will be evaluated using a consistent and objective criteria.
In other cases the process is more formal, and the project proposal is screened
to specific criteria. This formal evaluation is now a more significant process and
may involve the portfolio manager or a portfolio committee. Projects that do
not match any funding category are returned to the proposer and rejected with
no further action specified or requested. If the portfolio manager does the eval-
uation, the problem of bias largely disappears. In this scenario the proposer
must follow a standard procedure for documenting the proposed project. We
return to that topic at the end of this chapter in the section titled Preparing Your
Project For Submission to the Portfolio Management Process.
The deliverable from this phase of the process is a simple categorization of
projects into funding categories.
Prioritizing Projects and Holding Pending
Funding Authorization
The first tactical step in every portfolio management model involves prioritiz-
ing the projects that have been shown to be aligned with the portfolio strategy.
Recall that the alignment placed the project in a single funding category. It is
those projects in a funding category that you prioritize. When you are finished,
each funding category will have a list of prioritized projects. There are dozens
Project Portfolio Management
365
24 432210 Ch20.qxd 7/2/03 9:34 AM Page 365
of approaches that could be used to establish that prioritization. Some are non-
numeric; others are numeric. Some are very simple; others can be quite com-
plex and involve multivariate analysis, goal programming, and other complex
computer-based algorithms. Our approach here is to identify those methods
that can easily be implemented in the public sector and do not require a com-
puter system for support, although for some, a simple spreadsheet application
can reduce some of the labor intensity of the process. We discuss six models:
■■ Forced Ranking
■■ Q-Sort
■■ Must-Haves, Should-Haves, Nice-to-Haves
■■ Criteria Weighting
■■ Paired Comparisons
■■ Risk/Benefit
See Chapter 14 for an additional discussion of these prioritization approaches.
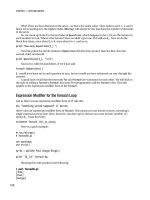
Forced Ranking
This approach is best explained by way of an example. Suppose 10 projects
have been proposed. Number them 1, 2, 10 so that we can refer to them later
on. Suppose that the portfolio management team has six members (A, B, F),
and they are each asked to rank the 10 projects from most important (1) to least
important (10). They can use any criteria they wish, and they do not have
to describe the criteria they used. The results of their rankings are shown in
Table 20.1.
Table 20.1 Forced Ranking of 10 Projects
PROJECT # A B C D E F RANK FORCED
SUM RANK
1253216192
24327910356
3749863377
4185122193
5368475335
689109108549
7511334171
8624541224
9 10 10 7 10 8 9 54 10
10 9 7 6 6 5 7 40 8
Chapter 20
366
24 432210 Ch20.qxd 7/2/03 9:34 AM Page 366
The individual rankings from each of the six members for a specific project are
added to produce the rank sum for each project. Low values for the rank sum are
indicative of projects that have been given high priority by the members. So, for
example, Project 7 has the lowest rank sum and is therefore the highest-priority
project. Ties are possible. In fact, the preceding example has two ties (1 and 4, 6
and 9). Ties can be broken in a number of ways. For example, we prefer to use
the existing rankings to break ties. In this example, a tie is broken by taking the
tied project with the lowest rank score and moving it to the next lowest forced
rank. For example, the lowest rank for Project 1 is 6, and the lowest rank for Proj-
ect 4 is 8. Therefore, the tie is broken by giving Project 1 a rank of 2 and Project 4
a rank of 3.
Forced ranking works well for small numbers of projects, but it does not scale
very well.
Q-Sort
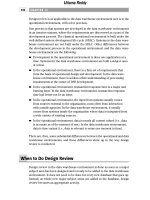
When you use Q-Sort (see Figure 20.5), projects are first divided into two
groups: high priority and low priority. The high-priority group is then divided
into two groups: high priority and medium priority. The low-priority group is
also divided into two groups: low priority and medium priority. The next step
is to divide the high-priority group into two groups: very high priority and
high priority. The same is done for the low-priority group. The decomposition
continues until all groups have eight or fewer members. As a last step, you
could distribute the medium-priority projects to the other final groups.
Q-Sort is simple and quick. It works well for large numbers of projects. It also
works well if done as a small group exercise using a consensus approach.
Must-Haves, Should-Haves, Nice-to-Haves
This approach, and variations of it, is probably the most commonly used way
of ranking. As opposed to the forced rank where each individual project is
ranked, this approach creates three categories. The person doing the ranking
only has to decide which category the project belongs in. The agony of having
to decide relative rankings between pairs of projects is spared by this
approach. The number of categories is really arbitrary, and the names of the
categories are also arbitrary.
TIP
We prefer to use the naming convention “must-haves, should-haves, nice-to-haves,”
rather than categories like high, medium, low or A, B C. The names avoid the need to
define what each category means.
Project Portfolio Management
367
24 432210 Ch20.qxd 7/2/03 9:34 AM Page 367
Figure 20.5 An example of the Q-Sort.
This method is even simpler than the Q-Sort. If the number of projects is large,
you may need to prioritize the projects within each of the three groups in order
to make funding decisions.
Criteria Weighting
There are literally hundreds of criteria weighting models. They are all quite
similar, differing only in the minor details. We give one example of criteria
weighting, but there are several that all apply the same principles. A number
of characteristics are identified, and a numeric weighting is applied to each
characteristic. Each characteristic has a scale attached to it. The scales usually
range from 1 to 10. Each project is evaluated on each characteristic, and a scale
value given to the project. Each scale value is multiplied by the characteristic
weight, and these weighted scale values are added. The highest result is asso-
ciated with the highest-priority project.
Proposed
Projects
High-
Priority
Projects
Medium-
Priority
Projects
Low-
Priority
Projects
High-
Priority
Projects
High-
Priority
Projects
Medium-
Priority
Projects
Lowest-
Priority
Projects
Highest-
Priority
Projects
Low-
Priority
Projects
Low-
Priority
Projects
Chapter 20
368
24 432210 Ch20.qxd 7/2/03 9:34 AM Page 368
Figure 20.6 Criteria weighting.
Figure 20.6 shows a sample calculation for one of the proposed projects for the
portfolio. The first column lists the criteria against which all proposed projects
for this portfolio will be evaluated. The second column lists the weight of
that criterion (higher weight indicates more importance to the scoring algo-
rithm). The third through the seventh columns list the evaluation of the project
against the given criteria. Note that the evaluation can be given to more than
one level. The only restriction is that the evaluation must be totally spread
across the levels. Note that each criteria level adds to one. The eighth column is
the sum of the levels multiplied by the score for that level. This process is totally
adaptable to the nature of the portfolio. The criteria and criteria weight
columns can be defined to address the needs of the portfolio. All other columns
are fixed. The last two columns are calculated based on the values in columns
2 through 7.
Paired Comparisons Model
The next scoring model is called the Paired Comparisons Model. In this model,
every pair of projects is compared. The evaluator chooses which project in the
pair is the higher priority. The matrix in Figure 20.7 is the commonly used
method for conducting and recording the results of a paired comparisons
exercise.
10
10
10
8 1.0
0.6 0.4
6
4
10
10
8.0
6.0
4.0
2.0
6.4
5.0
1.2
7.4
80.0
60.0
40.0
16.0
38.4
20.0
12.0
74.0
340.4
1.0
0.2
0.2
0.7
0.6 0.2
1.0
0.8
0.5 0.5
0.3
Criteria
Fit to Mission
Criteria
Weight
Fit to Objectives
Fit to Strategy
Contribute to Goal A
Contribute to Goal B
Contribute to Goal C
Uses Strengths
Uses Weaknesses
Expected
Level Weight
Expected
Weighted Score
Very Good (8)
Good (6)
Fair (4)
Poor (2)
Very Poor (0)
Project Portfolio Management
369
24 432210 Ch20.qxd 7/2/03 9:34 AM Page 369
Figure 20.7 An example of a paired comparisons.
First note that all 10 projects are defined across the 10 columns and down the
10 rows. For 10 projects, there are 45 comparisons that you have to make. The
45 cells above the diagonal contain the comparisons you make. First, Project 1
is compared to Project 2. If Project 1 is given a higher priority than Project 2, a
“1” is placed in cell (1, 2) and a “0” is placed in cell (2, 1). If Project 2 had been
given a higher priority than Project 1, you would place a “0” in cell (1, 2) and a
“1” in cell (2, 1). Next, Project 1 is compared to Project 3, and so on, until Proj-
ect 1 has been compared to all other nine projects. Then Project 2 is compared
to Project 3, and so on. Continuing in this fashion, the remaining cells are com-
pleted. The final step is to add all the entries in each of the 10 rows, producing
the rank for each project. The higher the score, the higher the rank. The right-
most column reflects the results of those calculations. Note that Project 7 had
the highest overall priority.
NOTE
This Paired Comparisons Model is a quick and simple method; unfortunately, it
doesn’t scale very well. For example, 100 projects would require 4950 comparisons.
1111011011
10987654321
2110011000
3110010010
4110011111
5010010100
6110000000
7111111111
8110111110
9000000000
10 100010000
RANK
27X
SUM
64X
4X
7X
3X
2X
9X
7X
0X
2X
5
2
7
8
1
2
10
9
Chapter 20
370
24 432210 Ch20.qxd 7/2/03 9:34 AM Page 370
Figure 20.8 Risk/Benefit Matrix.
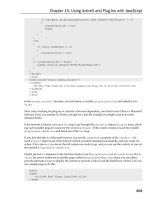
Risk/Benefit
The final scoring model is the Risk/Benefit Matrix. There are many ways to do
risk analysis, from subjective to very sophisticated mathematical models. The
one we are introducing is a very simple quasi-mathematical model. Risk is
divided into five levels (1, 2, 5). Level 1 is a very low risk (or high probability
of success), and level 5 is a very high risk (or very low probability of success).
Actually, any number of levels will do the job. Defining three levels is also quite
common. In this model we are going to assess two risks: the risk of technical
success and the risk of business success. These are arranged in Figure 20.8.
Each project is assessed in terms of the probability of technical success and
the probability of business success. The probability of project success is estimated
as the product of the two separate probabilities. To simplify the calculation, the
graph shows the results of the computation by placing the project in one of
three areas:
1
1
3
Probability of Business Success
Probability of Technical Success
2
3
4
5
25
1 = high, 5 = low
4
Project Portfolio Management
371
24 432210 Ch20.qxd 7/2/03 9:34 AM Page 371
■■ Fund projects that fall in the lightly shaded cells.
■■ Consider projects that fall in the cells with no shading.
■■ Refer projects in the darkly shaded cells back to the proposing agency
unless there is some compelling reason to fund them.
If there are a large number of projects, you will need to prioritize those that fall
in the lightly shaded cells. A good start on that would be to prioritize the cells
starting in the upper left corner and working toward the center of the matrix.
Selecting a Balanced Portfolio Using the
Prioritized Projects
You might think that because you have a prioritized list in each funding cate-
gory and you know the resources available for those projects, the selection
process would be simple and straightforward, but it isn’t. Selection is a very
challenging task for any portfolio management team. The problem stems from
the apparent conflict between the results of evaluation, the ranking of projects
from most valuable to least valuable, and the need to balance the portfolio
with respect to one or more variables. These two notions are often in conflict.
As a further complication, should partial funding of projects be allowed? You
will see that conflict more clearly later in the section “Balancing the Portfolio.”
There are several approaches to picking the project portfolio. As you have
already seen, in this chapter we chose to deal with five portfolio strategies and
six prioritization approaches. Those gave us 30 possible combinations for
selection approaches, and there are many more that we could have discussed.
From among the 30 that we could examine, we have picked three to focus on:
■■ Strategic Alignment Model and Weighted Criteria
■■ Project Distribution Matrix and Forced Ranking
■■ Graham-Englund Selection Model with the Project Investment Categories
and the Risk/Benefit Matrix
This section shows the results of combining the previous sections into an
approach for selecting projects for the portfolio. By choosing the BCG Prod-
ucts/Services Matrix, Strategic Alignment Model, Project Distribution Matrix,
Growth versus Survival Model, or the Project Investment Category Model,
you make a statement about how your resources will be allocated. Each one of
these models generates some number of “buckets” into which resources are
distributed. Those buckets with more resources are valued more than those
with fewer resources. These buckets represent the supply of resources avail-
able to the projects that are demanding those resources. It would be foolish to
Chapter 20
372
24 432210 Ch20.qxd 7/2/03 9:34 AM Page 372
expect there to be a balance between the supply of resources and the demand
for them. Some buckets will have more resources than have been requested,
while others will not have enough resources to meet demand. This section
explains how to resolve those differences to build a balanced portfolio.
Balancing the Portfolio
Unfortunately, there isn’t a perfect or best way to build a balanced portfolio.
There are basically two approaches and neither one ensures an optimal solution:
■■ The first approach is to make one master list of prioritized projects. How-
ever, if you simply use that prioritized list of projects using any of the
models presented so far, you may end up with less than satisfactory
results. For example, you could end up funding a number of short-term,
low-risk projects with low organizational value. Alternatively, you could
end up funding all long-term, high-risk projects with high organizational
value. In either case the resulting portfolio would not be representative
of the organization’s strategy. In other words, you could end up with a
portfolio that was not at all in line with the corporate strategy.
■■ The second approach, and the one that we have taken here, is to separate
projects into buckets and prioritize the projects that have been placed in
each bucket and do this for every bucket. While this certainly gives us a
balanced portfolio, it may not give us the best portfolio. Why is that?
Some buckets may have been very popular choices for proposed projects,
and a very good project may not have reached high enough on the prior-
ity list to be funded. Yet that project may be a much better alternative than
some project in another bucket that did receive funding. It’s basically the
luck of the draw.
So which approach should you take? We recommend the second, and there are
two reasons for our recommendation:
■■ Prioritizing a single list, which may be long, is far more difficult than work-
ing with several shorter lists. The work can be divided among several per-
sons or groups in the second case, but not in the first case. Furthermore,
when you first align projects with funding categories and then prioritize
within funding categories, you are not only working with a smaller number
of projects but with a group of projects that are more homogeneous.
■■ Once the projects have been aligned within funding categories, the portfo-
lio manager may then allocate the resources across the funding categories.
That avoids the situation where there could otherwise be a wide variance
between the resources that are being requested and those that are being
Project Portfolio Management
373
24 432210 Ch20.qxd 7/2/03 9:34 AM Page 373
offered in each category. The caution here is that the portfolio manager
may try to honor the requests and abandon any portfolio strategy. You
can’t have it both ways.
The examples given in the sections that follow illustrate some of these ideas.
These are but a few of the many examples we could give, but they are suffi-
cient to illustrate some of the ways to mitigate against such outcomes and
ensure a balanced portfolio that reflects the organization’s investment strategy.
Strategic Alignment Model and Weighted Criteria
In this section we use the Strategic Alignment Model to select projects for the
portfolio. Figure 20.9 shows one variation that we might use.
Figure 20.9 Achieving balance with the Strategic Alignment Model.
P#1 $2M 0.6
$1.2M
0.8
$0.3M
0.3
$0.6M
0.4
$1.6M
0.3
$0.3M
P#2 $2M
P#3 $4M
P#4 $1M
P#5 $3M
P#6 $4M
P#7 $3M
P#8 $3M
P#9 $1M
P#10 $2M
AwardScore
0.2
$0.4M
0.2
0.6
$2.4M
0.2
$0.2M
0.2
0.7
0.8
$2.4M
Budget
Proposed
0.5
$0.5M
0.8
$2.4M
0.3
$0.3M
0.
$0.6M
0.2
$0.2M
0.4
$0.8M
0.1
$0.2M
0.3
$0.9M
0.2
$0.2M
0.140
0.150
0.220
0.240
0.260
0.160
0.300
0.130
0.200
0.120
0.7
$2.1M
0.4
$0.4M
0.4
$0.8M
0.2
$0.6M
$2.0M
$1.6M
$4.0M
$1.0M
$3.0M
$0.3M
$3.0M
$3.0M
$0.8M
$0.7M
Value/Mission
Goal BGoal A
Objective 1
0.1
Objective 2
0.3
Objective 3
0.2
Objective 4
0.3
Objective 5
0.1
$4M $5M $3M $4M $4M
Goal C
Chapter 20
374
24 432210 Ch20.qxd 7/2/03 9:34 AM Page 374
Each objective is weighted with a number between 0 and 1. Note that the sum of
the weights is 1. These weights show the relative importance of each objective
compared against the others. Below each objective is the budget allocated to that
objective. The total budget is $20M. Ten projects are being considered for this
portfolio. The proposed budget for each is shown with the project number. The
total request is for $25M. In this example, a project may be associated with more
than one objective. We can do that by assigning to each project objective pair a
weight that measures that strength of the relationship of that project to that
objective. This weight was the result of evaluating the alignment of the projects
to the objectives. The sum of the weights for any project is 1.0. To establish the
priority order of the 10 projects, multiply the objective weight by the project
weight and add the numbers. The result of that calculation is shown in the Score
column for all 10 projects in the example we are using. The higher the project’s
score, the higher the project should be on your list of projects to fund. So Project
7 is the top-priority project with a score of .300. Project 10 is the tenth priority
with a score of .120.
The awards to the projects are made by starting with the highest-priority proj-
ect, which in the example is Project 7. The request is for $3M. Of that amount,
80 percent will come from the budget for Strategy 2 and 20 percent will come
from Strategy 4. That reduces the budget for Strategy 2 from $5M to $2.6M and
for Strategy 4 from $4M to $3.4M. The process continues with the next-highest-
priority project and continues until the budget for each strategy is allocated or
there are no more requests for resources. There may be cases where a project
receives only partial funding from a funding category. For example, Project 10
should have received $1.6M from Strategy 1 but when it came up for funding,
there was only $0.3M left in that budget. Following the example to completion
results in the allocations shown in Figure 20.9. The requests totaled $25M, the
budget totaled $20M, and the allocations totaled $19.4M. The remaining $0.6M
should not be redistributed to those projects that did not receive their
requested support. These resources are held pending performance of the port-
folio and the possible need to reallocate resources at some later date.
This section gives you but one example of applying an adaptation of criteria
weighting to the Strategic Alignment Model to produce a portfolio selection
approach. This model is probably the best of those discussed in this chapter
because it allows the portfolio manager to express the enterprise strategy in a
direct and clear fashion through the weights chosen for each objective. It also
shows how the proposed projects relate to that prioritization through the
weighted scores on each objective. The model provides management with a
tool that can easily adapt to changing priorities and that can be shared with the
organization.
Project Portfolio Management
375
24 432210 Ch20.qxd 7/2/03 9:34 AM Page 375
Project Distribution Matrix and Forced Ranking Model
To further illustrate the process of creating a portfolio selection approach, next
we combine the Project Distribution Matrix and the Forced Ranking Model.
First, assume that the total dollars available for Major IT Projects is $20M and
that the dollars have been allocated as shown in Figure 20.10. We’ll use the
same 10 projects from the previous section with the same funding requests. The
projects are listed in the order of their ranking within each funding category.
The first thing to note in this example is that the investment decisions do not line
up very well with the funding requests from the 10 projects. There is a total of
$9M in four funding categories with no projects aligned in those categories. Your
priorities as portfolio manager were expressed by your allocation of funds to the
various funding categories. However, the project proposals do not line up with
that strategy. Are you willing to make any budget changes to better accommo-
date the requests? You should, but with the stipulation that you do not compro-
mise your investment strategy. Legitimate changes would be to move resources
to the left but in the same row or up but in the same column. If you agree that
that is acceptable, then you end up with Figure 20.11. $3M was moved from the
Strategic/Maintained category to the Strategic/Enhanced category, and $1M
was moved from the Operational/New category to the Tactical/New category.
Any other movement of monies would compromise the investment strategy.
Figure 20.10 Project Distribution Matrix with budget and funding requests.
Project Focus
Strategic
New Enhancement Maintenance
Budget $3M Budget $3M
P#2
P#10
P#6
$2M
$2M
$4M
P#8 $3M
Budget $3M
Tactical
Operational
P#7
P#5
$3M
$3M
Budget $3M Budget $2M
P#1
P#4
P#9
$2M
$1M
$1M
Budget $1M
Budget $1M Budget $2M Budget $2M
P#3 $4M
Chapter 20
376
24 432210 Ch20.qxd 7/2/03 9:34 AM Page 376
Figure 20.11 Project Distribution Matrix with adjusted budget and funding requests.
After the allocations have been made, you are left with Figure 20.12. The bal-
ances remaining are also shown in Figure 20.12. These monies are to be held
pending changes to project status as project work is undertaken.
Graham-Englund Selection Model and the Risk/Benefit Matrix
So far in the examples the only resource we have been working with is money.
However, one of the most important resources, at least for information technol-
ogy projects, is people. Staff resources are composed of professionals of varying
skills and experiences. As you consider the portfolio of projects, you need to
take into account the ability of the staff to deliver that portfolio. For example, if
the portfolio were largely new or enhanced strategic applications, you would
draw heavily on your most experienced and skilled professionals. What would
you do with those who were lesser skilled or experienced? That is an important
consideration, and the Graham-Englund Selection Model is one model that
approaches project selection with that concern in mind. Basically it will work
from a prioritized list of selected projects and staff them until certain sets of
skilled and/or experienced professionals have been fully allocated. In other
words, people, not money, become the constraint on the project portfolio. Sev-
eral related problems arise as a result. We will briefly discuss some of the issues
and staffing concerns that this approach raises.
Project Focus
Strategic
New Enhancement Maintenance
Budget $3M Budget $6M
P#2
P#10
P#6
$2M
$2M
$4M
P#8 $3M
Tactical
Operational
P#7
P#5
$3M
$3M
Budget $4M Budget $2M
P#1
P#4
P#9
$2M
$1M
$1M
Budget $1M
Budget $2M Budget $2M
P#3 $4M
Project Portfolio Management
377
24 432210 Ch20.qxd 7/2/03 9:34 AM Page 377
Figure 20.12 Project Distribution Matrix with budget balances and funding decisions.
The Graham-Englund Selection Model is a close parallel to those previously
discussed, but it has some interesting differences. We put it in here because of
its simplicity and the fact that it has received some attention in practice. Figure
20.13 is an adaptation of the portfolio project life cycle to the Graham-Englund
Selection Model.
What Should We Do?
The answer to this question is equivalent to establishing the portfolio strategy.
In the case of the Graham-Englund Selection Model, we are referring to the IT
strategy of the organization. The answer can be found in the organization’s
values, mission, and objectives, and it is the general direction in which they
should be headed consistent with who they are and what they want to be. It is
IT’s role to support those goals and values. IT will do that by crafting a portfo-
lio of projects consistent with those goals and values. Think of answering
“What should we do?” as the demand side of the equation. You will use the
project investment categories (infrastructure, maintenance, new products, and
research) to identify the projects you should do. These categories loosely align
with the skill sets of the technical staff and will give you a basis for assigning
resources to projects. In fact, any categorization that allows a mapping of skills
to projects will do the job. We have kept it simple for that sake of the example,
but this approach can get very complex.
Project Focus
Strategic
New Enhancement Maintenance
Budget $3M
P#2
P#10
P#6
$2M
$2M
$2M
P#8 $2M
Tactical
Operational
P#7
P#5
$2M
0
Budget $2M
P#1
P#4
P#9
$2M
$1M
$1M
P#3 $1M
Chapter 20
378
24 432210 Ch20.qxd 7/2/03 9:34 AM Page 378
Figure 20.13 An adaptation of the Graham-Englund Selection Model.
Figure 20.14 Project staffing requirements.
Senior Project
Manager
#
Available
P#1
I
X
2
P#2
I
P#3
M
P#4
M
P#5
M
P#6
N
P#7
N
P#8
N
P#9
R
P#10
R
X
X
Project Manager
Associate Project
Manager
Systems Architect
Database Architect
Senior Programmer
Programmer
Associate
Programmer
Test Technician
3
2
4
4
2
3
2
5
X
X
XXXXX
XXXXX
X
X
X
XXX
XXXX
X
XX
X
XXX
XXXX
XXX
XXX
What should
we do?
What can
we do?
What will
we do?
How will we
do it?
Project Portfolio Management
379
24 432210 Ch20.qxd 7/2/03 9:34 AM Page 379
Figure 20.14 is a list of the 10 projects and the skilled positions needed to staff
them. The second column gives the number of staff in each position that is
available for these 10 projects. Again, we have kept the data simple for the sake
of the example.
What Can We Do?
The answer to this question is found by comparing project requirements with
the organization’s resource capacity. Current commitments come into play
here, as the organization must look at available capacity rather than just total
capacity.
NOTE
Dealing with the issue of what your organization can do raises the important issue
of having a good human resource-staffing model in place, one that considers future
growth of the enterprise, current and projected skills inventories, training programs,
career development programs, recruiting and hiring policies and plans, turnover,
retirements, and so on.
Think of answering “What can we do?” as the supply side of the equation.
Figure 20.14 lists the projects that can be done with the staff resources avail-
able. Under each project number is the type of project (I = infrastructure, M =
maintenance, N = new product, and R = research). However, it does not say
which projects will be done. Not all of them can be done simultaneously with
the available staff resources, so the question as to which ones will be done is a
fair question.
What Will We Do?
The list of projects given in Figure 20.14 is longer than the list of projects you
will do. The creation of the “will-do” list implies that some prioritization has
taken place. Various criteria such as return on investment, break-even analysis,
internal rate of return, and cost/benefit analysis might be done to create this
prioritized list. In this example we will use the list that results from the
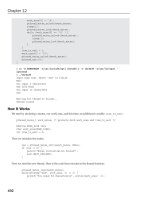
Risk/Benefit Matrix, as shown in Figure 20.15.
The priority ordering of the projects based on the probabilities of success is
P#1, P#4, P#5, P#2, P#7, P#3, P#6, P#8, P#9, and P#10. If you staff the projects in
that order, you will be able to staff Projects 1, 4, 5, 2, and 7. At that point you
will have assigned all resources except one senior project manager. Projects 3,
6, and 8 did fall in the acceptable risk categories, but there are no resources left
to staff them.
Chapter 20
380
24 432210 Ch20.qxd 7/2/03 9:34 AM Page 380
Figure 20.15 Projects prioritized using the Risk/Benefit Matrix.
However, the example is oversimplified. You have assumed that a person is
staffed 100 percent to the project. That is unlikely. In reality, a scarce resource
would be scheduled to work on projects concurrently so as to allow more
projects to be active. In reality, you would sequence the projects rather than
start them all at the same time. Projects have differing durations, and this
difference frees up resources to be reassigned. In any case, the example has
shown you how the process works.
How Will We Do It?
Answering this question is roughly equivalent to the selection phase in the
portfolio project life cycle. In the case of resource management, “How will we
do it?” is just a big staffing and scheduling problem. By scheduling scarce
resources across the prioritized list, you are placing more projects on active
status; that is, they will be placed in the portfolio. Detailed project plans are
put in place, and the scheduling of scarce resources across the projects is coor-
dinated. Performance against those plans is carefully monitored because the
resource schedule has created a dependency between the projects. The critical
1
1
3
Probability of Business Success
Probability of Technical Success
2
3
4
5
25
1 = high, 5 = low
4
P#4
P#5
P#2
P#7
P#6 P#9
P#1
P#3 P#8 P#10
Project Portfolio Management
381
24 432210 Ch20.qxd 7/2/03 9:34 AM Page 381
chain approach to project management offers considerable detail on schedul-
ing scarce resources across multiple projects. The interested reader should
referred back to Chapter 12 of this book, where we discuss critical chain
project management in more detail, as well as the book Critical Chain Project
Management by Lawrence Leach.
Balancing Using Partial Funding or Staffing of Projects
Earlier in the chapter we asked the question about whether partial funding
would be allowed. The tentative answer to the question of partial funding or
partial staffing is yes, because it yields a couple of key benefits. The most obvi-
ous benefits are that it puts more projects into active status and gives us a
chance to better control the risk in the portfolio. If one of those partially funded
projects doesn’t meet muster, it can be postponed or cancelled and the remain-
ing resources reallocated to other partially funded projects that are meeting
muster. There is one major drawback that the portfolio manager must contend
with: The delivery date of the partially funded projects will be extended into
the next budget cycle. That may mean a delay in getting products or services
into the market and hence delay the revenue stream. That has obvious busi-
ness implications that must be taken into account.
Managing the Active Projects
In this last phase, you continuously compare the performance of the projects in
the portfolio against your plan. Projects can be in one of three statuses: On Plan,
Off Plan, or In Trouble. You will see how that status is determined and what
action can be taken as a result. Here, the challenge is to find performance mea-
sures that can be applied equitably across all the projects. Two come to mind:
■■ Cost schedule control
■■ Milestone trend charts
The detailed discussion of these is given later in this section.
To bring closure to the final phase, projects can be postponed, cancelled, or,
believe it or not, completed, and you will see exactly how these endings affect
the portfolio going forward.
So, the project is underway. Regardless of the effort that was expended to put
a very precise and complete plan in place, something will happen to thwart
those efforts. In the 35 years that we have been managing projects, not a single
project went according to plan. That wasn’t due to any shortcomings on our
Chapter 20
382
24 432210 Ch20.qxd 7/2/03 9:34 AM Page 382
part. It is simply a fact of life that things will happen that could never have
been foreseen, and the project will be impacted. Corrective actions will have to
be taken. In this module you will see two reporting tools that allow an apples-
to-apples comparison of the status of projects in the portfolio. The first tool is
applied at the portfolio management level, while the second tool is applied at
the project level.
Project Status
As mentioned, there are three categories for the status of active projects: On
Plan, Off Plan, or In Trouble. The next sections take a look at each of these
states and how that status might be determined.
On Plan
Even the best of plans will not result in a project that stays exactly on schedule.
A certain amount of variance from the plan is expected and is not indicative of
a project in jeopardy. The threshold between On Plan and Off Plan is a subjec-
tive call. We offer some guidelines for this variance later in the chapter, in the
section titled SPI and CPI Trend Charts.
Off Plan
Once a project crosses that threshold value, it moves from On Plan to Off Plan.
For a project to be Off Plan is not unexpected. But what is expected is to get
back On Plan. If the project manager cannot show the corrective action that
will be taken to get the project back On Plan and when that event is likely to
occur, there is a problem and the project has now moved to In Trouble. The
project can also move to In Trouble if it passes a second threshold value that
separates Off Plan from In Trouble.
In Trouble
No matter in what way the project reaches the In Trouble condition, the impli-
cations are very serious. To be In Trouble means that there is not much chance
that the project can be restored. Serious intervention is required because the
problem is out of control and out of the range of the project manager’s abilities
to correct. However, just because a project is In Trouble doesn’t necessarily
mean that the project manager is at fault. There may be cases where freak
occurrences and random acts of nature have put the project in this category.
The project manager is unable to put a get-well plan in place and is asking for
help that goes beyond his or her range of authority. The portfolio manager is
Project Portfolio Management
383
24 432210 Ch20.qxd 7/2/03 9:34 AM Page 383
considering canceling the project unless there is some compelling reason why
that action should not be taken. So a new project manager will not necessarily
rectify the problem.
The Role of the Project Manager
Obviously, one of the project manager’s key responsibilities is the status of the
project. While there are many reasons that a project may drift out of plan, it is the
responsibility of the project manager to institute corrective measures to restore
the project to an On Plan status. The extent to which the project manager meets
that responsibility will be obvious from the future status of an Off Plan project.
The project manager can also be a cause of an Off Plan status. That can happen
in a number of ways. In our experience, one of the major contributing factors is
the failure of the project manager to have a good system of cross-checking and
validating the integrity of the task status being reported by the team. If the proj-
ect manager does not have a visible process for validating task status, that is a
good indication that scheduling problems are sure to occur. The second behav-
ioral problem that we see is the failure of the project manager to establish a
repeatable and effective communications process. The first place to look for that
is in constant questioning from the team members about some aspect of the
project that impacts their work for which they have little or no knowledge.
There should be full disclosure by the project manager to the team. That process
begins at planning time and extends through to the closure of the project.
Reporting Portfolio Performance
Two well-known reporting tools can be used to compare the projects across a
portfolio and likewise the general performance of the portfolio as a whole:
cost/schedule control (C/SC) and milestone trend charts. Both of these were
discussed in detail in Chapter 10, and that discussion is not repeated here.
What we will do is take those two reporting tools and show how they can be
applied to measuring the performance of the portfolio.
Schedule Performance Index and Cost Performance Index
From C/SC we take the schedule performance index (SPI) and cost perfor-
mance index (CPI).
Schedule performance index. The schedule performance index (SPI) is a mea-
sure of how close the project is to performing work as it was actually sched-
uled. If the project is ahead of schedule, its SPI will be greater than 1, and if
it is behind schedule its SPI will be less than 1, which would indicate that
the work performed was less than the work scheduled.
Chapter 20
384
24 432210 Ch20.qxd 7/2/03 9:34 AM Page 384
Cost performance index. The cost performance index (CPI) is a measure of how
close the project is to spending on the work performed to what was planned
to have been spent. If you are spending less on the work performed than
was budgeted, the CPI will be greater than 1. If not, and you are spending
more than was budgeted for the work performed, then the CPI will be less
than 1.
These two indices are intuitive and are good yardsticks to compare the projects
in a portfolio. Any value less than 1 is undesirable; any value over 1 is good.
These indices are displayed graphically as trends compared against the base-
line value of 1.
SPI and CPI Trend Charts
The milestone trend charts that we introduced in Chapter 10 are adapted here
to fit the SPI and CPI trends. We will track the SPI and CPI over time using the
criteria established in Chapter 10.
Some examples will help. Take a look at a milestone trend chart for a hypo-
thetical project (see Figure 20.16). The trend chart plots the SPI and CPI for a
single project at weekly reporting intervals. The heavy horizontal line has the
value 1. That is the boundary value for each index. Values above 1 indicate an
ahead-of-schedule or under-budget situation for that reporting period. Values
below 1 indicate a behind-schedule or over-budget situation for that reporting
period. Over time these indices tell us an interesting story of how the project is
progressing or not progressing.
For example, Figure 20.16 shows that beginning with Week 5 the schedule for
Project ALPHA began to slip. The slight improvement in the budget may be
explained by work not being done, and hence the cost of that work that was
scheduled but not done was not logged to the project. This type of relationship
between schedule and cost is not unusual.
Spotting Out-of-Control Situations
Certain patterns signal an out-of-control situation. Some examples of these
sorts of situations are shown in Figures 20.17 through 20.20 and are described
in this section.
Figure 20.17 depicts a project schedule is slowly slipping out of control. Each
report period shows additional slippage since the last report period. Four such
successive occurrences, however minor they may seem, require special correc-
tive action on the part of the project manager.
Project Portfolio Management
385
24 432210 Ch20.qxd 7/2/03 9:34 AM Page 385