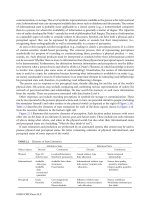
handbook of multisensor data fusion phần 2 pptx
Bạn đang xem bản rút gọn của tài liệu. Xem và tải ngay bản đầy đủ của tài liệu tại đây (108.72 KB, 4 trang )
©2001 CRC Press LLC
same procedure recursively to the sublist greater than the median; otherwise apply it to the sublist less
than the median (Figure 3.5). Eventually either
q
will be found — it will be equal to the median of some
sublist — or a sublist will turn out to be empty, at which point the procedure terminates and reports
that
q
is
not present in the list.
The efficiency of this process can be analyzed as follows. At every step, half of the remaining elements
in the list are eliminated from consideration. Thus, the total number of comparisons is equal to the
number of halvings, which in turn is
O
(log
n
). For example, if
n
is 1,000,000, then only 20 comparisons
are needed to determine if a given number is in the list.
Binary search can also be used to find all elements of the list that are within a specified range of values
(
min
,
max
). Specifically, it can be applied to find the position in the list of the largest element less than
min
and the position of the smallest element greater than
max
. The elements between these two positions
then represent the desired set. Finding the positions associated with
min
and
max
requires
O
(log
n
)
comparisons. Assuming that some operation will be carried out on each of the
m
elements of the solution
set, the overall computation time for satisfying a range query scales as
O
(log
n
+
m
).
Extending binary search to multiple dimensions yields a
kd
-tree.
7
This data structure permits the fast
retrieval of all 3-D points; for example, in a data set whose
x
coordinate is in the range (
x
min
,
x
max
), whose
y
coordinate is in the range (
y
min
,
y
max
)
and whose
z
coordinate is in the range (
z
min
,
z
max
). The
kd
-tree
for
k
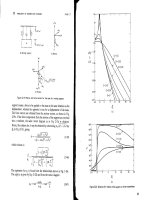
= 3 is constructed as follows: The first step is to list the
x
coordinates of the points and choose the
median value, then partition the volume by drawing a plane perpendicular to the
x
-axis through this
point. The result is to create two subvolumes, one containing all the points whose
x
coordinates are less
than the median and the other containing the points whose
x
coordinates are greater than the median.
The same procedure is then applied recursively to the two subvolumes, except that now the partitioning
planes are drawn perpendicular to the
y
-axis and they pass through points that have median values of
the
y
coordinate. The next round uses the
z
coordinate, and then the procedure returns cyclically to the
x
coordinate. The recursion continues until the subvolumes are empty.*
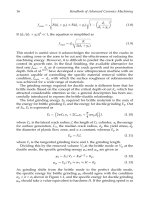
FIGURE 3.5
Each node in a binary search tree stores the median value of the elements in its subtree. Searching
the tree requires a comparison at each node to determine whether the left or right subtree should be searched.
* An alternative generalization of binary search to multiple dimensions is to partition the dataset at each stage
according to its distance from a selected set of points;
8-14
those that are less than the median distance comprise one
branch of the tree, and those that are greater comprise the other. These data structures are very flexible because they
offer the freedom to use an appropriate application-specific metric to partition the dataset; however, they are also
much more computationally intensive because of the number of distance calculations that must be performed.
q < Median Median < q
_
©2001 CRC Press LLC
4
The Principles and
Practice of Image and
Spatial Data Fusion*
4.1 Introduction
4.2 Motivations for Combining Image and Spatial Data
4.3 Defining Image and Spatial Data Fusion
4.4 Three Classic Levels of Combination for Multisensor
Automatic Target Recognition Data Fusion
Pixel-Level Fusion • Feature-Level Fusion • Decision-Level
Fusion • Multiple-Level Fusion
4.5 Image Data Fusion for Enhancement of Imagery
Data
Multiresolution Imagery • Dynamic Imagery • Three-
Dimensional Imagery
4.6 Spatial Data Fusion Applications
Spatial Data Fusion: Combining Image and Non-Image Data
to Create Spatial Information Systems • Mapping, Charting
and Geodesy (MC&G) Applications
4.7 Summary
References
4.1 Introduction
The joint use of imagery and spatial data from different imaging, mapping, or other spatial sensors has the
potential to provide significant performance improvements over single sensor detection, classification, and
situation assessment functions. The terms
imagery fusion
and
spatial data fusion
have been applied to
describe a variety of combining operations for a wide range of image enhancement and understanding
applications. Surveillance, robotic machine vision, and automatic target cueing are among the application
areas that have explored the potential benefits of multiple sensor imagery. This chapter provides a framework
for defining and describing the functions of image data fusion in the context of the Joint Directors of
Laboratories (JDL) data fusion model. The chapter also describes representative methods and applications.
Sensor fusion
and
data fusion
have become the de facto terms to describe the general abductive or
deductive combination processes by which diverse sets of related data are joined or merged to produce
*Adapted from the principles and practice of image and spatial data fusion, in
Proceedings of the 8th National
Data Fusion Conference,
Dallas, Texas, March 15–17, 1995, pp. 257–278.
Ed Waltz
Veridian Systems
©2001 CRC Press LLC
5
Data Registration
5.1 Introduction
5.2 Registration Problem
5.3 Review of Existing Research
5.4 Registration Using Meta-Heuristics
5.5 Wavelet-Based Registration of Range Images
5.6 Registration Assistance/Preprocessing
5.7 Conclusion
Acknowledgments
References
5.1 Introduction
Sensor fusion refers to the use of multiple sensor readings to infer a single piece of information. Inputs
may be received from a single sensor over a period of time. They may be received from multiple sensors
of the same or different types. Inputs may be raw data, extracted features, or higher-level decisions. This
process provides increased robustness and accuracy in machine perception. This is conceptually similar
to the use of repeated experiments to establish parameter values using statistics.
1
Several reference books
have been published on sensor fusion.
2-4
One decomposition of the sensor fusion process is shown in Figure 5.1.
Sensor readings are gathered,
preprocessed, compared, and combined, and a final result is derived. An essential preprocessing step for
comparing readings from independent physical sensors is transforming all input data into a common
coordinate system. This is referred to as
data registration.
In this chapter, we describe data registration,
provide a review of existing methods, and discuss some recent results.
Data registration transformation is often assumed to be known
a priori
, partially because the problem
is not trivial. Traditional methods are based on methods developed by cartographers. These methods
have a number of drawbacks and often make invalid assumptions concerning the input data.
Although data input includes raw sensor readings, features extracted from sensor data, and higher-
level information, registration is a preprocessing stage and, therefore, is usually applied only to either
raw data or extracted features. Sensor readings can have one to
n
dimensions. The number of dimensions
will not necessarily be an integer. Most techniques deal with data of two or three dimensions; however,
same approaches can be trivially applied to one-dimensional readings. Depending on the sensing modal-
ities used, occlusion may be a problem with data in more than two dimensions, causing data in the
environment to be obscured by the relative position of objects in the environment. The specific case
studies presented in this chapter use image data in two dimensions and range data in 2
1
/
2
dimensions.
This chapter is organized as follows. Section 5.2 gives a formal definition of image registration. Section
5.3 provides a brief survey of existing methods. Section 5.4 discusses meta-heuristic techniques that have
been used for image registration. This includes objective functions for sensor readings with various types
Richard R. Brooks
The Pennsylvania State University
Lynne Grewe
California State University
©2001 CRC Press LLC
6
Data Fusion
Automation: A
Top-Down Perspective
6.1 Introduction
Biological Fusion Metaphor • Command and Control
Metaphor • Puzzle-Solving Metaphor • Evidence
Combination • Information Requirements • Problem
Dimensionality • Commensurate and Noncommensurate Data
6.2 Biologically Motivated Fusion Process Model
6.3 Fusion Process Model Extensions
Short-, Medium-, and Long-Term Knowledge • Fusion
Classes • Fusion Classes and Canonical Problem-Solving
Forms
6.4 Observations
Observation 1 • Observation 2 • Observation 3 •
Observation 4 • Observation 5
Acknowledgment
References
6.1 Introduction
This chapter offers a conceptual-level view of the data fusion process and discusses key principles
associated with both data analysis and information combination. The discussion begins with a high-level
view of data fusion requirements and analysis options. Although the discussion focuses on tactical
situation awareness development, a much wider range of applications exists for this technology.
After motivating the concepts behind effective information combination and decision making through
a series of easily understood metaphors, the chapter
•Presents a top-down view of the data fusion process,
•Discusses the inherent complexities of combining uncertain, erroneous, and fragmentary information,
• Offers a taxonomic approach for distinguishing classes of fusion algorithms, and
•Identifies key algorithm requirements for practical and effective machine-based reasoning.
6.1.1 Biological Fusion Metaphor
Multiple sensory fusion in biological systems provides a natural metaphor for studying artificial data
fusion systems. As with any good metaphor, consideration of a simpler or more familiar phenomenon
can provide valuable insight into the study of a more complex or less familiar process.
Richard Antony
VGS Inc.