Short Selling Strategies, Risks, and Rewards phần 2 pdf
Bạn đang xem bản rút gọn của tài liệu. Xem và tải ngay bản đầy đủ của tài liệu tại đây (545.68 KB, 43 trang )
26 THE MECHANICS OF SHORT SELLING
EXHIBIT 3.3 (Continued)
Last Trading Day The third Friday of the delivery month.
Settlement Day
and Time
10:00
A.M. EST on the next business day following the
last trading day.
Settlement Price
Calculation
The Settlement System will calculate the Daily Settle-
ment Price based on reported prices in the two
minute period prior to the time specified for contract
settlement. The first ninety seconds of the settlement
period will be used to monitor spread levels. The Set-
tlement Price will be determined during the final 30
seconds of the settlement period, according to the
following criteria: a. A single traded price during the
last thirty seconds will be the Settlement Price. b. If
more than one trade occurs during the last thirty sec-
onds of the Settlement Range, the trade weighted
average of the prices, rounded to the nearest tick,
will be the Settlement Price. c. If no trade occurs dur-
ing the last 30 seconds of the Settlement Range, the
price midway between the active bids and offers at
the time the settlement price is calculated, rounded to
the nearest tick, will be the Settlement Price. d. In the
circumstances where there is no traded price nor
updated bid/ask spread during the last 30 seconds of
trading, the settlement price of that contract month
shall be the settlement price of the 1st quarterly
delivery month plus or minus the latest observed cal-
endar spread differential between the first quarterly
delivery month and the contract month in question.
In the event that the relevant spread price differential
is not readily observable, in order to identify appro-
priate settlement prices, Exchange Market Services
may take into account the following criteria as appli-
cable 1) spread price differentials between other con-
tract months of the same contract; and 2) price levels
and/or spread price differentials in a related market.
EDSP Calculation
(Exchange Delivery
Settlement Price)
The official closing price of the underlying stock on the
NASDAQ or NYSE, as of the latest possible period
before NQLX system closing time (5:00
P.M. EST).
Delivery Size Physical delivery of 100 shares (plus or minus the
impact of corporate events per standard Options
Clearing Corporation (OCC) rules and practices)
made through National Securities Clearing Corpora-
tion (NSCC)/Depository Trust Corporation (DTC).
3-Fabozzi-Using deriv Page 26 Thursday, August 5, 2004 11:08 AM
Shorting Using Futures and Options 27
EXHIBIT 3.3 (Continued)
Note: These contract specifications may be modified before formal filing with the
regulatory authority
Reproduced from />Single-stock futures of only actively traded New York Stock Exchange
and NASDAQ stocks are traded. Consequently, an investor interested in
short selling using single-stock futures is limited to those traded on both
the exchanges. There are three advantages of using single-stock futures
rather than borrowing stock in the cash market (via a stock lending trans-
action) if an investor seeking to short a stock has the choice.
The first advantage is the transactional efficiency that it permits. In a
stock-lending program, the short seller may find it difficult or impossible
to borrow the stock. Moreover, an opportunity can be missed as the
stock loan department seeks to locate the stock to borrow. After a short
position is established, single-stock futures offer a second advantage by
eliminating recall risk, the risk of the stock lender recalling the stock
prior to the investor wanting to close out the short position.
Delivery Process
and Date
Delivery will be carried out via the NSCC 3-day deliv-
ery process. Three business days following the last
trading day for the futures (T + 3), holders of net
short positions deliver the underlying securities to
holders of net long positions and payments of the set-
tlement amounts are made. Generally, the underlying
stock certificates are stored with the DTC where
book entries are used to move securities between
accounts. The net financial obligations for settlement
are made, via wire transfers with designated banks,
in single payments from the NSCC to firms with net
credit positions and to the NSCC from firms with net
debit positions. These transactions are cleared
through the NSCC before 1:00
P.M. EST on the set-
tlement date.
Price Limits There are no daily price limits on Single Stock Futures.
When the underlying shares cease to trade in the cash
market, the Single Stock Futures based on the under-
lying will also cease trading in a manner coordinated
with the applicable securities exchange.
Reportable Position
Limits
200 contracts, equivalent to 20,000 shares of the
underlying common stock/ADR. NQLX may intro-
duce different reportable position limits for futures
positions held within one month of the last trading
date.
3-Fabozzi-Using deriv Page 27 Thursday, August 5, 2004 11:08 AM
28 THE MECHANICS OF SHORT SELLING
A third potential advantage is the cost savings by implementing a
short sale via single-stock futures rather than a stock-lending transac-
tion. The financing of the short-sale position in a stock-lending transac-
tion is arranged by the broker through a bank. The interest rate that the
bank will charge the broker is called the broker loan rate or the call
money rate. That rate with a markup is charged to the investor. How-
ever, if the short seller receives the proceeds to invest, this will reduce
the cost of borrowing the stock.
There are factors that determine whether or not there is a cost sav-
ings by shorting single-stock futures. To understand these factors, we
begin with the relationship between the price of the single-stock futures
and the price of the underlying stock. The following relationship must
exist for there to be no arbitrage opportunity:
4
Futures price = Stock price[1 + r(d
1
/360)] + Expected dividend[1 + r(d
2
/360)]
where
The short-term rate in the pricing relationship above typically
reflects the London Interbank Offered Rate (LIBOR). This is the interest
rate that major international banks offer each other on a Eurodollar
certificates of deposit (CD) with given maturities. The maturities range
from overnight to five years. So, references to “3-month LIBOR” indi-
cate the interest rate that major international banks are offering to pay
to other such banks on a CD that matures in three months.
The difference between the futures price and the stock price is called
the basis. The basis is effectively the repo rate (for the period until settle-
ment date) adjusted by the expected dividend. The basis is also referred to
as the net interest cost or carry. The buyer of the futures contract pays the
net interest cost to maintain the long position; the seller of the futures con-
tract earns the net interest cost for financing the buyer’s long position.
Thus, a comparison of the cost advantage to shorting single stock
futures rather than using a stock lending transaction comes down to
empirically determining which has the lower net interest cost. NASDAQ
Liffe examined this issue for the period May 1991 to November 2001.
5
The only time there was not an advantage to the using single stock
4
The derivation is found in most books that cover futures contract.
r = short-term interest rate
d
1
= number of days until the settlement of the future contract
d
2
= number of days between receipt of the expected dividend
payment and the settlement date
5
“Single Stock Futures for the Professional Trader,” NASDAQ Liffe, undated.
3-Fabozzi-Using deriv Page 28 Thursday, August 5, 2004 11:08 AM
Shorting Using Futures and Options 29
future was around August 2001 when the Fed aggressively cut interest
rates. In general, the study found that the advantage of using single-
stock futures is adversely affected by low interest rates and steep yield
curve environments.
Stock Index Futures
An investor may want to sell short the market or a sector of the market.
Stock index futures can be used for this purpose. A stock index futures
contract is a futures contract in which the underlying is a specific stock
index. An investor who buys a stock index futures contract agrees to
buy the stock index, and the seller of a stock index futures contract
agrees to sell the stock index. The only difference between a single stock
futures contract and a stock index futures contract is in the features of
the contract that must be established so that it is clear how much of the
particular stock index is being bought or sold.
The underlying for a stock index futures contract can be a broad-
based stock market index or a narrow-based index. Examples of broad-
based stock market indexes that are the underlying for a futures con-
tracts are the S&P 500, S&P Midcap 400, Dow Jones Industrial Aver-
age, NASDAQ 100 Index, NYSE Composite Index, Value Line Index,
and the Russell 2000 Index.
A narrow-based stock index futures contract is one based on a sub-
sector or components of a broad-based stock index containing groups of
stocks or a specialized sector developed by a bank. For example, Dow
Jones MicroSector Indexes
SM
are traded on ChicagoOne. There are 15
sectors in the index.
The dollar value of a stock index futures contract is the product of
the futures price and a “multiple” that is specified for the futures con-
tract. That is,
Dollar value of a stock index futures contract = Futures price
× Multiple
For example, suppose that the futures price for the S&P 500 is
1,100.00. The multiple for this contract is $250. (The multiple for the
mini-S&P 500 futures contract is $50.) Therefore, the dollar value of
the S&P 500 futures contract would be $275,000 (= 1,100.00
× $250).
If an investor buys an S&P 500 futures contract at 1,100.00 and
sells it at 1,120.00, the investor realizes a profit of 20 times $250, or
$5,000. If the futures contract is sold instead for 1,050.00, the investor
will realize a loss of 50 times $250, or $12,500.
Stock index futures contracts are cash settlement contracts. This
means that at the settlement date, cash will be exchanged to settle the con-
tract. For example, if an investor buys an S&P 500 futures contract at
3-Fabozzi-Using deriv Page 29 Thursday, August 5, 2004 11:08 AM
30 THE MECHANICS OF SHORT SELLING
1,100.00 and the futures settlement price is 1,120.00, settlement would be
as follows. The investor has agreed to buy the S&P 500 for 1,100.00
times $250, or $275,000. The S&P 500 value at the settlement date is
1,120.00 times $250, or $280,000. The seller of this futures contract must
pay the investor $5,000 ($280,000 – $275,000). Had the futures price at
the settlement date been 1,050.00 instead of 1,120, the dollar value of the
S&P 500 futures contract would be $262,500. In this case, the investor
must pay the seller of the contract $12,500 ($275,000 – $262,500). (Of
course, in practice, the parties would be realizing any gains or losses at the
end of each trading day as their positions are marked to market.)
Clearly, an investor who wants to short the entire market or a sector
will use stock index futures contracts. The costs of a transaction are
small relative to shorting the individuals stocks comprising the stock
index or attempting to construct a portfolio that replicates the stock
index with minimal tracking error.
EQUITY OPTIONS
An option is a contract in which the option seller grants the option buyer
the right to enter into a transaction with the seller to either buy or sell an
underlying at a specified price on or before a specified date. If the right is
to purchase the underlying, the option is a call option. If the right is to
sell the underlying, the option is a put option. The specified price is
called the strike price or exercise price and the specified date is called the
expiration date. The option seller grants this right in exchange for a cer-
tain amount of money called the option premium or option price. The
underlying for an equity option can be an individual stock or a stock
index. The option seller is also known as the option writer, while the
option buyer is the option holder.
An option can also be categorized according to when it may be exer-
cised by the option holder. This is referred to as the exercise style. A
European option can only be exercised at the expiration date of the con-
tract. An American option, in contrast, can be exercised any time on or
before the expiration date.
The terms of exchange are represented by the contract unit, which is
typically 100 shares for an individual stock and a multiple times an index
value for a stock index. The terms of exchange are standard for most con-
tracts. Exhibit 3.4 summarizes the obligations and rights of the parties to
American calls and puts.
The most actively traded equity options are listed option (i.e., options
listed on an exchange). Organized exchanges reduce counterparty risk by
3-Fabozzi-Using deriv Page 30 Thursday, August 5, 2004 11:08 AM
Shorting Using Futures and Options 31
requiring margin, marking to the market daily, imposing size and price
limits, and providing an intermediary that takes both sides of a trade.
For listed options, there are no margin requirements for the buyer of an
option, once the option price has been paid in full. Because the option price
is the maximum amount that the option buyer can lose, no matter how
adverse the price movement of the underlying, margin is not necessary. The
option writer has agreed to transfer the risk inherent in a position in the
underlying from the option buyer to itself. The writer, on the other, has
certain margin requirements, including the option premium and a per-
centage of the value of the underlying less the out-of-the-money
amount.
Stock Options and Index Options
Stock options refer to listed options on individual stocks or American
Depository Receipts (ADRs). The underlying is 100 shares of the desig-
nated stock. All listed stock options in the United States may be exer-
cised any time before the expiration date; that is, they are American
style options.
Index options are options where the underlying is a stock index
(broad based or narrow based) rather than an individual stock. An
index call option gives the option buyer the right to buy the underlying
stock index, while a put option gives the option buyer the right to sell
the underlying stock index. Unlike stock options where a stock can be
delivered if the option is exercised by the option holder, it would be
extremely complicated to settle an index option by delivering all the
EXHIBIT 3.4
Obligations and Rights of the Parties to American Options Contracts
Type of
Option
Writer/Seller Buyer
Obligation Right Obligation Right
Call
Option
To sell the underlying
to the buyer (at the
buyer’s option) at the
strike price at or
before the expiration
date.
Receive
the
option
price.
Pay the
option
price.
To buy the underly-
ing from the writer
at the strike price
any time before the
expiration date.
Put
Option
To purchase the under-
lying from the buyer
(at the buyer’s
option) at the strike
price at or before the
expiration date.
Receive
the
option
price.
Pay the
option
price.
To sell the underlying
to the writer at the
strike price any time
before the expira-
tion date.
3-Fabozzi-Using deriv Page 31 Thursday, August 5, 2004 11:08 AM
32 THE MECHANICS OF SHORT SELLING
stocks that comprise the index. Instead, index options are cash settle-
ment contracts. This means that if the option is exercised by the option
holder, the option writer pays cash to the option buyer. There is no
delivery of any stocks.
Index options include industry options, sector options, and style
options. The most liquid index options are those on the S&P 100 index
(OEX) and the S&P 500 index (SPX). Both trade on the Chicago Board
Options Exchange. Index options can be American or European style.
The S&P 500 index option contract is European, while the OEX is
American. Both index option contracts have specific standardized fea-
tures and contract terms. Moreover, both have short expiration cycles
The dollar value of the stock index underlying an index option is
equal to the current cash index value multiplied by the contract’s multi-
ple. That is,
Dollar value of the underlying index = Cash index value × Multiple
For example, suppose the cash index value for the S&P 500 is 1,100.00.
Since the contract multiple is $100, the dollar value of the SPX is
$110,000 (= 1,100.00 × $100).
For a stock option, the price at which the buyer of the option can
buy or sell the stock is the strike price. For an index option, the strike
index is the index value at which the buyer of the option can buy or sell
the underlying stock index. The strike index is converted into a dollar
value by multiplying the strike index by the multiple for the contract.
For example, if the strike index is 1,000.00, the dollar value is
$100,000 (= 1,000.00 × $100). If an investor purchases a call option on
the SPX with a strike index of 1,000.00, and exercises the option when
the index value is 1,100, then the investor has the right to purchase the
index for $100,000 when the market value of the index is $110,000.
The buyer of the call option would then receive $10,000 from the
option writer.
LEAPS and FLEX options essentially modify an existing feature of
either a stock option, an index option, or both. For example, stock
option and index option contracts have short expiration cycles. Long-
Term Equity Anticipation Securities (LEAPS) are designed to offer
options with longer maturities. These contracts are available on individ-
ual stocks and some indexes. Stock option LEAPS are comparable to
standard stock options except the maturities can range up to 39 months
from the origination date. Index options LEAPS differ in size compared
with standard index options having a multiplier of 10 rather than 100.
FLEX options allow users to specify the terms of the option contract
for either a stock option or an index option. The value of FLEX options
3-Fabozzi-Using deriv Page 32 Thursday, August 5, 2004 11:08 AM
Shorting Using Futures and Options 33
is the ability to customize the terms of the contract along four dimen-
sions: underlying, strike price, expiration date, and settlement style.
Moreover, the exchange provides a secondary market to offset or alter
positions and an independent daily marking of prices.
Risk and Return Characteristics of Options
Now let’s look at the risk and return characteristics of the four basic
option positions: buying a call option (long a call option), selling a call
option (short a call option), buying a put option (long a put option),
and selling a put option (short a put option). We will use stock options
in our example. The illustrations assume that each option position is
held to the expiration date and not exercised early. Also, to simplify the
illustrations, we assume that the underlying for each option is for 1
share of stock rather than 100 shares and we ignore transaction costs.
Buying Call Options
Assume that there is a call option on stock XYZ that expires in one
month and has a strike price of $100. The option price is $3. The profit
or loss will depend on the price of stock XYZ at the expiration date.
The buyer of a call option benefits if the price rises above the strike
price. If the price of stock XYZ is equal to $103, the buyer of this call
option breaks even. The maximum loss is the option price; there is a
profit if the stock price exceeds $103 at the expiration date.
It is worthwhile to compare the profit and loss profile of the call
option buyer with that of an investor taking a long position in one share
of stock XYZ. The payoff from the position depends on stock XYZ’s
price at the expiration date. An investor who takes a long position in
stock XYZ realizes a profit of $1 for every $1 increase in stock XYZ’s
price. As stock XYZ’s price falls, however, the investor loses, dollar for
dollar. If the price drops by more than $3, the long position in stock
XYZ results in a loss of more than $3. The long call position, in con-
trast, limits the loss to only the option price of $3 but retains the upside
potential, which will be $3 less than for the long position in stock XYZ.
Writing Call Options
To illustrate the option seller’s, or writer’s, position, we use the same
call option we used to illustrate buying a call option. The profit/loss
profile at expiration of the short call position (that is, the position of the
call option writer) is the mirror image of the profit and loss profile of
the long call position (the position of the call option buyer). The profit
of the short call position for any given price for stock XYZ at the expi-
ration date is the same as the loss of the long call position. Conse-
3-Fabozzi-Using deriv Page 33 Thursday, August 5, 2004 11:08 AM
34 THE MECHANICS OF SHORT SELLING
quently, the maximum profit the short call position can produce is the
option price. The maximum loss is not limited because it is the highest
price reached by stock XYZ on or before the expiration date, less the
option price; this price can be indefinitely high.
Buying Put Options
To illustrate a long put option position, we assume a hypothetical put
option on one share of stock XYZ with one month to maturity and a
strike price of $100. Assume that the put option is selling for $2. The
profit/loss for this position at the expiration date depends on the market
price of stock XYZ. The buyer of a put option benefits if the price falls.
As with all long option positions, the loss is limited to the option
price. The profit potential, however, is substantial: the theoretical maxi-
mum profit is generated if stock XYZ’s price falls to zero. Contrast this
profit potential with that of the buyer of a call option. The theoretical
maximum profit for a call buyer cannot be determined beforehand
because it depends on the highest price that can be reached by stock
XYZ before or at the option expiration date.
Writing Put Options
The profit/loss profile for a short put option is the mirror image of the
long put option. The maximum profit to be realized from this position is
the option price. The theoretical maximum loss can be substantial
should the price of the stock declines; if the price were to fall to zero,
the loss would be the strike price less the option price.
Short Selling and Basic Option Strategies
Buying puts or selling calls allows the investor to benefit if the price of a
stock or stock index declines.
Buying puts gives the investor upside potential if the price of the
underlying declines. The upside potential is reduced by the option price;
in exchange for the reduced upside potential due to the cost of purchas-
ing the put option, the loss is limited to the option price. Thus, in com-
parison to short selling in the cash market by borrowing the stock, an
investor who buys puts will realize a lower profit due to the option price
if the price of the underlying declines. Effectively, the difference in profit
when the price of the underlying declines is less than the option price
due to the cost of borrowing the stock. In contrast to short selling in the
cash market by borrowing the stock, the loss is limited to the option
price if the price of the underlying increases.
In addition, buying a put option offers an investor leverage. This is
because for a given amount that the investor is prepared to invest in a
3-Fabozzi-Using deriv Page 34 Thursday, August 5, 2004 11:08 AM
Shorting Using Futures and Options 35
short selling strategy, greater exposure can be obtained. Of course, the
greater profit potential by using the leverage provided by buying puts
means that there is greater potential loss.
Now let’s look at selling calls in comparison to selling short in the
cash market by borrowing the stock. The profit from selling calls if the
price of the underlying declines is limited to the option price received,
regardless of how much the price of the underlying declines. However,
there is no protection if the price of the underlying increases. In compar-
ison to short selling in the cash market by borrowing the stock, selling
calls has limited profit potential if the price of the underlying declines
The loss should the price of the underlying increase is less for the call
selling strategy because of the option price received. That is, selling calls
and short selling in the cash market have substantial downside risk but
the amount of the loss in the case of selling calls is reduced by the
option price received.
Differences Between Options and Futures
The fundamental difference between futures and options is that the
buyer of an option (the long position) has the right but not the obliga-
tion to enter into a transaction. The option writer is obligated to trans-
act if the buyer so desires (i.e., exercises the option). In contrast, both
parties are obligated to perform in the case of a futures contract. In
addition, to establish a position, the party who is long futures does not
pay the party who is short futures. In contrast, the party long an option
must make a payment (the option price) to the party who is short the
option in order to establish the position.
The payout structure also differs between a futures contract and an
option contract. The option price represents the cost of eliminating or
modifying the risk/reward relationship of the underlying. In contrast,
the payout for a futures contract is a dollar-for-dollar gain or loss for
the buyer and seller. When the futures price rises, the buyer gains at the
expense of the seller, while the buyer suffers a dollar-for-dollar loss
when the futures price drops.
Thus, futures payouts are symmetrical, while options are skewed.
The maximum loss for the option buyer is the option price. The loss to
the futures buyer is the full value of the contract. The option buyer has
limited downside losses but retains the benefits of an increase in the
value of the underlying. The maximum profit that can be realized by the
option writer is the option price, but there is significant downside expo-
sure. The losses or gains to the buyer and seller of a futures contract are
completely symmetrical.
3-Fabozzi-Using deriv Page 35 Thursday, August 5, 2004 11:08 AM
36 THE MECHANICS OF SHORT SELLING
SUMMARY
There are alternatives to selling short in the cash market. An investor
seeking to benefit from an anticipated decline in the price of a stock or
stock index may be able to do so in the futures or options markets.
Shorting individual stocks in the futures market requires the existence of
a single-stock futures contract. Where one exists, a study suggests that it
is less costly to implement a short selling strategy in the futures market.
In the case of stock index futures, it is less costly to execute a short sale
in the futures market. Buying puts and selling calls are two ways to
implement short selling in the options market. There are trade-offs
between buying puts, selling calls, and borrowing the stock in the cash
market in order to sell short.
3-Fabozzi-Using deriv Page 36 Thursday, August 5, 2004 11:08 AM
CHAPTER
4
37
Is Selling ETFs Short a Financial
“Extreme Sport”?
Gary L. Gastineau
Managing Director
ETF Consultants LLC
nyone who has wandered by video monitors in the windows of a ski
or surf shop has seen dramatic pictures of skiers or surfers in obvious
peril. A skier jumps from the edge of a cliff above the camera and disap-
pears from view into the couleur below with no apparent chance of sur-
vival—until the scene cuts to another camera showing a “safe” landing
on a 75-degree slope. At the surf shop, a surfer dude—or, with increas-
ing frequency, a surfer girl—is tucked in the curl of a six-story wave
headed for shore. Both skier and surfer lack obvious exit strategies.
At first glance, it might appear that an investor who ventures to sell
exchange-traded fund (ETF) shares short is taking risks similar in mag-
nitude to these extreme ski and surf enthusiasts. Whereas the short
interest in the average listed common stock is about 2% of the stock’s
capitalization, the short interest in large ETFs is often 20% to as much
as 55% of the ETF’s outstanding shares. When one understands that
short sales in ETFs can be executed without a price uptick—a trading
practice that has not yet received regulatory approval for most other
equity securities in the United States—the comparison of ETF short sell-
ers to extreme skiers and surfers seems apt. In fact, however, the risks
associated with ETF short selling are more in line with the risks
accepted by a competent skier cruising on an intermediate trail. The
ETF short seller, like the cruising skier, has to be alert and follow the
rules of the road, but the risks are clear and manageable.
A
4-Gastineau-SellingETFs Page 37 Thursday, August 5, 2004 11:09 AM
38 THE MECHANICS OF SHORT SELLING
WHAT ARE THE MOST IMPORTANT SAFETY FEATURES
PROTECTING ETF SHORT SELLERS?
Exchange-traded funds are a unique hybrid of closed-end and open-end
investment companies. ETF shares trade like common stocks or closed-
end funds during market hours and can be purchased or redeemed like
open-end funds with an in-kind deposit or withdrawal of portfolio securi-
ties at each day’s market close. In the United States, ETFs offer a unique
level of capital gains tax efficiency and in most markets they offer a high
level of intra-day liquidity and relatively low operating costs.
The trading flexibility and open-endedness of ETFs offer unusual
protection to short sellers.
1. It is essentially impossible to suffer a short squeeze in ETF shares. In
contrast to most corporate stocks where the shares outstanding are
fixed in number over long intervals,
1
shares in an ETF can be greatly
increased on any trading day by any Authorized Participant.
2
Creations
or redemptions in large ETFs like the S&P 500 SPDRs and the NAS-
DAQ 100 QQQ’s are occasionally worth several billion dollars on a
single day. The theoretical maximum size of the typical ETF, given this
in-kind creation process, can be measured in hundreds of billions or
even trillions of dollars of market value. The open-ended capitalization
and required diversification of ETFs takes them out of the extreme risk
category. As a practical matter, “cornering” an ETF market is unimag-
inable. The upside risk in a short sale is still theoretically greater than
the downside risk in a long purchase, but even that risk is modified by
the way ETF short selling is used to offset other risks.
2. Most ETF short sales are made to reduce, offset, or otherwise manage
the risk of a related financial position. The dominant risk management/
risk reduction ETF short sale transaction offsets long market risk with
a short or short equivalent position. Unlike the aggressive skier or
surfer, the risk manager who sells ETF shares short is nearly always
reducing the net risk of an investment position. In contrast to extreme
athletes, the risk managers selling ETFs short are more like the ski
patrol or lifeguards: They sell ETFs short to reduce total risk in a port-
folio.
1
Exercise of employee stock options or public sale of new stock by the corporation
can increase the number of shares outstanding
from time to time.
2
An Authorized Participant is a dealer that has signed an agreement with the fund’s
distributor to create additional fund shares by depositing baskets of securities with
the fund custodian and to redeem fund shares in exchange for similar baskets of the
fund’s portfolio securities.
4-Gastineau-SellingETFs Page 38 Thursday, August 5, 2004 11:09 AM
Is Selling ETFs Short a Financial “Extreme Sport”? 39
3. Most serious students of markets consider the uptick rule an anachro-
nism (at best). Requiring upticks for short sales is certainly unnecessary
and inappropriate for ETFs that compete in risk management applications
with sales of futures, swaps, and options—risk management instruments
that have never had uptick rules.
HOW DO ETFs WORK IN RISK MANAGEMENT APPLICATIONS?
Existing ETFs are all based on benchmark indices. While there are
important benchmarks and there are unimportant benchmarks, bench-
mark index derivatives are widely used in risk management applica-
tions. For example, an investor with an actively managed small-cap
portfolio might feel that superior stock selection reflected in the portfo-
lio will provide good, relative returns over the period ahead, but that
most small-cap stocks might still perform poorly. The investor can
hedge the portfolio’s exposure to small-caps while capturing its stock
selection advantage by hedging the small-cap risk with a short position
in a financial instrument linked to the Russell 2000 small-cap bench-
mark index. Available risk management tools for this application range
from futures contracts and equity swap agreements—to the shares of a
small-cap exchange-traded fund.
Derivative contracts have limited lives. Equity index futures contracts
will usually be rolled over about four times a year in longer-term risk man-
agement applications. While risk managers could take futures positions
with more distant settlements, liquidity is usually concentrated in the near-
est contracts. Consequently, risk managers typically use the near or next
contract and roll the position forward as it approaches expiration. Similar
expiration provisions apply to most swap agreements, leaving the typical
derivative transaction with considerable “roll” risk—risk of adverse mar-
ket impact from rolling the hedge forward to the next expiration.
If a hedger uses ETF shares instead of futures, a risk management posi-
tion can be held indefinitely without roll risk. Of course, the open-end
nature of an ETF risk management or hedging position has other differ-
ences from futures and swaps. There is an implied cost associated with the
expenses of the fund that may make the ETF a better short hedge, and there
may be tracking error between the ETF portfolio and the benchmark index,
but these are usually small considerations relative to fluctuating roll risk
and recurring transaction costs in a longer-term rolling derivatives hedge.
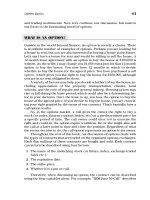
Exhibit 4.1 illustrates two snapshot cost analyses of long stock
index futures versus long ETF shares as one-year portfolio replication
positions. When these analyses were prepared (at different times), they
4-Gastineau-SellingETFs Page 39 Thursday, August 5, 2004 11:09 AM
40 THE MECHANICS OF SHORT SELLING
EXHIBIT 4.1 Comparisons of Long Position Costs in iShares S&P 500 Fund and
S&P 500 Futures for One-Year Portfolio Replication Applications
(All numbers in basis points (bps) unless otherwise indicated)
*Price per share. **Index value.
Source: Salomon Smith Barney, Stock Facts PRO
We assume the ETF shares are being created, given the large size of the trade. The com-
mission costs include $0.04 per share for the ETF plus the creation fee of $2,000
[$0.002 per share]. The market impact for the ETF was calculated using Stockfacts PRO
and assumes a round-trip trade. Since the impact cost includes the spread of the under-
lying stocks, we are not including an additional spread for the ETF. For the futures, we
used a commission of $5 per contract, a spread of 0.5, mispricing risk of 0.5, and 2
points in market impact for a trade of this size. As the size of this trade shrinks (e.g., to
$10 million) the market impact for the futures and the iShares will both likely approach
zero. From Kevin McNally and Dennis Emanuel, “ETF Insights—Institutional Uses of
Exchanges-Traded Funds,” Salomon Smith Barney Equity Report, December 4, 2002.
Comment: These analyses use iShares as an example, but, as the data in Exhibits 4.2
and 4.3 illustrate, most traders use S&P 500 SPDRs for S&P 500 futures substitute
applications. See the discussion in the text of the economics of a risk manager selling
ETFs short as a futures substitute.
iShares S&P 500 S&P 500 Futures
Value as of 12/02/02 $100,000,000 $100,000,000
Based on a price of $94.13* $934.53**
Multiplier 1 250
No. of Shares/Index Units 1,062,361 428
December 2002 Estimated Costs (bps) ETF Advantage
Commission (round trip) 8.70 1.70
Bid/Offer Spread (round trip) 0.00 5.35
Management Fee (annual) 9.50 0.00
Mispricing 0.00 10.70
Roll Risk 0.00 22.50
Impact 30.00 21.40
Total 48.20 61.66 13.46
May 2003
Commission (round trip) 6.45 2.16
Bid/Offer Spread (round trip) 0.00 5.40
Management Fee (annual) 9.45 0.00
Mispricing 0.00 21.59
Roll Risk 0.00 21.00
Impact (round trip) 28.90 21.59
Total 44.80 71.73 26.93
4-Gastineau-SellingETFs Page 40 Thursday, August 5, 2004 11:09 AM
Is Selling ETFs Short a Financial “Extreme Sport”? 41
indicated that the ETF was the low-cost replication instrument of choice
for an investor who expected the position to stay in place for a year. The
assumptions used in these analyses were appropriate at the times they
were prepared, but any investor or hedger should evaluate current mar-
ket conditions before choosing between futures or swaps and ETFs.
More importantly, the risk manager needs to convert the analyses of
Exhibit 4.1 from a long-side to a short-side cost comparison with spe-
cific data for the organization managing the risk. The reason the exam-
ples in Exhibit 4.1 show long positions in futures versus long positions
in ETFs is that the expected costs and trading frictions associated with a
long position are about the same for nearly everyone on the long side.
On the short side, the management fee works in favor of the ETF short
seller, but, more importantly, the net cost of borrowing ETF shares var-
ies over time and among risk managers. In fact, a number of the costs
change over time and among market participants.
In estimating the net share borrowing cost or loan premium for a
short ETF position, we will not spend much time discussing the fund
management fee. Lenders who buy ETF shares to lend them will some-
times be the marginal share lenders in the ETF market and when they are
the marginal lenders they should be able to recoup the management fee
as part of their securities lending revenue. When the marginal lender is
an ordinary investor, the ETF loan premium will be unaffected by the
management fee. The fact that the existence of the management fee
favors the short seller may stimulate ETF share lending efforts by third-
party securities lending agents working with brokerage firms and custo-
dians. “Recapturing” the management fee should effectively increase the
lending revenue on which agency lending fees are calculated. Generally,
the larger component of the securities loan premium is the net interest-
rate-linked spread which the share borrower pays. For ETF share loans,
the total loan premium can range from near 10 basis points in a very low
interest rate environment to a maximum of about 30 basis points if there
is management fee recapture built into the loan premium. If the loan pre-
mium rises above that level, ETF short sellers will begin to switch to
futures contracts and some investors will create ETF shares to lend.
The low end of this range is determined by the minimum administra-
tive costs of setting up a large securities lending program and implementing
only very large intermediate- and longer-term securities loans in this very
liquid and relatively transparent market. The high end of the range in this
particular market will probably be determined by the economics of per-
suading large pension funds with index portfolios to switch from direct
ownership of indexed portfolios—with few individual stock lending oppor-
tunities—to, say, SPDRs with substantial and relatively consistent lending
opportunities. In fact, an astute S&P 500 index manager will probably
4-Gastineau-SellingETFs Page 41 Thursday, August 5, 2004 11:09 AM
42 THE MECHANICS OF SHORT SELLING
handle this transaction for its pension plan clients at no extra charge. A
30-basis point lending fee might cover the expense ratio of the ETF, any
performance penalty associated with the way the ETF is managed,
3
an off-
set for any index outperformance the pension plan’s index manager was
obtaining and administrative costs.
4
The works of Gastineau,
5
Blume and
Edelen,
6
and Quinn and Wang
7
help us understand how these costs can
aggregate to as much as 30 basis points for an S&P 500 portfolio. The
maximum lending fee might be larger for smaller cap funds if fund shares
are created to lend, perhaps as much as 100–150 basis points for a Russell
2000 ETF because a good pension plan index manager should beat the
Russell 2000 by a substantial margin. At a loan premium in this range,
futures will be the short risk management tool of choice.
A more efficient
8
underlying large cap index than the S&P 500 could
theoretically lead to a lower maximum lending fee and a tighter spread if
the index were as widely accepted as the S&P 500. For now, a 20 basis
point spread between low- and high-borrowing costs is as tight as it is
likely to get, but smaller lenders and borrowers will often see significantly
wider spreads and higher loan premiums. To see the short-side perspective
on an ETF versus stock index futures comparison, the reader should mod-
ify the numbers in Exhibit 4.1 for a short ETF position by reversing the
effect of the management fee (the management fee is the same as the
fund’s expense ratio in most ETFs) and adding an annual loan premium
in the 10 to 30 basis point range to the cost of the ETF transaction.
3
The economics of short selling and ETF share lending is complicated by the fact that
managers of major benchmark ETFs seem to manage these funds with more empha-
sis on index tracking than on maximizing performance for fund investors. For a dis-
cussion of this issue, see Gary L. Gastineau, “The Benchmark Index Exchange-
Traded Fund Performance Problem,” Journal of Portfolio Management (Winter
2004), pp. 196–203.
4
If pension funds become important participants in ETF lending, we would expect
competition to make net ETF lending fees largely independent of interest rate levels
and dependent primarily on index popularity and fund management efficiency.
5
Gary L. Gastineau, “Equity Index Funds Have Lost Their Way,” The Journal of
Portfolio Management (Winter 2002), pp. 55–64 and Gary L. Gastineau, The Ex-
change-Traded Funds Manual (Hoboken, NJ: John Wiley & Sons, 2002).
6
Marshall Blume and Roger M. Edelen, “On Replicating the S&P 500 Index,”
working paper, Wharton School of Business, University of Pennsylvania, 2002; and
Marshall Blume and Roger M. Edelen, “S&P 500 Indexers, Delegation Costs and Li-
quidity Mechanisms,” working paper, Wharton School of Business, University of
Pennsylvania, 2003.
7
James Quinn and Frank Wang, “How Is Your Reconstitution,” Journal of Indexing
(Fourth Quarter 2003), pp. 34–38.
8
In terms of index change transaction costs.
4-Gastineau-SellingETFs Page 42 Thursday, August 5, 2004 11:09 AM
Is Selling ETFs Short a Financial “Extreme Sport”? 43
WHO OWNS ETF SHARES?
In contrast to the obvious relevance of this question when it is asked
about a common stock in the context of short selling, who owns the
ETF shares outstanding should not matter very much to the ETF inves-
tor or to the risk manager who would sell ETF shares short. The oppor-
tunity to increase ETF shares outstanding, literally at a moment’s notice,
makes current ETF shares outstanding largely irrelevant from a trading
or risk management perspective. Nonetheless, knowing something
about the composition of the shareholder population and the effect of
short sales on share ownership can help traders better understand the
ETF market and ETF share-borrowing and -trading costs.
A typical large-capitalization common stock without significant
insider holdings may show institutional investors accounting for 70% to
80% of its share capitalization. This institutional shareholder data can
be accumulated from 13-F reports and similar filings with the Securities
and Exchange Commission. The institutional share of ETF ownership
varies widely among the funds, but most ETF 13-F summaries show
institutional shareholdings in the 20–40% of ETF capitalization range,
far below the institutional holdings in most of the U.S. common stocks
held by the typical ETF.
9
When the ETF institutional shareholder numbers are viewed relative
to the typical large ETF’s short interest, the relatively low ETF institu-
tional ownership is almost surprising. With the short interest running
about 2% of shares outstanding in the average common stock, it is not
important that 2% of shares may be reported twice because one institu-
tion has lent its shares to a short seller and the shares have been pur-
chased by another reporting institution. With a two percent short
interest, double counting all or part of the short interest in the 13-F
reports does not affect the reported institutional ownership of most
common stocks very much because the short interest is such a negligible
part of the total stock capitalization. However, the large short interest
in many ETFs affects the reports considerably because all shares that
have been sold short appear as long positions in two investor portfolios.
Consequently, the ETF institutional ownership percentage reflected in
the 13-F reports is overstated as a percentage of total shares. For exam-
ple, if the short interest is reported at, say, 55% of capitalization, the
number of shares shown on the books of all holders of the ETF’s shares
will total 155% of the number of shares outstanding. If the 13-F reports
show that institutions hold 45% of the shares outstanding in the ETF,
9
Of course, the advisors of each ETF report the ETF’s stock positions as institutional
holdings on 13-F reports.
4-Gastineau-SellingETFs Page 43 Thursday, August 5, 2004 11:09 AM
44 THE MECHANICS OF SHORT SELLING
that is actually 45% out of 155% or only about 29% of the shares that
all investors combined show long in their accounts.
Huge ETF short interests also mean that short sellers play important
roles in the size of an ETF’s assets and in its trading activity. Specialists and
other market makers have frequently maintained significant inventories of
ETF shares to lend to short sellers. These market makers hedge their posi-
tions and obtain a fee from the securities lending operation, making cre-
ation of ETF shares for securities lending a modestly profitable business
activity at times. In the summer of 2003, many market makers substantially
reduced these ETF lending positions, apparently because interest rates were
so low that ETF share lending was no longer profitable for them.
10
The departure of some dealers from the business of buying and
hedging ETF shares for the securities lending market has not led to a
shortage of shares available to short sellers.
11
As the increase in many of
the short interest percentages (SIPs) in the largest ETFs listed in Exhibit
4.2 suggests, the ETF share borrowing needs of short sellers have been
readily accommodated by institutional ETF holders, by brokerage firms
carrying retail margin accounts and by other dealers. When market
makers reduced their participation in the ETF share-lending business,
they redeemed the shares they had been lending. This reduced the funds’
shares outstanding, but had no negative effect on the short interest that
actually grew in most large ETFs. In fact, the same lower interest rates
that reduced the attractiveness of ETF share lending to market makers
also reduced the effective cost of ETF borrowing and short selling by
risk managers. The reduction in the cost of borrowing ETF shares made
ETF short sales more attractive relative to short futures positions in
comparisons like those illustrated in Exhibit 4.1. Consequently, short
ETF positions gained risk management market share from short-stock
index futures positions.
With or without market makers’ ETF-lending portfolios, substantial
numbers of ETF shares have been made available to short sellers by
institutions and by brokerage firms from their retail investor accounts–
which typically exceed the size of institutional ETF holdings.
12
Broker-
10
The fees associated with net securities lending are partly a function of short-term in-
terest rates. When interest rates are low, net securities lending fees also tend to be low.
11
We call this lending activity by market makers, covered lending. The term should
carry no connotation that this process affects market risk exposure. It should suggest
only that the holding is linked to the securities loan.
12
Statements about the size of retail ETF holdings are hard to verify because there is
no formal reporting of retail positions comparable to the 13-F filings by institutional
investors. Note also that there are important restrictions on a brokerage firm’s right
to lend retail customer securities.
4-Gastineau-SellingETFs Page 44 Thursday, August 5, 2004 11:09 AM
45
EXHIBIT 4.2
Short Interest and Short-Interest Percentage (SIP) for Ten Largest U.S. Equity ETFs (all shares in thousands)*
*Largest Equity ETFs based on assets of August 15, 2003.
ETF
Symbol Jul-02 Oct-02 Jan-03 Apr-03
Jul-03 Oct-03 Jan-04
S&P 500 SPDR
SPY
Shares Outstanding
303,835 381,288 453,441 458,745 397,048 359,252
380,806
Short Interest
42,044 73,567 44,580 66,496 96,335 107,463
114,033
Short Interest Percentage
13.8% 19.3% 9.8% 14.5% 24.3%
29.9% 29.9%
NASDAQ 100 Index
QQQ
Shares Outstanding
763,400 740,250 674,250 738,850 630,400
608,200 607,250
Short Interest
164,008 178,098 167,090 151,786 260,147
333,759 320,456
Short Interest Percentage
21.5% 24.1% 24.8% 20.5% 41.3% 54.9%
52.8%
iShares S&P 500
IVV
Shares Outstanding
40,150 41,650 52,600 57,750 64,550
64,400 70,650
Short Interest
543 4,982 1,518 2,077 4,681 3,335
2,782
Short Interest Percentage
1.4% 12.0% 2.9% 3.6% 7.3%
5.2% 3.9%
DJIA DIAMONDS
DIA
Shares Outstanding
40,453 49,504 58,205 66,256 61,907
63,058 63,861
Short Interest
11,070 19,505 11,751 16,277 21,388
19,566 28,334
Short Interest Percentage
27.4% 39.4% 20.2% 24.6% 34.5% 31.0%
44.4%
S&P 400 MidCap SPDR
MDY
Shares Outstanding
75,205 63,258 63,258 56,334 55,836 56,762
60,913
Short Interest
6,102 5,148 4,502 4,385 5,636 7,768
8,768
Short Interest Percentage
8.1% 8.1% 7.1% 7.8% 10.1%
13.7% 14.4%
4-Gastineau-SellingETFs Page 45 Thursday, August 5, 2004 11:09 AM
46
EXHIBIT 4.2
(Continued)
Data source:
American Stock Exchange. Reflects revised data up to January 23, 2004.
ETF
Symbol Jul-02 Oct-02 Jan-03 Apr-03 Jul-03
Oct-03 Jan-04
iShares MSCI-EAFE
EFA
Shares Outstanding
35,800 20,600 20,600 20,200 24,800
28,400 42,800
Short Interest
270 328 576 836 970
1,265 1,446
Short Interest Percentage
0.8% 1.6% 2.8% 4.1% 3.9% 4.5%
3.4%
iShares Russell 2000
IWM
Shares Outstanding
34,750 27,700 26,850 26,100 33,350
38,350 39,000
Short Interest
6,658 7,329 5,794 8,304 7,175
13,811 18,673
Short Interest Percentage
19.2% 26.5% 21.6% 31.8% 21.5%
36.0% 47.9%
Vanguard Total Market VIPERS VTI
Shares Outstanding
12,636 16,441 16,441 17,506 20,179
21,444 24,173
Short Interest
35 86 451 1,380 91 432
394
Short Interest Percentage
0.3% 0.5% 2.7% 7.9% 0.4% 2.0%
1.6%
iShares Russell 1000
IWB
Shares Outstanding
8,850 16,350 16,350 19,850 32,400
31,100 32,350
Short Interest
377 585 1,597 886 1,048
650 1,323
Short Interest Percentage
4.3% 3.6% 9.8% 4.5% 3.2% 2.1%
4.1%
iShares S&P SmallCap 600 IJR
Shares Outstanding
11,200 11,250 13,600 11,550 13,850
13,900 15,350
Short Interest
309 988 1,146 864 1,644
1,353 1,726
Short Interest Percentage
2.8% 8.8% 8.4% 7.5% 11.9% 9.7%
11.2%
4-Gastineau-SellingETFs Page 46 Thursday, August 5, 2004 11:09 AM
Is Selling ETFs Short a Financial “Extreme Sport”? 47
dealers, both in their roles as market makers and for their own risk
management operations, are also substantial holders, lenders and short
sellers of ETF shares. There is little published data to help us quantify
all these participations.
WILL IT ALWAYS BE POSSIBLE TO BORROW ETF SHARES AT
LOW-COST FOR RISK MANAGEMENT APPLICATIONS?
Clearly, when short-term interest rates increase from 2003 levels, the
attractiveness of securities lending should increase for dealers who cre-
ate and hold hedged positions in ETFs while lending the ETF shares to
short sellers. Their activity should assure a supply for ETF share bor-
rowers. However, an interesting change in the U.S. Federal Tax Code
will certainly change the dynamics of ETF securities lending and short
selling even if it does not change the economics very much.
The 2003 Tax Act, formally the Jobs and Growth Tax Relief Recon-
ciliation Act of 2003, cut the tax rate for individual investors on quali-
fied dividends from certain equity securities (including most ETFs) to
15%. The Internal Revenue Code distinguishes between various kinds
of dividend and interest income, on the one hand, and payments in lieu
of such dividend and interest income, on the other hand. This distinc-
tion can be significant for municipal bonds, for example, where pay-
ments in lieu of municipal interest are not exempt from federal and
certain state income taxes, while the actual interest payment or an inter-
est passthrough from municipal bond funds will qualify fully for tax
exemption. Similar provisions apply to Treasury interest, which is gen-
erally exempt from state income taxes, but payments in lieu of Treasury
interest on securities lent out do not qualify for tax exemption.
Under the 2003 Tax Act, dividends can be affected by a similar dis-
tinction between actual or passed-through dividends and payments in lieu
of dividends. Corporations have had to exercise care that the “dividends”
they have received on common and preferred stocks have qualified for
the tax code’s corporate tax dividend-received deduction by being actual
dividend payments or pass-throughs rather than payments in lieu. Most
individual investors have not had to worry about the character of such
payments until now. For 2003, the new tax act provides that as long as
an individual investor has no reason to believe that what he or she is
receiving is a payment in lieu, the taxpayer can assume dividend pay-
ments from a brokerage firm or other custodian that holds the taxpayer’s
stocks, equity mutual funds or equity ETF shares are qualified dividends.
New Treasury rules dictate that financial intermediaries report dividend
4-Gastineau-SellingETFs Page 47 Thursday, August 5, 2004 11:09 AM
48 THE MECHANICS OF SHORT SELLING
qualification status for 2004 and subsequent years. Payments in lieu of
ETF dividends from securities lenders will not qualify for the special div-
idend tax rate in 2004 and later years. While some observers have sug-
gested that the lower dividend tax rate for individuals may increase the
cost of borrowing dividend-paying securities, it is more likely that there
will be a modest change in where the shares will be borrowed.
Some current ETF share lending may dry up. For example, brokers
carrying ETFs in individual investor’s accounts will not be able to certify
the ETF dividends as eligible for the 15% tax rate if they lend out the
shares. Institutional investors may have a more complex tax calculation to
make. Mutual funds, for example, often use ETFs to equitize small cash
balances. In fact, mutual funds probably account for a substantial fraction
of reported ETF institutional ownership.
13
Some mutual funds may not be
willing to loan their ETF shares as freely in 2004 and later years because
any payment in lieu of dividends that they receive from the borrower will
not be distributable as qualifying dividends to their taxpaying individual
shareholders. However, the provisions of Internal Revenue Code § 854
will govern the eligibility of fund dividend distributions for the 15% tax
rate. This section was written to cover eligibility of dividends for the divi-
dend-received deduction and it, in effect, applies nonqualifying income to
expenses first, leaving qualified dividends to be distributed. Assuming the
same treatment under the new law, only funds with very low expense
ratios or very large share lending programs, will risk distributing pay-
ments in lieu of dividends when they loan out ETF shares.
Any tax-exempt account will lend shares readily. Lending opportunities
might draw in the pension plans we described as potential ETF lenders in
the previous section. Long ETF positions held by a broker-dealer in its risk
management activities will be lendable because the broker-dealer cannot
take advantage of the special 15% dividend tax rate. Long positions held
by a dealer to hedge an equity swap transaction where the broker-dealer
pays the return on an ETF as a swap payment in return for receiving the
return on a stock position should also be lendable without incurring disad-
vantageous tax treatment. The swap payments are already payments in lieu
and, hence, the position held by the dealer would be lendable without dis-
turbing any individual investor’s receipt of a qualified dividend.
The net effect of this provision of the tax law on who lends ETF
shares and under what circumstances or with what promises as to the
13
Many ETFs trade until 4:15 P.M. Eastern Time, making them readily tradable by
a fund facing a last-minute cash purchase or sale of its shares. However, because re-
ports to the SEC usually show total holdings for the accounts of a reporting invest-
ment advisor, it may be difficult to distinguish mutual fund holdings from other
accounts managed by an advisor.
4-Gastineau-SellingETFs Page 48 Thursday, August 5, 2004 11:09 AM
Is Selling ETFs Short a Financial “Extreme Sport”? 49
nature of the cash flows involved, may not be as great as the economic
effect of interest rate changes on securities lending. In most recent inter-
est rate environments, lending ETF shares created specifically for the
purpose of lending has been a moderately attractive business opportu-
nity for specialists and other market makers. As short-term interest rates
move up from recent extremely low levels, ETF share lending could
become an attractive business activity for dealers once again. Of course,
the need for more extensive record keeping to meet requirements the
Treasury may impose could affect the economics of short selling and
securities lending in unpredictable ways. Pension plan ETF share lenders
should be able to avoid most such record-keeping costs.
As an aside, the QQQs—with their 55% of capitalization short
interest in December 2003—pay only a tiny dividend. Ironically, how-
ever, the new dividend tax treatment has encouraged many firms to
begin paying dividends or to increase their dividends, so the possibility
of a larger QQQ’s dividend cannot be ignored. Realistically, any QQQ’s
dividend is not likely to be large enough to affect the lending of QQQ
shares anytime soon.
WHAT IS THE EFFECT OF SHORT SELLING AND
RISK MANAGEMENT ACTIVITY ON ETF TRADING VOLUME AND
TRADING COSTS?
The facts that QQQs are the most actively traded equity security in the
world (in terms of number of shares) and that SPDRs are the most actively
traded securities (in terms of trading value) are not the result of frenetic
trading by the average investor in these fund shares. That the total num-
ber of SPDR and QQQ shares outstanding turns over every few weeks
simply reflects that these ETFs have become extremely popular risk man-
agement instruments, and have taken significant risk management market
share from futures contracts. The effect of these hedging applications on
trading spreads and share volume makes the nature of the markets in a
few actively traded ETFs with large short interests very different from the
markets in less active ETFs and more traditional securities.
At first thought, widespread use of ETFs in risk management appli-
cations should not have a material effect on the quality of the markets
in the ETF shares. Other things being equal, the bid/asked spread that
an investor or trader faces in an ETF should be largely a function of
spreads in the markets for the underlying basket of securities that make
up the ETF portfolio. However, if the ETF’s portfolio becomes a stan-
dard portfolio or basket trade and if ETF market makers experience a
4-Gastineau-SellingETFs Page 49 Thursday, August 5, 2004 11:09 AM
50 THE MECHANICS OF SHORT SELLING
high level of trading activity in the ETF shares, they may trade the ETF
at a tighter spread than an investor trading in a similar basket or less
active ETF would experience. A benchmark index portfolio basket,
whether for the S&P 500, the QQQs or the Russell 2000, is a standard
basket and will trade more cheaply as a basket than an investor or
trader can trade the individual securities separately. If an ETF is
extraordinarily active like the SPDRs and QQQs, a consistent high level
of trading activity in the ETF shares may further reduce trading costs.
Tight spreads on these baskets and on some of the related ETFs are
not just the result of a large number of orders interacting. In today’s mar-
kets, the presence of a number of market centers—on exchanges, on NAS-
DAQ, and on the trading books of a variety of electronic communication
networks (ECNs)—permits some market participants who can access mul-
tiple market centers to trade the most active ETF shares at very low cost.
The interaction of multiple ETF market places with futures contracts
on the ETFs themselves and, more importantly, with futures contracts on
the indices underlying the ETFs, leads to active trading in what we call an
index “arbitrage complex” that facilitates active trading on tight spreads
for online traders and traders at hedge funds and broker-dealers. As the
pattern of growth and decline in capitalization reflected in the shares out-
standing for each of the 10 largest ETFs listed in Exhibit 4.2 illustrates, the
number of shares an ETF has outstanding is not stable. Short selling and
other risk-management-related ETF activity varies greatly in importance
depending, in large measure, on how widely the underlying index for the
ETF is used in risk management applications. Ultra-tight trading spreads
from the interaction of competing markets and competing instruments
have had a major effect only on the S&P 500 SPDRs and the QQQs. The
growing short interests for the DIAMONDS, based on the Dow Jones
Industrial Average, and the iShares Russell 2000 fund suggest that these
funds might ultimately experience some similar trading effects.
14
Two funds based on the same underlying index—the S&P 500 SPDR,
the largest ETF in terms of assets, and the iShares 500 ETF, the third larg-
est ETF in terms of assets—vary greatly in trading activity, and in the abso-
lute and relative size of the funds’ short interests. This particular case is
interesting because the iShares 500 has a very slightly lower expense ratio
than the 500 SPDR. Also, the two funds have had very similar performance
for most of the period they have competed, with the SPDRs showing the
better performance earlier and the iShares 500 fund having done a little
14
Significant recent activity in single stock futures (SSF) contracts on the DIA-
MONDS and the iShares Russell 2000 ETFs may be contributing to this change.
Some of these multimarket effects on trading activities are described in Chapter 8 of
Gastineau, The Exchange-Traded Funds Manual.
4-Gastineau-SellingETFs Page 50 Thursday, August 5, 2004 11:09 AM