Visualizing Project Management Models and frameworks for mastering complex systems 3rd phần 6 doc
Bạn đang xem bản rút gọn của tài liệu. Xem và tải ngay bản đầy đủ của tài liệu tại đây (1.65 MB, 48 trang )
214 THE TEN MANAGEMENT ELEMENTS IN DETAIL
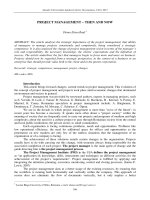
Figure 12.15 Schedule compression/expansion effects.
4
3
2
1
1.0 2.0 3.0
Actual Time
Optimal Time
Inefficient
Use of
Resources
High
Costs to
Shorten
Schedule
Actual Number of People
Optimal Number of People
network is constructed. However, resource restrictions or problems
are usually localized, and good judgment and common sense will
produce meaningful results. Reducing the critical path and optimiz-
ing resource allocation can significantly affect a task’s cost as illus-
trated graphically. Shortening a task schedule below the optimum
point can lead to an increase in its cost (Figure 12.15). On the other
hand, optimization at the network level may consist of offsetting a
relatively small increase in task cost with a significant savings at the
project level. For example, the incremental cost associated with
compressing one task may result in equivalent burn rate savings for
the total project.
PLANNING THE RESOURCES
While this section focuses on the two limiting resources in most
projects, personnel and funds, a unique physical resource can also
impact the schedule. Take nothing for granted. Just when you need a
special piece of test equipment that hasn’t been used for six months,
you can be sure Murphy will need it too. And Murphy’s team re-
served the equipment when they planned their project much earlier.
Another property issue to plan for in government projects is the use
PMBOK
®
Guide
PMBOK
®
Guide Sec 6.3 Activ-
ity Resource Estimating and
Ch 7 Project Cost Management
provide additional information
on estimating and costing the
planned work.
cott_c12.qxd 7/1/05 3:53 PM Page 214
PROJECT PLANNING 215
of Government Furnished Equipment, Services, and Material (gen-
erally called GFE). First, contractual commitments must be negoti-
ated for the GFE delivery dates. Second, permission must be
granted by the government agency that owns the equipment (or ser-
vices or material) that authorizes use of the material on your proj-
ect. In one instance, one of the authors won a contract that involved
manufacturing of components on special equipment owned by the
U.S. Army. Unfortunately, prior permission for the use of the equip-
ment had not been obtained. When asked for permission to use the
machinery, the Army project office said, “Of course. What is the
Army project number?” Answer: “It is a U.S. Air Force contract.”
Response: “Air Force? What Air Force? We don’t have an Air Force.
Permission denied.” Incomplete planning and preparation almost al-
ways lead to a bad outcome.
To illustrate the time-phased resource requirements at the task,
personnel category, and total project levels, Gantt charts are useful.
They are derived from the PERT/CPM network, but use a conven-
tional time scale, which may be more easily understood by the team.
Having already adjusted tasks to smooth resource requirements, en-
hance opportunities, or reduce risks and/or the critical path, the
next step is to return to the task level and define the personnel as-
signments and schedules.
The WBS is the basis for identifying task responsibilities (Fig-
ure 12.16). As a checklist, the Task Responsibility Matrix (Figure
12.17) is useful in summarizing which personnel and organizations
have been assigned primary and support responsibilities for each
task, and who will participate in the COW process. Figure 12.18 is
an example of a planning form that extracts the monthly personnel
needs from the task Gantt chart at the functional organization level
and combines them with other resource requirements.
ESTIMATING, COSTING, AND PRICING
An essential part of planning is calculating the most probable cost to
complete the project and then determining the market price. This
process is often called cost estimating, but is more accurately de-
scribed as estimating, costing, and pricing because each is a distinct
process and is usually performed by domain specialists.
Estimating is usually performed by the task managers most fa-
miliar with the work to be done. Estimates are made regarding per-
son hours, pounds and feet of material, number of lines of code, and
so on. As much as possible, estimates are based on sound information
cott_c12.qxd 7/1/05 3:53 PM Page 215
216 THE TEN MANAGEMENT ELEMENTS IN DETAIL
such as build-to drawings or direct past experience, but in most
cases the estimates are extrapolations, some of which depart signif-
icantly from the extrapolation baseline.
Costing is the conversion of the estimates into currency. Cost
analysts are trained experts in making this conversion. While mak-
ing the conversion they take into account the current hour or mate-
rial to currency conversion, expected inflation or deflation over the
period of the project, and all relevant burdens such as overhead and
general and administrative charges. When the hours and all other
resources have been costed with their appropriate burdens, then
the cost of the project has been estimated. There are several tools
in the marketplace to aid in costing hardware and software based
on attributes such as weight, lines of code, or function points. Many
companies also maintain a past-history database to substantiate es-
timating and costing.
Figure 12.16 Relationship between WBS and organization.
Cost
Account
Cost
Account
Cost
Account
Cost
Account
Radar
System
Transponder
Subsystem
Radar
Subsystem
Receiver
Assembly
Transmitter
Assembly
Antenna
Assembly
Feed
Subassy
Reflector
Subassy
Gimbal
Subassy
≈
≈
≈
DesignAnalysisTech Data
≈
≈
Physical
Design
Analytical
Design
Drafting &
Checking
Test
Engineering
Manufacturing
Design
≈
≈≈
≈
≈
Support
Organization
Level 1
Level 2
Level 3
Level 4
Work Breakdown Structure
Project
Summary
WBS
Contract
WBS
Mount
Subassy
Work Package 1
Work Package 2
Work Package 3
Task Manager _________________________
WBS _________ Budget ______________
Start __________ Complete ___________
Task Description: ______________________
_____________________________________
_____________________________________
_____________________________________
Approvals: Task Mgr __________
Support Mgr __________ Proj Mgr _______
Organization
cott_c12.qxd 7/1/05 3:53 PM Page 216
217
Figure 12.17 Individual task responsibility matrix.
Task
1
2
3
4
Engineering
Manufacturing
System
Integration
Test
Finance
Contracts
R = Responsible
S = Support
SSSSSR
RSSS
SRSSS
S
S
SR
Figure 12.18 Resource planning form.
cott_c12.qxd 7/1/05 3:53 PM Page 217
218 THE TEN MANAGEMENT ELEMENTS IN DETAIL
Pricing is a strategic decision made by management. It consists
of adding or subtracting profit from the cost number. Negative
profit is applicable when the project desires to capture a new market
and is willing to invest to do so. Some companies have bid a total
fixed price of zero to ensure capturing a high-value market. As the
profit is increased, the probability of winning in a competitive envi-
ronment decreases. Hence, this decision is one of marketplace strat-
egy and risk tolerance. Figure 12.19 illustrates the estimating,
costing, and pricing process.
The payoff of the detailed planning and scheduling is in secur-
ing support and commitment on the part of the team, functional or-
ganizations, subcontractors, general management, and the customer
or user. The key negotiations, made easier by detailed scheduling,
are those with the functional and task managers. The resulting
agreement, the heart of the project’s controlled work release sys-
tem, should be documented in the form of a Project Work Authoriz-
ing Agreement (PWAA) shown earlier. The PWAA contains task
definition, budget, schedule, performer’s commitment, and project
Figure 12.19 Estimating, costing, and pricing process.
Authorization agreements and
subcontracts authorize the
project work and, collectively,
represent and authorize the
implementation plan.
cott_c12.qxd 7/1/05 3:53 PM Page 218
PROJECT PLANNING 219
office authorization. Subcontracts add terms and conditions clauses.
The approved PWAA results from having:
Open and direct negotiations Budgets accepted
Tasks understood Contingencies identified
Milestones agreed Caveats documented
Our project cycle template includes a Project Initiation Review
decision gate. The objectives are to secure executive management
approval of the implementation plan and to obtain management com-
mitment of resources. The items to review include: contractual state-
ment of work or memorandum of agreement for internal projects,
deliverables, incentives; project strategy and tactics; implementation
plan; opportunities, risks, and actions; functional organization com-
mitments; and resources required.
KEEPING THE PLAN CURRENT
The project manager is responsible for:
• Assuring that all plans are consistent with current strategy, con-
straints, and the project’s environment.
•Establishing the methods, techniques, and tools used in planning.
•Using the techniques and tools to update the plan.
The techniques and tools, especially software applications that
support these responsibilities, are constantly improving. Before com-
mitting to a new software tool that may come up short as the project
grows, you may do well to heed the following precautions:
•Beware of nonstandard data input and output formats.
•Some products are conceived and promoted as a full-manage-
ment tool, but may only provide a scheduling algorithm.
•Test run the software.
•Use implementation tools. There are many computer-based tools
available to mechanize the planning process and capture the
project’s data. These tools facilitate the planning process all the
way from product decomposition through network development,
critical path analysis, and schedule definition. They also provide
for cost estimation, budget development, personnel planning,
and resource leveling. Most tools will facilitate status reporting
and associated rebaselining, if necessary.
•Talk to users who manage projects similar to yours.
•Set up operating procedures and standards.
•Insist that the standards be used.
The harder it is to plan, the
more you need to.
cott_c12.qxd 7/1/05 3:53 PM Page 219
220 THE TEN MANAGEMENT ELEMENTS IN DETAIL
PLANNING ELEMENT EXERCISE
The objective of this exercise is to provide experience in developing
a project network and in identifying and calculating the critical path
for a simple but relevant project.
Scenario: Develop a logic network and the critical path for the
turnaround of a commercial 140-passenger airliner from final land-
ing approach to takeoff clearance. A sample WBS for the airplane
turnaround is provided.
WBS for the Aircraft Turnaround Project
1.0 Passengers and crew.
1.1 Passengers.
1.1.1 Unload arriving passengers.
1.1.2 Load “Pre-board” passengers.
1.1.3 Load terminal-area passengers.
1.1.4 Obtain head count.
1.2 Flight crew.
1.2.1 Unload arriving crew (if required).
1.2.2 Load departing crew.
2.0 Baggage.
2.1 Unload arriving baggage.
2.2 Load baggage from terminal.
3.0 Cabin service.
3.1 Food.
3.1.1 Unload empty food carts.
3.1.2 Load new meals and beverages.
3.2 Cleaning.
3.2.1 Pick up trash.
3.2.2 Vacuum or sweep cabin.
3.3 Sanitation.
3.3.1 Clean lavatories.
3.3.2 Empty toilet sump tanks.
4.0 Fuel.
4.1 Determine fuel load required.
4.2 Load fuel.
4.3 Verify fuel onboard.
5.0 Operations Integration.
5.1 Landing control.
5.1.1 Obtain permission to land.
5.1.2 Land aircraft.
cott_c12.qxd 7/1/05 3:53 PM Page 220
PROJECT PLANNING 221
5.2 Takeoff control.
5.2.1 Obtain permission to takeoff.
5.2.2 Takeoff.
5.3 Taxi control.
5.3.1 Obtain permission to taxi after landing.
5.3.2 Taxi to gate.
5.3.3 Obtain permission to taxi prior to takeoff.
5.3.4 Taxi to takeoff holding point.
5.4 Gate control.
5.4.1 Obtain permission to open door.
Ensures that the exit ramp is in place before opening
the door.
5.4.2 Open cabin door.
5.4.3 Obtain permission to close door.
Ensures that all ticketed passengers in gate area are
on board, and that all maintenance and service per-
sonnel have completed their tasks and have left the
plane. The pilot and ticket agent must both concur
plane is ready.
5.4.4 Close cabin door.
5.5 Deicing application if required.
The deicing operation is done after all passengers are
on board and the cabin door is closed. Deicing can be
done at the gate or on the taxiway near the terminal. It
must be completed within 15 minutes prior to actual
takeoff.
5.5.1 Apply deicing if required.
5.5.2 Verify deicing application is within time limit.
6.0 Project management.
6.1 Data management.
6.1.1 Gather turnaround time statistics.
6.1.2 Report performance.
6.2 Manage “Turnaround Improvement Project.”
The following functions should be provided for:
Air Traffic Control.
Ground Control.
Passenger and Crew Management.
Food Management.
All operational tasks in the WBS are linked into the serial/paral-
lel relationships and then timed (example: Clean airplane—12 min-
utes) that will satisfy a turnaround time of 40 minutes. Plan events
cott_c12.qxd 7/1/05 3:53 PM Page 221
222 THE TEN MANAGEMENT ELEMENTS IN DETAIL
from aircraft touchdown to aircraft liftoff. You must budget three
minutes from touchdown to gate arrival and three minutes for de-
parture from gate to liftoff, and allow two minutes additional for de-
icing in winter.
The results should be (1) determination of the critical path ac-
tivities and (2) what tasks should be addressed to further shorten
turnaround time.
cott_c12.qxd 7/1/05 3:53 PM Page 222
223
13
OPPORTUNITIES
AND THEIR RISKS
California is a great place to live, complete with excellent
climate, ethnic diversity, vibrant economy, and unlimited
recreational possibilities. The opportunity of enjoying these
benefits comes at the risk of earthquake devastation. Over the
years, homeowners mitigated this risk by carrying earthquake
insurance at modest rates. They had little need to call on the
benefits until October 17, 1989, when California was hit by
the magnitude 7.1 Loma Prieta earthquake causing huge
insured losses with deductibles as low as $1,000. The claims
impact to insurance companies was profound and the
insurance industry began canceling homeowner policies and
declining earthquake insurance. The California Earthquake
Association was formed to provide homeowners with
earthquake insurance with a deductible of 15 percent of the
replacement value. But an important provision changed the
insurance value proposition: In the event of a large quake
without enough money to go around, benefits are to be
prorated. While California is still a place of opportunity, the
risk is considerably higher than pre–Loma Prieta.
PMBOK
®
Guide
This chapter is consistent with
the content of PMBOK
®
Guide
Ch 11 Project Risk Manage-
ment although there are defi-
nition differences that will be
noted.
INCOSE
This chapter is consistent with
INCOSE Handbook Sec 5.8
Risk Management Process.
THE OPPORTUNITY—RISK RELATIONSHIP
Over the past three decades, there has been a gradual paradigm shift
in risk management. The 1960s and 1970s introduced the concept of
risk management and the idea that project teams should anticipate
risks and plan to reduce their impacts. This led to risk identification,
top ten risk lists, and even risk management plans, although uniform
tcejorP
stnemeriuqeR
seitinutroppO
s
ks
i
R d
na
evitcerroC
noitcA
noitazinagrO
snoitpO
tcejorP
maeT
tce
jorP
gninnalP
tcejorP
lortnoC
tcejorP
sutatS
P
r
o
j
e
c
t
L
e
a
d
e
r
s
h
i
p
P
r
o
j
e
c
t
L
e
a
d
e
r
s
h
i
p
P
r
o
j
e
c
t
L
e
a
d
e
r
s
h
i
p
P
r
o
j
e
c
t
L
e
a
d
e
r
s
h
i
p
P
r
o
j
e
c
t
L
e
a
d
e
r
s
h
i
p
P
r
o
j
e
c
t
L
e
a
d
e
r
s
h
i
p
tcejorP
ytilibi
siV
Management
Element 5
“A ship in a harbor is safe, but
that’s not what ships are built
for.”
William Shedd
Ships are built to pursue
opportunities, as are projects.
Risks are born of opportuni-
ties. Without opportunities
there are no risks.
cott_c13.qxd 7/5/05 1:43 PM Page 223
224 THE TEN MANAGEMENT ELEMENTS IN DETAIL
When you’re encouraged to
take risk, make sure to keep
the driving opportunity in per-
spective.
PMBOK
®
Guide
The PMBOK
®
Guide Ch 11
Project Risk Management
states that risks can have a
positive or negative outcome.
Our approach recognizes that
opportunities seek a positive
outcome and their associated
risks diminish that opportunity.
adoption and implementation were slow. Then in the 1980s and
1990s, opportunities began to be addressed along with risks.
A review of current texts on risk management reveals that books
written in 2000 and 2001 may mention opportunity and may even
devote a paragraph to it. Then in 2002 and 2003, the emphasis
climbs to a page or two, but opportunities are treated as things that
happen with good results as opposed to being the very thrust of
project management. A prominent risk management text defines op-
portunity, “as a possible occurrence that will have a positive effect
on the project.” It goes on to say that, “opportunities should be iden-
tified to balance out the negative occurrences (risks) as well as to
take advantage of additional benefits of the project.” We take issue
with this perspective.
Project management is all about pursuing an opportunity to
solve a problem or fulfill a need. Opportunities enable creativity in
resolving concepts, architectures, designs, strategic and tactical ap-
proaches, as well as the many administrative issues within the proj-
ect. It is the selection and pursuit of these strategic and tactical
opportunities that determine just how successful the project will be.
Of course, opportunities usually carry risks. Each will have its own
set of risks that must be intelligently judged and properly managed
to achieve the full value of each opportunity.
This chapter is not about risk management, but rather about
managing opportunities and their risks to enhance ultimate project
value. We see problems and risks much as Henry Kaiser did, as just
opportunities in work clothes.
In project management, opportunities represent the potential
for improving the value of the project results. The project champi-
ons (the creators, designers, integrators, and implementers) apply
their “best-in-class” practices in pursuit of opportunities. After all,
the fun of working on projects is doing something new and innova-
tive. It is these opportunities that create the project’s value. Risks
are defined as chances of injury, damage, or loss. In project manage-
ment, risks are the chances of not achieving the results as planned.
Each of the strategic and tactical opportunities pursued have asso-
ciated risks that undermine and detract from the opportunity’s
value. These are the risks that must be managed to enhance the op-
portunity value and the overall value of the project.
Opportunity and risk management are essential to—and per-
formed concurrently with—the planning process, but require the
application of separate and unique techniques that justify this dis-
tinct project management element.
When we pursue the opportunity to arrive at a destination early
by speeding down the highway, we accept the risk of incurring an
The value of the opportunity
must justify the incurred risks.
cott_c13.qxd 7/5/05 1:43 PM Page 224
OPPORTUNITIES AND THEIR RISKS 225
expensive traffic fine and higher insurance rates. To speed, our ac-
celerator foot instinctively stabilizes at the exact position where we
perceive the probability and benefit of arriving early is exactly
equal to the probability and consequences of getting caught. We
naturally and regularly make this trade and balance the expected
outcomes with our accelerator foot for this combination of opportu-
nity and risk.
The power of this concept is in the ability to adjust the opportu-
nity to reduce or eliminate an undesired risk. One of the authors
wanted a multiuse vehicle with all-wheel drive to get to the ski
slopes. The opportunity was to purchase a sports utility vehicle
(SUV), but the local newspaper and television vividly portrayed the
risk of rollover. Risk was significantly reduced by simply adjusting
the opportunity from an SUV to a minivan with all-wheel drive and
a lower center of gravity that significantly reduces the rollover po-
tential. Many project situations can be addressed by adjusting the
opportunity to fit the risk tolerance of the project.
It is sometimes difficult to identify the opportunity that causes
the risk (the “causing opportunity”). For instance, inhabitants of the
southeastern United States are subjected to hurricanes almost every
year. The causing opportunity, of course, is enjoying the benefits of
living within the hurricane zone. Many people knowingly make that
decision and consider the risk worthwhile. Similarly, other people
prefer San Francisco as a place of residence in spite of the well-
known risk of earthquakes.
If you have difficulty identifying or evaluating the causing op-
portunity, the risk just might not be important enough to accept and
manage. In this case, consider eliminating the item or circumstances
creating the risk.
LEVELS OF OPPORTUNITY AND RISK
In project management there are two levels of opportunities and
risks. Because a project is the pursuit of an opportunity, the first
category, the macro opportunity, is the project opportunity itself.
The approach to achieving the project opportunity and the mitiga-
tion of associated project-level risks are structured into the strategy
and tactics of the project cycle, the selected decision gates, the
teaming arrangements, key personnel selected, and so on.
The second level encompasses the tactical opportunities and
risks within the project that become apparent at lower levels of de-
composition and as project cycle phases are planned and executed.
This can include emerging, unproven technology; incremental and
When we pursue opportunity,
we normally incur risk. The
opportunity to experience the
thrill of an exciting sport like
hang gliding or scuba diving
brings with it the attendant
risks. Many people instinc-
tively make the trade that the
thrill is worth the risks. Others
decline.
Opportunities and risks are
endemic to the project envi-
ronment. However well
planned a project may be,
there will always be residual
project risk.
cott_c13.qxd 7/5/05 1:43 PM Page 225
226 THE TEN MANAGEMENT ELEMENTS IN DETAIL
There is no simple way to
prevent disasters. Nothing
short of a systematic, detailed
process will work.
If you don’t actively attack
risks, the risks will actively
attack you.
If you don’t identify opportuni-
ties, they won’t be in your field
of view.
evolutionary methods that promise high returns; and the tempta-
tion to circumvent proven practices in order to deliver better,
faster, and cheaper.
In the heat of project battle, it is easy for opportunities and risks
to slip by or to slip in inadvertently. It is the project manager’s re-
sponsibility to maintain a high level of awareness among all project
participants, especially during various activities, such as:
•Project definition,
•Concept definition,
• Architecture definition,
•Strategic and tactical planning,
•Artifact selection and development,
•Hardware and software development,
•Manufacturing and coding,
•Supplier selection,
•Verification,
•Shipping and handling,
•Deployment, and
• Change evaluation.
Regarding the career-limiting effect of underestimating future
risks, March and Shapira have articulated this management di-
chotomy: “Society values risk taking but not gambling, and what is
meantbygamblingisrisk taking that turnsout badly Thus,
risky choices that turn out badly are seen, after the fact, to have
been mistakes. The warning signs that were ignored seem clearer
than they were; the courses that were followed seem unambiguously
misguided.”
1
The rest of this chapter is about maximizing opportunities and
dealing directly with the inevitability of their risks—the foresee-
able ones as well as the “unknown unknowns” that occur throughout
the project.
PROJECT-VALUE-DRIVEN OPPORTUNITY AND
RISK MANAGEMENT
Project value can be expressed as benefit divided by cost. Opportu-
nities and their risks should be managed jointly to enhance project
value. This is based on the relative merits of exploiting each oppor-
tunity and mitigating each risk. In the context of the opportunity
and the resultant project value, you make that kind of evaluation in
cott_c13.qxd 7/5/05 1:43 PM Page 226
OPPORTUNITIES AND THEIR RISKS 227
PMBOK
®
Guide
The PMBOK
®
Guide Ch 11
Project Risk Management
identifies six processes:
1. Risk Management
Planning.
2. Risk Identification.
3. Qualitative Risk Analysis.
4. Quantitative Risk Analysis.
5. Risk Response Planning.
6. Risk Monitoring and
Control.
your personal life every time you estimate how much you will drive
per year (your opportunity) to decide how much insurance you
should carry and with what level of deductible, which is the amount
of residual risk you are willing to accept (your risk tolerance).
We carry a spare tire to mitigate the risk of a flat tire by re-
ducing the probability and impact of having a delayed trip. The
high value we place on getting where we want to go far exceeds the
small expense of a spare. When deciding to pursue the opportunity
of a long automobile trip, we may take extra risk management pre-
cautions, such as preventive maintenance and spares for hard-to-
find parts.
The assessment of opportunity and risk balance is situational.
For instance, few of us today have a car with more than one spare
tire (multiple spares were a common practice in the early 1900s).
However, a friend of one of the authors decided to spend a full
month driving across the Australian Outback in late spring. He was
looking for solitude in the wilderness (the opportunity). On advice
from experienced friends, he took four spare tires and wheels. They
also advised him that the risk of mechanical breakdown was very
high on a 30-day trip, and the consequence would almost certainly
be fatal. However, the risk of two vehicles breaking down at the
same time was acceptably low. So he adjusted the opportunity for
absolute solitude by joining two other adventurers. They set out in
three cars. Everyone survived in good health, but only two cars re-
turned, and two of his “spare” tires were shredded by the rough ter-
rain. The mitigation approach proved effective.
We define opportunity and risk management as the process to
enhance the opportunities and reduce their risks by:
• Identifying potential opportunities and their risks.
• Assessing associated probabilities of occurrence and the impact
(benefit or consequence) of the occurrence to the project’s value.
• Deciding to:
Do nothing OR Take causative OR Take contingent
action for action in response
opportunity, to a predefined
preventive trigger.
action for risk.
Opportunity management is driven by the desire to excel and
risk management is driven by the desire not to fail or fall short of
the objectives. The major driving forces for each are shown in Fig-
ures 13.1 and 13.2.
INCOSE
INCOSE Handbook Sec 5.8
Risk Management Process
defines risk management as:
• Risk Identification.
• Risk Planning.
• Risk Assessment.
• Risk Prioritization.
• Risk Handling and
Mitigation.
• Risk Monitoring.
cott_c13.qxd 7/5/05 1:43 PM Page 227
228 THE TEN MANAGEMENT ELEMENTS IN DETAIL
Since many opportunities and
risks are discovered in the
decomposition process, it is
impossible to identify all
opportunities and their risks at
the outset.
Opportunity and risk management depends on a solid founda-
tion of planning and proactive management of the plan. Good plan-
ning practices are:
•Develop (and use) an implementation plan that is:
—Developed—and committed to—by the project team.
—Kept current.
•Use proven processes tailored to your project.
—Systems engineering methodology.
—Software development methodology.
—Hardware development methodology.
—Reliability and quality methodology.
•Manage the business and technical baselines.
—Keep participants informed of the evolving baseline.
The project team may feel they have already “managed” the
risks by creating the initial opportunity/risk management plan. But
opportunity and risk management is ongoing—it evolves as the proj-
Figure 13.1 Opportunity management objectives—driven by the desire to excel.
Benefit - B
sseccuS fo ytilibabor
P-
P
s
0
1.0
Low
High
Manage to achieve high benefit and
high probability
• Seek opportunities to support the strategic objectives
• Foster creativity to achieve best-in-class performance
• Keep the team energized to excel
• Proactively manage success
cott_c13.qxd 7/5/05 1:43 PM Page 228
OPPORTUNITIES AND THEIR RISKS 229
Each opportunity and its risk
should be evaluated as a
whole, taking into account
relative probabilities and
offsetting benefits and
consequences.
ect proceeds. Plans must be updated as new opportunities and risks
are identified and the impacts are evaluated.
Opportunities and risks are interrelated and the risks must be
justified by the opportunity pursued. The following eight-step op-
portunity and risk management process justifies decisions based on
expected value analysis:
1. Identify the opportunities and risks.
•What opportunities are available? What benefits?
• What are their risks? What consequences?
•Describe with “If , then ” statements.
• Group by like categories, such as funding, safety, sched-
ule, and so on.
2. Assess both probability and impact. Forecast the expected value.
3. Prioritize according to expected project value.
4. Develop candidate management actions to enhance opportuni-
ties and mitigate risks.
5. Estimate the cost of both immediate and contingent actions.
Figure 13.2 Risk management objectives—driven by the desire not to fail.
Adverse Consequence - C
ƒ
eruliaF fo ytilibabor
P-
P
ƒ
0
1.0
Low
High
Manage to reduce probability and consequence
toward zero
• Adjust driving opportunity to reduce or eliminate the risk
• Reduce probability by removing failure causes (drive safely)
• Reduce impact by anticipating the result and preparing for it
(wear seat belts)
• Hold management reserve for reactively handling risk
cott_c13.qxd 7/5/05 1:43 PM Page 229
230 THE TEN MANAGEMENT ELEMENTS IN DETAIL
6. Compare changes to expected value against action costs (Miti-
gation Leverage).
7. Decide on actions required and obtain concurrence.
8. Document and incorporate decisions in all planning.
Some project managers and executives make a distinction be-
tween eliminating risks versus insuring against them (such as liabil-
ity insurance) or deciding on an action versus planning a contingency.
In our view, these are simply alternative cases of opportunity and
risk management and need to be evaluated as such. For example, we
consider insurance as one possible mitigating action for product lia-
bility risks. The examples that follow demonstrate techniques that
are unique to opportunity and risk management. Opportunity and
risk management actions fall into four categories:
1. Accept the opportunity and its risks with no exceptional action.
We use this approach when we cross a street at a crosswalk
with no exceptional actions to enhance the experience or re-
ducethe risk.
2. Avoid the risk, which can often be accomplished by adjusting
the opportunity to eliminate the risk cause. Driving carefully
within the speed limit with seat belts fastened is an example of
risk avoidance.
3. Retain the opportunity and transfer the unacceptable portion
of the risk to a third party usually with onlyasmalleffect on
the expected value of the opportunity. This iscommonly
achieved by insurance such as collision insurance and home-
owners insurance.
4. Mitigate the risk and retain the opportunity. Reduce the proba-
bility or consequences of the risk to an acceptable level by one
or more actions. In technical projects, redundant circuits and
high reliability parts are possible mitigation actions.
IDENTIFYING OPPORTUNITIES AND THEIR RISKS
A major challenge of the project manager is team motivation. The
“risk list” is a demoralizing force as the team engages in ongoing dis-
cussions to identify all the things that could go wrong. As Rita Mul-
cahy phrased it in her book Risk Management, “opportunities should
be identified to balance out the negative occurrences (risks) as well
as to take advantage of additional benefits of the project.”
2
Mulcahy
recognizes the negative morale that can result from incessant risk
management viewed exclusive of the creating opportunities.
cott_c13.qxd 7/5/05 1:43 PM Page 230
OPPORTUNITIES AND THEIR RISKS 231
The “managing opportunities and their risks” approach main-
tains harmony and balances the evaluations. A risk that key person-
nel may not be available when required sounds serious. If the real
situation is that the best supplier in the country has agreed to do the
work (opportunity), but their best personnel may not be available
(risk), then a key personnel clause in the contract may be sufficient
to mitigate the risk. Having the opportunity and risk tied together
puts the problem in context and balance.
On the Boeing 777 development, Boeing engineers wanted to
seize the opportunity of using aluminum-lithium to save weight,
gain payload capacity, and maximize fuel economy (opportunity).
However, machining the material caused cosmetic cracks that would
have to be explained in their maintenance manuals (risk). Discus-
sions were held at the highest levels of management to evaluate the
value trade-offs and impact to the 777 program. Aluminum-lithium
was rejected as too risky to the market image of Boeing. It was a sig-
nificant project-value-based judgment, as well as a vivid case of sys-
tems thinking.
A simple approach is to reward those who identify opportunities
and risks. A cost-effective technique is a prominent posting (perhaps
outside a manager’s door) of all the opportunities and their risks in
a manager’s domain. A brief statement of what actions will be taken
(or if no action is to be taken, why not) and who has the action
should be included in the listing. The listing has powerful effects. It:
• Shows that the manager is serious about pursuing and managing
creativity.
•Rewards participants (printed recognition is an effective, inex-
pensive reward).
•Stimulates others to think of opportunities.
•Precludes redundant efforts.
•Prompts others to offer suggestions for how to mitigate identi-
fied risks.
It can be helpful to subdivide the myriad of possible opportuni-
ties and risks into categories. Opportunity categories are strategic
and tactical, like deciding what business to be in (strategic) and then
pursuing the business (tactical). Figure 13.3 illustrates examples in
each category. Using emerging technology or new development tools
are examples of tactical opportunities that bring with them the risk
of unsuccessful implementation.
Risk categories include risks to project implementation and risks
to, of, and by the product, such as lack of sufficient funding (imple-
mentation) and incorporating dangerous toxins (product). Figure 13.4
To evaluate risk without regard
to the driving opportunity is
almost meaningless and could
be irresponsible.
cott_c13.qxd 7/5/05 1:43 PM Page 231
232 THE TEN MANAGEMENT ELEMENTS IN DETAIL
illustrates examples in each category. This is only a representative
list—all relevant areas must be considered. Each of these areas
should be evaluated in the context of the causing opportunity.
Identify the opportunities and risks for each project-cycle phase
by systematically applying the appropriate techniques based on
analysis, planning, and history. Techniques based on analysis include:
•Opportunity and risk checklists (the categories and lists in Fig-
ures 13.3 and 13.4 offer a beginning checklist).
•Rules of thumb and standards of performance.
•System decomposition and critical items (Vee off-core analysis).
•Hazard analysis.
•Failure modes analysis.
•Interviews with experts.
There is a wide variety of texts available that provide insight and
checklists on identifying risks having to do with project administra-
tion, that is, risks associated with schedule, critical path, funding, re-
sources, personnel, and so on. Tom Kendrick’s book, Identifying and
Figure 13.3 The two categories of opportunities and risks.
cott_c13.qxd 7/5/05 1:43 PM Page 232
OPPORTUNITIES AND THEIR RISKS 233
Managing Project Risk,
3
and Rita Mulcahy’s book, Risk Manage-
ment,
4
are excellent references.
Figure 13.5 illustrates three areas of risks relative to the oppor-
tunity of product solution creation on development projects.
The first are “risks to the solution,” such as shipping and han-
dling. We are all very familiar with the use of foam popcorn and
bubble wrap to mitigate the handling risk when shipping a fragile
product. This category also includes the need for contamination con-
trol in semiconductor manufacturing, in pharmaceutical develop-
ment and production, and in spacecraft development. In secure
projects, security risks are critical and risk management must en-
sure the project’s opportunity is not compromised by inadvertent
disclosure. A recent mishap, when the NOAA N Prime $200 million
satellite fell off of its tilt stand and crashed to the floor, is an excel-
lent example of the handling risks not being properly managed. In
this case, operators bypassed good workmanship practices and did
not follow established procedures.
The second category is “risks of the solution,” which become
imbedded within the product only to surface later and cause project
failure. There are many famous illustrations of this type of poorly
Figure 13.4 The two categories of tactical opportunities and risks.
Tactical
Opportunities and Risks
These can seriously influence the ability to deliver
Systems
Engineering
Issues
Systems
Engineering
Issues
Product
Ability to satisfy the
needs
Product
Ability to satisfy
the needs
•
Feasibility
• Design
•
Producibility
• Development
•
Failure modes
•Hazards
•
Stakeholder support
• Funding
•
Cost/budget
• Schedule
•
Resources
• Suppliers
Programmatic
Ability to deliver as
planned
Programmatic
Ability to deliver
as planned
Project
Management
Issues
Project
Management
Issues
cott_c13.qxd 7/5/05 1:43 PM Page 233
234 THE TEN MANAGEMENT ELEMENTS IN DETAIL
managed risk. The Hubble telescope, the space shuttle Challenger,
the Ford Pinto, the submarine Scorpion, and all the vehicles and
other products that are the subject of product recalls were deployed
with flaws built in to their products. Good design and verification
practices should have caught and fixed every one of these flaws be-
fore first deployment. However, other stakeholders may have over-
riding priorities. A tragic case of this opportunity/risk relationship
occurred in the 1970s. Lee Iacocca, head of the new Ford Pinto car
development, was committed to pursuing the opportunity to enter a
new market segment in competition with Japan and Germany for a
low-cost car. He mandated 2,000 pounds and $2,000 as the value
criteria that had to be met with no exceptions. It was soon discov-
ered that the car would explode on rear impact because of gas tank
location and design. To address that risk, the company could have
made an $11 per car modification. However, they elected to accept
the risk and pay for injury and deaths because the liability cost
would be less than the tank modification cost. This unfortunate de-
cision was based solely on a cost of the opportunity versus the cost
of the consequences and resulted in several hundred lost lives.
The third product category is “risks by the solution” where the
solution contains risks that can cause injury to the product or to
those using the product. Nuclear power plants, radiation benches,
weapons, and hospitals are all solutions that can cause injury to the
innocent. Hospitals now shorten rehabilitation time to quickly exit
patients from the potentially infectious environment of the hospital.
All of these areas must be considered in opportunity and risk
planning in order to achieve a high probability of success.
Figure 13.5 Areas of product risk.
Risks
Product Risk Areas
Risks to, of, and by the solution
Risks Risks
cott_c13.qxd 7/5/05 1:43 PM Page 234
OPPORTUNITIES AND THEIR RISKS 235
Hazard analysis is a risk identification technique used to ensure
all system hazards have been identified and anticipated in plans.
Once identified, all hazards to personnel and to the system are
either accepted, reduced by design, or contained by practice. For
example, a high-pressure gas hazard can be reduced by designing
the equipment with a large safety factor. Alternatively, the risk of
explosion can be contained by placing sand bags or other protection
between the hazard and personnel.
Failure Modes and Effects (and Criticality) Analysis (FMEA
and FMECA) are risk identification techniques used to ensure all
significant failure modes have been identified and anticipated.
These techniques employ the following:
•Selection of a ranking or prioritizing scheme for project failure
modes concern and attention.
•Identification of all single-point failure modes and ranking of
them.
•Analysis of additional failure modes and the resultant opera-
tional effects.
•Determination of those failure modes requiring elimination, re-
dundancy, and/or increased reliability.
•Implementation of the corrective action.
When ranking FMEA risks, it is helpful to have clear categories.
Consider the following category examples:
Category #1—Loss of life.
Category #1R—Loss of life but the mode has redundancy.
Category #2—Mission fails.
Category #2R—Mission fails but mode has redundancy.
Category #3—Mission is compromised.
Category #3R—Mission is compromised but failure mode has
redundancy.
Other effective risk identification techniques are usually based
on planning and on past lessons learned. Scenario planning is a “low-
tech” technique for “visualizing” opportunities and risks, and is use-
ful in project planning judgment. It consists of querying:
•“What if ?” followed by “. . . then what?”
•What opportunities might be pursued?
• What could go wrong?
This technique can also be used to build a decision tree based on
broad market and economic trends: “If the economy does this, I’ll do
cott_c13.qxd 7/5/05 1:43 PM Page 235
236 THE TEN MANAGEMENT ELEMENTS IN DETAIL
that.” These scenarios can often identify important assumptions that
traditional forecasting tends to miss. It represents another systematic
way to consider future possibilities. Planning techniques also include:
•Project network interaction analysis.
•Critical path content and near critical path analysis.
•Schedule slack adequacy and position.
The techniques based on history are the most natural to apply.
They include:
•Similar efforts and their lessons learned,
•Expert interviews,
•Technical surveys, and
•Development test results.
Generalized historical templates can work well in some industries.
Forexample, construction projects are highly repetitive compared
with research and development. Because the work patterns of one
project may be similar to selected ones from the past, the same types
of risks are likely to occur and lessons learned are especially relevant.
Alternatively, misperceptions or misinterpretations about prior
projects will sometimes lead project teams to overestimate their abil-
ity to control future risks or to exploit future opportunities. It has
often been left up to project leaders to identify risk based on their
own experiences and perception of the situation. Such projects were
at the mercy of whatever their experiences and perceptions were. As
one engineer put it, “The alligator that was the closest to you was the
one you worried about the most. You didn’t look at the other ’gators in
the swamp, even though they were bigger and meaner.” A common
misperception is that successful experiences with simpler projects
scale to complex ones. Every new project has to be analyzed in detail
to understand those unique properties that distinguish it from its pre-
decessors. This needs to be an ongoing team effort, and it relies heav-
ily on lessons learned.
ASSESSING PROBABILITY AND IMPACT
A goal of identifying and anticipating all opportunities and risks
would be overwhelming. The result of anticipating every possible
opportunity and risk could bury the team in questionable informa-
tion and turn the project into a hand-wringing exercise. This drama-
tizes the importance of prioritization.
There are a number of sophisticated and powerful tools available
for opportunity and risk analysis, such as decision trees and Monte
Not only is each project
unique, but the uniqueness is
often the source of its risk.
cott_c13.qxd 7/5/05 1:43 PM Page 236
OPPORTUNITIES AND THEIR RISKS 237
Carlo simulations. These tools and others are described in texts such
as Clemen’s book, Making Hard Decisions,
5
and Tom Kendrick’s
book, Identifying and Managing Risk.
6
However, for most decisions we face in a project environment a
much simpler technique (called expected value) can be used, and it
is described as follows.
The expected value (EV), sometimes called weighted value, ex-
pected outcome, or risk factor, is a technique for quantitatively com-
paring both opportunities and risks. It provides the project manager
with a measure for sizing management reserves for investment and
protection. The EV of opportunity and risk is equal to the probabil-
ity of occurrence multiplied by the impact. For example:
Probability of occurrence of an opportunity = 0.6
Benefit of the opportunity =$720,000 if it does
occur
Therefore, expected value = (0.6) × ($720,000)
= $432,000
Expected value provides a method for quantitatively comparing
both opportunities and risks. The primary use of EV is to prioritize
potential actions. When applying EV, be sure to use consistent units.
For the purposes of prioritizing, “burn rate” (usually expressed as a
daily expense rate) may be used to measure schedule impact in dol-
lars. The following is an example of prioritizing two risks involving
potential schedule slip and burn rate.
Risk 1 Expected Value Risk 2 Expected Value
(0.8) × ($100,000) = $80,000 (0.4) × ($60,000) + (0.4) × (45-day
slip) = $24,000 (cost) plus 18-days
(schedule)
Assuming a $2,000/day burn rate, a
45-day slip would cost $90,000
Expected value, on a cost basis,
= $24,000 + (0.4) × ($90,000)
= $60,000
On the basis of this analysis, Risk 1 should be of higher priority
than Risk 2. The risk can be managed by influencing the probability
of occurrence and/or the impact of the outcome.
Acompletelistingofthe possible influencing activities with
theirassociated costs should be developed (Figure 13.6). From this,
you can decide on the appropriate actions. There are basically two
types of actions to consider: causative or preventive, and contingent.
When applying expected
value, common sense and
good judgment are required
because the calculations, usu-
ally based on subjective infor-
mation, will have low
accuracy.
PMBOK
®
Guide
The PMBOK
®
Guide Sec 11.3
Qualitative Risk Analysis and
11.4 Quantitative Risk Analysis
differentiate qualitative risk
analysis from quantitative risk
analysis. Qualitative prioritizes
risks and quantitative is
numerical analysis of the risk
effect on the project.
cott_c13.qxd 7/5/05 1:43 PM Page 237
238 THE TEN MANAGEMENT ELEMENTS IN DETAIL
Causative actions enhance opportunity expected value and pre-
ventive actions reduce risk expected value. Contingent actions are
the same as causative or preventive actions, except that no action
other than preparation is taken until a predetermined trigger initi-
ates the action.
Causative and
Preventive Actions
Adjusting the opportunity to
reduce the risk.
Redundancy to eliminate single-
point failure modes.
Higher quality to increase
reliability.
Increased margins to improve
safety.
Enforced use of common
software languages and
Contingent Actions
Red-line limits in test procedures
(terminate test if exceeded).
Establish thresholds for vari-
ance analysis and corrective ac-
tion (triggers a focused review).
Planned tactical changes
contingent on a competitor’s
performance.
Unsolicited proposal based on
competitor’s poor performance.
Figure 13.6 Management of opportunity and risk actions.
Risks
Expected
Outcomes
High
Medium
Low
Possible
Mitigating and
Enhancing
Activities
Associated
Cost of
Each
Activity
Possible
Mitigating and
Enhancing
Activities
Associated
Cost of
Each
Activity
Opportunities
Do nothing —
accept risk and
ignore opportunity
Take action now
Plan action to be
implemented at
trigger
cott_c13.qxd 7/5/05 1:43 PM Page 238