NEJM CARDIOVASCULAR DISEASE ARTICLES - Part 6 ppsx
Bạn đang xem bản rút gọn của tài liệu. Xem và tải ngay bản đầy đủ của tài liệu tại đây (846.56 KB, 42 trang )
n engl j med
351;25
www.nejm.org december
16, 2004
inflammatory markers and the risk of coronary heart disease in men and women
2601
tubes were then placed on ice packs, stored in Styro-
foam containers, returned to our laboratory by over-
night courier, centrifuged, and divided into aliquots
for storage in liquid-nitrogen freezers (¡130°C or
colder).
The levels of C-reactive protein were determined
by means of a highly sensitive immunoturbidimetric
assay with the use of reagents and calibrators from
Denka Seiken; this assay has a day-to-day variability
of 1 to 2 percent. Levels of sTNF-R1, sTNF-R2, and
interleukin-6 were measured by means of enzyme-
linked immunosorbent assays (R&D Systems),
which have a day-to-day variability of 3.5 to 9.0 per-
cent. Levels of inflammatory markers were largely
unaffected by transport conditions and reproducible
within subjects over time.
22,23
Total, high-density
lipoprotein (HDL), and directly obtained low-den-
sity lipoprotein (LDL) cholesterol and triglycerides
were measured according to standard methods with
the use of reagents from Roche Diagnostics and
Genzyme. Study samples were sent to the labora-
tory for analysis in randomly ordered batches, and
the laboratory personnel were unaware of a sam-
ple’s case–control status.
The study protocol was approved by the institu-
tional review board of the Brigham and Women’s
Hospital and the Human Subjects Committee Re-
view Board of Harvard School of Public Health.
exclusions
After the exclusion of participants with missing data
on biomarker levels, our data sets consisted of 708
women (239 patients and 469 controls) and 794
men (265 patients and 529 controls). The assay for
interleukin-6 required slightly more plasma than we
originally reserved for this assay among women.
Therefore, analyses involving interleukin-6 were re-
stricted to the subgroup of 676 women for whom
interleukin-6 levels were available.
statistical analysis
We analyzed the two cohorts separately. Inflamma-
tory markers were divided into quintiles, from the
lowest to highest levels, on the basis of the sex-spe-
cific distributions among the controls. With risk-set
sampling, the odds ratio derived from the logistic
regression directly estimates the hazard ratio and,
thus, the relative risk.
20
We analyzed the association
between biomarker levels and the risk of coronary
heart disease using both conditional and uncon-
ditional logistic regression, with adjustment for
matching factors. Because both analyses provided
essentially the same results, we present the results
of unconditional logistic regression, which parallel
the results in the subgroup analyses.
In our multivariable model, we further adjusted
for parental history of coronary heart disease before
the age of 60 years (yes vs. no), alcohol intake (non-
drinker, 0.1 to 4.9 g per day, 5.0 to 14.9 g per day,
15.0 to 29.9 g per day, or at least 30.0 g per day),
body-mass index (less than 20, 20 to 24, 25 to 29,
30 to 34, or 35 or more), physical activity (in quin-
tiles from lowest to highest level), ratio of total to
HDL cholesterol (in quintiles from lowest to high-
est ratio), and use of postmenopausal hormone
therapy (yes vs. no — for women only). Finally, we
also added a history of diabetes (yes vs. no) and hy-
pertension (yes vs. no) at baseline to the model to
assess the effect of these potential mediators. Base-
line was defined as the year blood was drawn.
Correlation coefficients were calculated with the
use of age-adjusted Spearman partial-correlation
coefficients. To test for linear trend, we used the me-
dian levels of inflammatory markers in the control
categories as a continuous variable. To pool the esti-
mates of relative risk for men and women, we used
the weighted average of estimates according to the
random-effects model of DerSimonian and Laird.
24
All P values are two-tailed, and P values below
0.05 were considered to indicate statistical signifi-
cance. All analyses were performed with the use of
SAS software, version 8.2 (SAS Institute).
baseline characteristics
Women in whom coronary heart disease developed
during follow-up had significantly higher baseline
levels of sTNF-R1 and sTNF-R2 than did control
women; however, the levels did not differ signifi-
cantly between men in whom coronary heart dis-
ease developed during follow-up and men in the
control group (Table 1). In the case of both men and
women, patients had significantly higher baseline
levels of interleukin-6 and C-reactive protein than
controls.
The levels of sTNF-R1 and sTNF-R2 showed a
high degree of correlation with each other (Table 2).
The correlation with and between the other inflam-
matory markers was moderate and ranged from
0.27 for sTNF-R1 and C-reactive protein to 0.45 for
interleukin-6 and C-reactive protein. The levels of
inflammatory markers were moderately inversely
associated with HDL cholesterol levels.
results
Copyright © 2004 Massachusetts Medical Society. All rights reserved.
Downloaded from www.nejm.org at RIKSHOSPITALET HF on February 18, 2008 .
n engl j med
351;25
www.nejm.org december
16
,
2004
The
new england journal
of
medicine
2602
* Data on women are from the Nurses’ Health Study and include eight years of follow-up, and data on men are from the
Health Professionals Follow-up Study and include six years of follow-up. Matching criteria were age, smoking status, and
date of blood sampling; among women, additional matching criteria included fasting status at the time of blood sam-
pling. Plus–minus values are means ±SD. To convert values for cholesterol to millimoles per liter, multiply by 0.02586. To
convert values for triglycerides to millimoles per liter, multiply by 0.01129. sTNF-R1 and sTNF-R2 denote soluble tumor
necrosis factor receptor types 1 and 2, CHD coronary heart disease, and MET-hr metabolic equivalent–hours. The body-
mass index is the weight in kilograms divided by the square of the height in meters.
†
P values for the difference between patients and controls (unadjusted) were determined by Student’s t-test for variables
expressed as means ±SD, by Wilcoxon’s rank-sum test for variables expressed as medians, and by the chi-square test for
variables expressed as percentages.
‡ Current aspirin use was defined as every one to four days for women and as two or more times per week for men.
§ The metabolic syndrome is defined by the presence of at least three of the following five abnormalities: a body-mass in-
dex of at least 25, a triglyceride level of at least 150 mg per deciliter (1.7 mmol per liter), an HDL cholesterol level of less
than 50 mg per deciliter for women or less than 40 mg per deciliter for men, a history of hypertension or a history of diabetes
or the development of diabetes during follow-up, or a glycosylated hemoglobin level of at least 7 percent at baseline.
¶Data on interleukin-6 levels were missing for 32 women.
Table 1. Baseline Characteristics of Women and Men in Whom Coronary Heart Disease Developed during Follow-up
and Matched Controls.*
Characteristic Women Men
Patients
(N=239)
Controls
(N=469) P Value
†
Patients
(N=265)
Controls
(N=529) P Value
†
Age (yr)
60.4±6.5 60.2±6.5 — 65.2±8.3 65.1±8.3 —
Current smoker (%) 31.4 31.8 — 12.4 11.5 —
Body-mass index 26.9±5.7 25.3±4.3 <0.001 26.2±3.5 25.7±3.5 0.05
Parental history of CHD before
60 yr of age (%)
21.3 12.4 0.002 15.1 11.0 0.10
Postmenopausal (%) 89.9 87.3 0.31 — — —
Postmenopausal hormone
therapy among postmeno-
pausal women (%)
31.7 41.0 0.03 — — —
Medications (%)
Aspirin
‡
15.1
21.3 0.05 39.1 34.9 0.25
Cholesterol-lowering drug 4.2 2.6 0.24 8.8 6.9 0.32
History of hypertension (%) 57.7 28.8 <0.001 42.3 30.6 0.001
History of diabetes (%) 19.7 6.4 <0.001 9.4 4.4 0.005
Metabolic syndrome (%)§ 43.9 18.3 <0.001 40.4 26.1 <0.001
Total fat intake (% of energy) 31.8±5.8 31.7±6.1 0.82 31.0±6.7 30.3±7.0 0.23
Saturated fat intake (% of energy) 10.8±2.5 10.7±2.7 0.84 10.4±2.7 10.1±2.9 0.12
Alcohol consumption (g/day)
Median 0.9 1.8 <0.001 5.5 7.0 0.11
Interquartile range 0.0–3.7 0.0–8.6 0.9–15.4 0.9–18.3
Physical activity (MET-hr/wk)
Median 11.0 11.5 0.26 22.8 27.3 0.06
Interquartile range 3.9–22.7 5.1–23.0 8.5–44.7 11.8–48.9
sTNF-R1 (pg/ml) 1438±585 1267±354 <0.001 1513±502 1506±541 0.86
sTNF-R2 (pg/ml) 2777±987 2489±710 <0.001 2991±869 2945±870 0.48
Interleukin-6 (pg/ml)¶
Median 1.99 1.65 0.001 1.86 1.53 0.01
Interquartile range 1.30–3.05 1.15–2.65 1.10–3.07 0.98–2.88
C-reactive protein (mg/liter)
Median 3.10 2.20 <0.001 1.68 1.08 <0.001
Interquartile range 1.30–7.50 1.00–5.10 0.76–3.15 0.52–2.38
Cholesterol (mg/dl)
Total 235.4±40.1 225.7±38.7 0.002 214.7±39.9 204.7±36.7 <0.001
LDL 142.9±34.1 132.2±36.4 <0.001 135.6±36.4 127.0±31.1 0.001
HDL 51.5±14.7 60.5±17.4 <0.001 42.1±11.3 45.9±12.5 <0.001
Total-to-HDL cholesterol ratio 4.91±1.55 4.02±1.31 <0.001 5.37±1.41 4.74±1.40 <0.001
Triglycerides (mg/dl) 157.6±96.7 126.3±76.3 <0.001 181.8±116.7 153.8±121.1 0.002
Copyright © 2004 Massachusetts Medical Society. All rights reserved.
Downloaded from www.nejm.org at RIKSHOSPITALET HF on February 18, 2008 .
n engl j med
351;25
www.nejm.org december
16, 2004
inflammatory markers and the risk of coronary heart disease in men and women
2603
main effects
After adjustment for matching factors, women in
the highest quintile of each inflammatory marker,
as compared with women in the lowest quintile, had
a significantly increased risk of coronary heart dis-
ease — by a factor of 1.95 to 2.57 — with signifi-
cant trends across quintiles (Table 3). After addi-
tional adjustment for the presence or absence of a
parental history of coronary heart disease before
the age of 60 years, alcohol intake, level of physical
activity, the ratio of total to HDL cholesterol, body-
mass index, and the use or nonuse of postmeno-
pausal hormone therapy, these associations were
attenuated and no longer significant, except for
C-reactive protein (model 2 in Table 3). Addition-
al adjustment for the presence or absence of diabe-
tes and hypertension, which are potentially in the
causal pathway, further reduced the association for
all inflammatory markers.
Among men, we did not find an association be-
tween the levels of soluble TNF-
a
receptors and
the risk of coronary heart disease (Table 3). Men in
the highest quintile of interleukin-6 had a 57 per-
cent increase in the risk of coronary heart disease,
as compared with men in the lowest quintile, after
adjustment for matching factors, although this as-
sociation was not significant and was further atten-
uated after multivariable adjustment. However, we
found a significant association between C-reactive
protein levels and the risk of coronary heart disease.
Multivariable adjustment and adjustment for the
presence or absence of hypertension and diabetes
* sTNF-R1 and sTNF-R2 denote soluble tumor necrosis factor receptor types 1 and 2, CRP C-reactive protein, TC total cho-
lesterol, LDL low-density lipoprotein cholesterol, HDL high-density lipoprotein cholesterol, and BMI body-mass index.
† Seventeen women were excluded from the analysis of interleukin-6 because they had missing values.
‡ P<0.001.
§ P<0.05.
¶P<0.01.
Table 2. Age-Adjusted Spearman Partial-Correlation Coefficients between Selected Cardiovascular Risk Factors
among 469 Control Women and 529 Control Men.*
Sex and
Risk Factor Risk Factor
sTNF-R1
sTNF-R2
Interleu-
kin-6† CRP TC LDL HDL TC:HDL BMI
Women
sTNF-R1
—
sTNF-R2 0.77‡ —
Interleukin-6 0.31‡ 0.28‡ —
CRP 0.29‡ 0.28‡ 0.44‡ —
TC ¡0.07 ¡0.09§ ¡0.05 0.03 —
LDL 0.02 <0.01 ¡0.03 0.04 0.87‡ —
HDL ¡0.30‡ ¡0.36‡ ¡0.15¶ ¡0.17‡ 0.08 ¡0.22‡ —
TC:HDL 0.22‡ 0.27‡ 0.09 0.15‡ 0.45‡ 0.67‡ ¡0.83‡ —
BMI 0.30‡ 0.27‡ 0.26‡ 0.37‡ 0.12§ 0.18‡ ¡0.33‡ 0.37‡ —
Men
sTNF-R1
—
sTNF-R2 0.67‡ —
Interleukin-6 0.32‡ 0.28‡ —
CRP 0.27‡ 0.28‡ 0.45‡ —
TC ¡0.16‡ ¡0.13‡ ¡0.17‡ 0.03 —
LDL ¡0.16‡ ¡0.11§ ¡0.16‡ ¡0.003 0.86‡ —
HDL ¡0.25‡ ¡0.21‡ ¡0.20‡ ¡0.24‡ 0.20‡ 0.13¶ —
TC:HDL 0.15‡ 0.12¶ 0.10§ 0.25‡ 0.39‡ 0.39‡ ¡0.80‡ —
BMI 0.16‡ 0.14‡ 0.23‡ 0.40‡ 0.04 0.01 ¡0.28‡ 0.31‡ —
Copyright © 2004 Massachusetts Medical Society. All rights reserved.
Downloaded from www.nejm.org at RIKSHOSPITALET HF on February 18, 2008 .
n engl j med
351;25
www.nejm.org december
16
,
2004
The
new england journal
of
medicine
2604
moderately attenuated this relationship; after ac-
counting for these variables, men in the highest
quintile of C-reactive protein, as compared with
those in the lowest quintile, had a relative risk of cor-
onary heart disease of 2.55 (95 percent confidence
interval, 1.40 to 4.65; P for trend=0.02).
For comparison, in the final multivariable-adjust-
ed model (including the presence or absence of di-
abetes and hypertension and C-reactive protein lev-
els), the relative risk of coronary heart disease for
the highest quintile of the ratio of total to HDL cho-
lesterol, as compared with the lowest quintile, was
4.33 (95 percent confidence interval, 2.11 to 8.90;
P for trend <0.001) in women and 3.29 (95 percent
confidence interval, 1.84 to 5.90; P for trend <0.001)
in men.
subgroup analyses
Overall, we found no significant interactions be-
tween various low and high cardiovascular risk
groups and the association of biomarkers with the
risk of coronary heart disease, although the associ-
ation of C-reactive protein was generally stronger in
low-risk subgroups. For example, in the multivari-
Table 3. Relative Risks of Coronary Heart Disease during Follow-up, According to the Quintile of Plasma Levels of Inflammatory Markers
at Baseline.*
Variable† Quintile of Plasma Level
P for
Trend‡
1
2 3 4 5
relative risk (95 percent confidence interval)
Women
sTNF-R1
Median — pg/ml
880 1083 1221 1379 1744
Quintile value — pg/ml <928 928–1146 1147–1296 1297–1508 ≥1509
Model 1 (matching factors) 1.0 1.21 (0.69 –2.11) 1.20 (0.68 –2.09) 1.56 (0.90 –2.70) 2.57 (1.50 –4.39) <0.001
Model 2 (multivariable) 1.0 1.08 (0.60 –1.97) 0.91 (0.50–1.67) 1.14 (0.63–2.08) 1.50 (0.82–2.74) 0.12
Model 3 (model 2+diabetes
and hypertension)
1.0 1.06 (0.57–1.97) 0.90 (0.48–1.69) 1.02 (0.54–1.90) 1.24 (0.66–2.34) 0.43
sTNF-R2
Median — pg/ml
1718 2060 2365 2724 3405
Quintile value — pg/ml <1892 1892–2223 2224–2549 2550–3019 ≥3020
Model 1 (matching factors) 1.0 1.72 (0.97–3.04) 1.92 (1.09–3.39) 2.19 (1.24–3.88) 2.51 (1.41–4.45) 0.003
Model 2 (multivariable) 1.0 1.39 (0.75–2.56) 1.48 (0.80–2.74) 1.41 (0.76–2.60) 1.36 (0.72–2.58) 0.59
Model 3 (model 2+diabetes
and hypertension)
1.0 1.40 (0.74–2.65) 1.38 (0.73–2.62) 1.30 (0.69–2.46) 1.20 (0.62–2.33) 0.96
Interleukin-6§
Median — pg/ml
0.82 1.23 1.65 2.37 4.15
Quintile value — pg/ml <1.08 1.08–1.44 1.45–1.91 1.92–2.91 ≥2.92
Model 1 (matching factors) 1.0 1.42 (0.81–2.51) 1.15 (0.65–2.05) 1.98 (1.16–3.40) 1.92 (1.11–3.31) 0.01
Model 2 (multivariable) 1.0 1.16 (0.63–2.13) 0.96 (0.51–1.79) 1.32 (0.72–2.40) 1.33 (0.73–2.43) 0.30
Model 3 (model 2+diabetes
and hypertension)
1.0 1.08 (0.58–2.03) 0.81 (0.42–1.55) 1.01 (0.54–1.89) 1.05 (0.56–1.97) 0.79
C-reactive protein
Median — mg/liter
0.50 1.18 2.20 4.02 9.14
Quintile value — mg/liter <0.80 0.80–1.70 1.71–2.91 2.92–5.96 ≥5.97
Model 1 (matching factors) 1.0 1.28 (0.74–2.23) 1.03 (0.59–1.81) 1.54 (0.91–2.63) 2.18 (1.30–3.64) <0.001
Model 2 (multivariable) 1.0 1.17 (0.64–2.14) 0.81 (0.43–1.52) 1.17 (0.64–2.14) 1.86 (1.00–3.46) 0.008
Model 3 (model 2+diabetes
and hypertension)
1.0 1.23 (0.66–2.32) 0.89 (0.46–1.72) 1.22 (0.65–2.30) 1.61 (0.84–3.07) 0.08
Copyright © 2004 Massachusetts Medical Society. All rights reserved.
Downloaded from www.nejm.org at RIKSHOSPITALET HF on February 18, 2008 .
n engl j med
351;25
www.nejm.org december
16, 2004
inflammatory markers and the risk of coronary heart disease in men and women
2605
able-adjusted model (excluding the presence or ab-
sence of hypertension and diabetes), the relative risk
in the highest as compared with the lowest quintile
of C-reactive protein was 2.53 among women with
a body-mass index of less than 25 (95 percent con-
fidence interval, 1.04 to 6.18; P for trend=0.02) and
6.25 among men with a body-mass index of less
than 25 (95 percent confidence interval, 2.28 to 17.1;
P for trend=0.005). Similarly, among participants
with LDL cholesterol levels of less than 130 mg per
* The group of women included 239 patients and 469 controls with eight years of follow-up. The group of men included 265 patients and 529
controls with six years of follow-up. sTNF denotes soluble tumor necrosis factor receptor. Quintiles and median values of plasma inflamma-
tory markers are based on values in controls. For each relative risk, quintile 1 served as the reference group.
† Model 1 was adjusted for matching factors (age, smoking status, and the month of blood sampling). Among women, data were also adjusted
for fasting status at the time of blood sampling. Model 2 was adjusted for matching factors, presence or absence of a parental history of cor-
onary heart disease before the age of 60 years, alcohol intake, level of physical activity, ratio of total cholesterol to HDL cholesterol, and body-
mass index. Among women, the multivariable model was also adjusted for the use or nonuse of postmenopausal hormone therapy.
‡ P values for trend are based on the median levels of inflammatory markers in quintiles of the controls.
§ A total of 32 women were excluded from the analyses for interleukin-6 owing to missing values for interleukin; 224 patients and 452 controls
were analyzed.
Table 3. (Continued.)
Variable† Quintile of Plasma Level
P for
Trend‡
1
2 3 4 5
relative risk (95 percent confidence interval)
Men
sTNF-R1
Median — pg/ml
1005 1205 1391 1627 2124
Quintile value — pg/ml <1111 1111–1301 1302–1510 1511–1793 ≥1794
Model 1 (matching factors) 1.0 1.01 (0.63–1.63) 1.13 (0.70–1.82) 0.96 (0.58–1.57) 1.06 (0.64–1.77) 0.90
Model 2 (multivariable) 1.0 0.95 (0.57–1.58) 1.00 (0.60–1.65) 0.84 (0.49–1.42) 0.85 (0.49–1.46) 0.48
Model 3 (model 2+diabetes
and hypertension)
1.0 0.94 (0.56–1.56) 0.99 (0.60–1.65) 0.82 (0.48–1.40) 0.78 (0.45–1.36) 0.32
sTNF-R2
Median — pg/ml
1969 2421 2812 3209 4090
Quintile value — pg/ml <2242 2242–2614 2615–2966 2967–3564 ≥3565
Model 1 (matching factors) 1.0 0.80 (0.49–1.31) 0.90 (0.55–1.47) 1.12 (0.69–1.82) 1.12 (0.68–1.86) 0.33
Model 2 (multivariable) 1.0 0.68 (0.40–1.15) 0.81 (0.48–1.36) 0.94 (0.56–1.57) 0.91 (0.54–1.56) 0.78
Model 3 (model 2+diabetes
and hypertension)
1.0 0.72 (0.42–1.21) 0.81 (0.48–1.37) 0.98 (0.59–1.65) 0.92 (0.53–1.58) 0.80
Interleukin-6
Median — pg/ml
0.69 1.09 1.53 2.43 5.73
Quintile value — pg/ml <0.88 0.88–1.29 1.30–1.89 1.90–3.15 ≥3.16
Model 1 (matching factors) 1.0 1.09 (0.66–1.81) 1.19 (0.72–1.98) 1.52 (0.93–2.48) 1.57 (0.95–2.57) 0.06
Model 2 (multivariable) 1.0 0.94 (0.55–1.60) 0.99 (0.59–1.69) 1.25 (0.74–2.10) 1.31 (0.78–2.21) 0.17
Model 3 (model 2+diabetes
and hypertension)
1.0 0.97 (0.57–1.65) 0.98 (0.58–1.68) 1.24 (0.73–2.09) 1.31 (0.77–2.22) 0.19
C-reactive protein
Median — mg/liter
0.27 0.60 1.08 2.05 5.24
Quintile value — mg/liter <0.44 0.44–0.80 0.81–1.49 1.50–2.78 ≥2.79
Model 1 (matching factors) 1.0 1.81 (1.04–3.17) 2.00 (1.15–3.50) 2.74 (1.59–4.71) 3.29 (1.91–5.65) <0.001
Model 2 (multivariable) 1.0 1.75 (0.97–3.14) 1.83 (1.02–3.30) 2.27 (1.26–4.09) 2.73 (1.51–4.96) 0.007
Model 3 (model 2+diabetes
and hypertension)
1.0 1.75 (0.97–3.16) 1.74 (0.96–3.15) 2.14 (1.18–3.88) 2.55 (1.40–4.65) 0.02
Copyright © 2004 Massachusetts Medical Society. All rights reserved.
Downloaded from www.nejm.org at RIKSHOSPITALET HF on February 18, 2008 .
n engl j med
351;25
www.nejm.org december
16
,
2004
The
new england journal
of
medicine
2606
deciliter (3.4 mmol per liter), the corresponding rel-
ative risks were 3.54 (95 percent confidence inter-
val, 1.19 to 10.5; P for trend=0.01) for women and
2.52 (95 percent confidence interval, 1.09 to 5.83;
P for trend= 0.04) for men. Among participants
without hypertension, the corresponding relative
risks were 1.87 (95 percent confidence interval,
0.77 to 4.56; P for trend=0.02) for women and 3.01
(95 percent confidence interval, 1.41 to 6.44; P for
trend=0.02) for men.
clinical cutoff points for c-reactive
protein
We further categorized the study participants, on
the basis of recently proposed cutoff points for
C-reactive protein, as having low levels (less than
1.0 mg per liter), moderate levels (1.0 to 2.9 mg per
liter), and high levels (at least 3.0 mg per liter).
25
In these analyses, participants with high levels of
C-reactive protein, as compared with those with low
levels, had a relative risk of coronary heart disease
of approximately 1.8 after adjustment for covari-
ates (including body-mass index and lipid levels)
(Table 4). When we pooled the risk estimates for
men and women, the final multivariable-adjusted
relative risk (including adjustment for the presence
or absence of diabetes and hypertension) was 1.68
in the group with high levels of C-reactive protein,
as compared with the group with low levels (95 per-
cent confidence interval, 1.18 to 2.38; P for trend=
0.008) (Table 4). This is similar to the pooled esti-
mate (relative risk, 1.48; 95 percent confidence
interval, 1.08 to 2.04; P for trend=0.03) after we
controlled for covariates from the Framingham risk
score,
26
including age, presence or absence of hy-
pertension and diabetes, ratio of total to HDL cho-
lesterol, and smoking status.
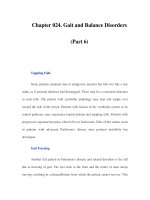
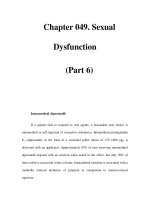
We found a gradient of risk of coronary heart
disease within each increasing category of C-reac-
tive protein and ratio of total to HDL cholesterol
(Fig. 1). This finding supports the hypothesis that
the levels of C-reactive protein may predict risk be-
yond the information afforded by lipid levels. How-
ever, despite the independent associations, the gra-
dient of risk associated with lipid levels was greater
than that for C-reactive protein levels.
additional analyses
When we stratified our analysis according to the
time to an event in two-year intervals, the relative
risk of coronary heart disease associated with
C-reactive protein levels remained relatively stable
over time (data not shown). When we repeated our
main analyses after excluding participants with
C-reactive protein levels of at least 10.0 mg per liter,
we found essentially the same results. C-reactive
protein levels may be affected by hormone therapy.
10
However, results were similar when we used quin-
tiles of C-reactive protein based on levels in women
in the control group who reported never using hor-
mones.
In these two nested case–control studies, we found
that high plasma levels of C-reactive protein were
associated with an increased risk of coronary heart
disease among women and men without previous
cardiovascular disease. Elevated plasma levels of
sTNF-R1 and sTNF-R2 were related to an increased
risk among women, but not men. We found only a
moderate suggestion of increased risk associated
with elevated levels of interleukin-6. For all mark-
ers, associations were substantially attenuated and
— with the exception of C-reactive protein — no
longer significant after adjustment for cardiovas-
cular risk factors, particularly body-mass index and
the presence or absence of diabetes and hyperten-
sion. These findings are consistent with a role of
these inflammatory markers in the elevated risk of
cardiovascular events that is associated with type 2
diabetes and hypertension.
TNF-
a
and interleukin-6 are the main inducers
of hepatic production of acute-phase proteins, in-
cluding C-reactive protein.
3
These inflammatory
markers are associated with biologic and environ-
mental risk factors for cardiovascular events, includ-
ing components of the metabolic syndrome (obe-
sity, insulin resistance, diabetes, hypertension, and
low HDL cholesterol levels), and lifestyle factors,
such as smoking, abstinence from alcohol, and
physical inactivity.
27-29
Compelling evidence suggests that inflamma-
tion causally contributes to several precursors of car-
diovascular disease. TNF-
a
and interleukin-6 can
cause insulin resistance in animal models, and plas-
ma levels of C-reactive protein and interleukin-6
have been shown to predict type 2 diabetes in hu-
mans.
30,31
The increased cytokine synthesis in obe-
sity may promote insulin resistance and impaired
glucose uptake, type 2 diabetes, and ultimately, cor-
onary heart disease.
30
In line with these hypothe-
ses, we found that plasma levels of interleukin-6
and C-reactive protein, in particular, were related to
discussion
Copyright © 2004 Massachusetts Medical Society. All rights reserved.
Downloaded from www.nejm.org at RIKSHOSPITALET HF on February 18, 2008 .
n engl j med
351;25
www.nejm.org december
16, 2004
inflammatory markers and the risk of coronary heart disease in men and women
2607
the risk of coronary heart disease and that the risks
were attenuated after adjustment for the presence
or absence of diabetes and hypertension.
TNF-
a
has a limited half-life and is difficult to
measure in large-scale epidemiologic studies.
5,6
In
a nested case–control study, Ridker et al. reported a
multivariable-adjusted relative risk of recurrent cor-
onary events of 2.5 (95 percent confidence interval,
1.3 to 5.1) among men whose TNF-
a
levels exceed-
ed the 95th percentile, as compared with men with
lower levels.
32
Cesari et al. reported a relative risk of
of coronary events of 1.79 (95 percent confidence
interval, 1.18 to 2.71) among elderly participants
without cardiovascular disease who had the high-
est of three levels of TNF-
a
, as compared with
those who had the lowest levels.
8
The value of as-
* Data on women are from the Nurses’ Health Study and include eight years of follow-up, and data on men are from the
Health Professionals Follow-up Study and include six years of follow-up. The subjects with the lowest level of C-reactive
protein (CRP) served as the reference group. TC:HDL denotes the ratio of total cholesterol to high-density lipoprotein
cholesterol.
† Model 1 was adjusted for matching factors (age, smoking status, and month of blood sampling); data for women were
also adjusted for fasting status at the time of blood sampling. Model 2 was adjusted for matching factors, as well as the
presence or absence of a parental history of coronary heart disease before the age of 60 years, alcohol intake, level of
physical activity, and use or nonuse of hormone therapy among postmenopausal women. Model 5 was adjusted for ev-
erything listed in model 4 as well as the presence or absence of diabetes and hypertension.
‡ P values for trend are based on median levels in the three C-reactive protein groups in the controls.
Table 4. Relative Risks of Coronary Heart Disease during Follow-up According to the Baseline Level of C-Reactive
Protein.*
Variable† CRP <1.0 mg/liter CRP 1.0–2.9 mg/liter CRP ≥3.0 mg/liter P for Trend‡
relative risk (95 percent confidence interval)
Women
No. of patients
41 73 125
No. of controls 114 170 185
Model 1 (matching factors) 1.0 1.22 (0.77–1.93) 1.93 (1.25–2.99) <0.001
Model 2 (multivariable) 1.0 1.21 (0.75–1.96) 1.94 (1.21–3.10) 0.002
Model 3 (model 2+body-mass
index)
1.0 1.16 (0.71–1.90) 1.71 (1.04–2.80) 0.02
Model 4 (model 3+TC:HDL) 1.0 1.09 (0.66–1.82) 1.64 (0.98–2.75) 0.02
Model 5 (model 4+diabetes and hy-
pertension)
1.0 1.17 (0.69–2.00) 1.53 (0.89–2.62) 0.09
Men
No. of patients
86 108 71
No. of controls 254 175 100
Model 1 (matching factors) 1.0 1.90 (1.34–2.71) 2.20 (1.46–3.32) <0.001
Model 2 (multivariable) 1.0 1.88 (1.31–2.69) 2.17 (1.43–3.31) 0.002
Model 3 (model 2+body-mass
index)
1.0 1.85 (1.28 –2.68) 2.08 (1.34–3.23) 0.006
Model 4 (model 3+TC:HDL) 1.0 1.71 (1.17–2.49) 1.91 (1.22–3.00) 0.02
Model 5 (model 4+diabetes and hy-
pertension)
1.0 1.60 (1.09–2.34) 1.79 (1.14–2.83) 0.03
Men and Women
Model 1 (matching factors)
1.0 1.61 (1.22–2.14) 2.07 (1.54–2.79) <0.001
Model 2 (multivariable) 1.0 1.61 (1.20–2.14) 2.06 (1.51–2.82) <0.001
Model 3 (model 2+body-mass
index)
1.0 1.57 (1.17–2.11) 1.90 (1.37–2.65) <0.001
Model 4 (model 3+TC:HDL) 1.0 1.46 (1.08–1.98) 1.79 (1.27–2.51) <0.001
Model 5 (model 4+diabetes and hy-
pertension)
1.0 1.44 (1.05–1.96) 1.68 (1.18–2.38) 0.008
Copyright © 2004 Massachusetts Medical Society. All rights reserved.
Downloaded from www.nejm.org at RIKSHOSPITALET HF on February 18, 2008 .
n engl j med
351;25
www.nejm.org december
16
,
2004
The
new england journal
of
medicine
2608
sessing circulating levels of TNF-
a
is unknown,
since such levels can be very low and unstable. The
levels of soluble TNF-
a
receptors may be more sta-
ble and may better reflect longer-term average cir-
culating levels of TNF-
a
, although data on the role
of soluble TNF-
a
receptors in coronary heart dis-
ease are scarce.
7,33
It is unclear why we found a dif-
ference in risk between men and women associat-
ed with elevated levels of soluble TNF-
a
receptors;
however, others also have found differences be-
tween women and men with respect to lipids
34
and
in the overall prediction of risk.
35
Similarly, mech-
anisms of insulin sensitivity, rather than inflamma-
tion, may contribute more to the risk of coronary
heart disease in women than men.
Findings of an association between interleukin-
6 levels and the risk of coronary heart disease have
been inconsistent.
8,10,36
In our study, this associa-
tion was substantially reduced and no longer sig-
nificant after multivariable adjustment.
C-reactive protein is the most extensively stud-
ied inflammatory marker in prospective settings.
In an early meta-analysis of 11 prospective studies,
the relative risk of coronary heart disease in subjects
with the highest of three C-reactive protein levels, as
compared with those with the lowest levels, was 2.0
(95 percent confidence interval, 1.6 to 2.5) among
population-based studies.
37
Eleven other prospec-
tive studies have since been published. In an updat-
ed meta-analysis, Danesh et al. reported an overall
odds ratio of 1.58 (95 percent confidence interval,
1.48 to 1.68) among subjects with the highest of
three levels of C-reactive protein, as compared with
subjects with the lowest level.
16
This risk estimate
is similar to that in our comparisons of C-reactive
protein levels of at least 3.0 mg per liter with those
of less than 1.0 mg per liter. However, the degree of
adjustment for traditional cardiovascular risk fac-
tors differed markedly among the studies included
in the meta-analysis.
An important question is whether knowing the
level of C-reactive protein adds materially to risk
prediction. In the Women’s Health Study, Ridker
et al. reported that the level of C-reactive protein was
a stronger predictor than the LDL cholesterol level
and that it added to the information provided by the
Framingham risk score.
12,38
Comparing C-reactive
protein levels of at least 3.0 mg per liter with those
of less than 1.0 mg per liter, they reported a relative
risk of 1.5 (95 percent confidence interval, 1.2 to
1.9) after adjustment for the Framingham risk score
and the presence or absence of diabetes.
38
In the Atherosclerosis Risk in Communities
Study, Ballantyne et al. reported a relative risk of
coronary heart disease of 1.72 (95 percent confi-
dence interval, 1.24 to 2.39) among subjects with a
C-reactive protein level of at least 3.0 mg per liter,
as compared with subjects with a level of less than
1.0 mg per liter (adjusted for components of the Fra-
mingham risk score, including the presence or ab-
Figure 1. Multivariable-Adjusted Relative Risk of Coronary Heart Disease
among Women (Panel A) and Men (Panel B), According to the Baseline
Level of C-Reactive Protein (CRP) and the Quintile of the Ratio of Total
to HDL Cholesterol.
Data on women are from the Nurses’ Health Study and include eight years
of follow-up, and data on men are from the Health Professionals Follow-up
Study and include six years of follow-up. The model was adjusted for age,
smoking status, date of blood sampling, presence or absence of a parental
history of coronary heart disease before the age of 60 years, alcohol intake,
level of physical activity, and body-mass index. Among women, the multivari-
able model was also adjusted for fasting status at the time of blood sampling
and the use or nonuse of postmenopausal hormone therapy. In each panel,
the subjects in quintile 1 who had a CRP level of less than 1.0 mg per liter
served as the reference group.
Relative Risk of Coronary
Heart Disease
12.0
14.0
10.0
8.0
4.0
2.0
6.0
0.0
1 2 3 4 5
Quintile of Total:HDL Cholesterol
16.0
Relative Risk of Coronary
Heart Disease
12.0
14.0
10.0
8.0
4.0
2.0
6.0
0.0
1 2 3 4 5
Quintile of Total:HDL Cholesterol
16.0
A
B
≥3.0 mg of CRP/liter
1.0–2.9 mg of CRP/liter
<1.0 mg of CRP/liter
Women
Men
Copyright © 2004 Massachusetts Medical Society. All rights reserved.
Downloaded from www.nejm.org at RIKSHOSPITALET HF on February 18, 2008 .
n engl j med
351;25 www.nejm.org december 16, 2004
inflammatory markers and the risk of coronary heart disease in men and women
2609
sence of diabetes).
14
In the Monitoring Trends and
Determinants in Cardiovascular Disease (MONICA)
study, comparing C-reactive protein levels of at
least 3.0 mg per liter with those of less than 1.0 mg
per liter, Koenig et al. reported a hazard ratio of
2.21 (95 percent confidence interval, 1.49 to 3.27),
adjusted for the Framingham risk score.
13
In con-
trast, in the Rotterdam Study, measuring the level of
C-reactive protein did not improve the prediction
of coronary events beyond that afforded by the Fra-
mingham risk score, with an odds ratio of 1.2 (95
percent confidence interval, 0.6 to 2.2) among par-
ticipants in the highest quartile of C-reactive protein,
as compared with those in the lowest quartile.
39
In our analysis, the pooled relative risk among
men and women classified according to clinical cut-
off points for the levels of C-reactive protein was
1.48 (95 percent confidence interval, 1.08 to 2.04;
P for trend=0.03) after we accounted for covariates
in the Framingham risk score, including the pres-
ence or absence of diabetes. Our results are similar
to those of Ridker et al.
38
and Ballantyne et al.,
14
as
well as those of the recent meta-analysis by Danesh
et al.,
16
a fact that suggests that after adjustment
for the Framingham risk score, the relative risk as-
sociated with a clinical cutoff point of at least 3.0
mg per liter, as compared with a cutoff of less than
1.0 mg per liter, is probably moderately less than
previously suggested in the guidelines for the clin-
ical assessment of inflammatory markers issued by
the American Heart Association and the Centers for
Disease Control and Prevention (relative risk, 1.5 vs.
approximately 2.0).
25
Nevertheless, our findings
support the theory that the level of C-reactive pro-
tein provides an additional measure of the risk of
coronary heart disease beyond that afforded by the
Framingham risk score.
Our study has some limitations. As with any
observational study design, there is the possibility
of unmeasured confounding. However, we con-
trolled for most known cardiovascular risk factors.
Though we obtained only a single blood sample at
baseline, previous studies have shown the levels of
biomarkers to be relatively stable over time.
22,23
Since the ranges of anthropometric variables in our
cohorts were quite broad, the biologic relationships
found should be widely generalizable. Though we
excluded men and women with missing data on
blood levels, generalizability should be minimally
affected because the participants were similar to
those who did not provide blood samples.
Although the Framingham risk score is a tool for
estimating the 10-year risk of coronary heart disease
among healthy subjects,
26
it does not include other
well-established risk factors, such as body-mass in-
dex, alcohol intake, level of physical activity, or the
presence or absence of a parental history of coro-
nary heart disease.
40
Therefore, to examine the role
of inflammatory markers in coronary heart disease,
we used an etiologic approach in our main analyses,
to take into account the pathophysiology of coro-
nary heart disease and include the major cardiovas-
cular risk factors, beyond those included in the Fra-
mingham risk score, for comparison.
Our questionnaires did not include questions on
the use of hydroxymethylglutarylcoenzyme A reduc-
tase inhibitors (statins) because these drugs were
not widely used at time of blood sampling. Howev-
er, the reported use of cholesterol-lowering drugs
was generally low in both cohorts.
In conclusion, our findings suggest that high
levels of C-reactive protein are associated with an in-
creased risk of coronary heart disease among men
and women and that the level of C-reactive protein
is a significant marker of the risk of coronary heart
disease, even after careful multivariable adjustment.
Though all other associations were attenuated after
multivariable adjustment, high levels of sTNF-R1
and sTNF-R2 may be also associated with an in-
creased risk and deserve further exploration in other
populations. From a clinical standpoint, although
the ratio of total to HDL cholesterol was more
strongly associated with the risk of coronary heart
disease than were the levels of inflammatory mark-
ers, the level of C-reactive protein was still a signif-
icant contributor to the prediction of coronary heart
disease.
Supported by grants (HL35464, CA55075, AA11181, and
HL34594) from the National Institutes of Health and by a grant
from Merck Research Laboratories. Dr. Pischon is a Jetson Lincoln
fellow, supported in part by an unrestricted gift from Mr. Lincoln.
Ms. Pai is supported by an institutional training grant (HL07575)
from the National Heart, Lung, and Blood Institute.
Dr. Cannuscio was an employee of Merck at the time the research
was conducted. Dr. Manson is listed as a coinventor of a patent filed
by Brigham and Women’s Hospital related to inflammatory mark-
ers and diabetes mellitus. Dr. Rimm reports having received grant
support from Merck.
We are indebted to Alan Paciorek, Helena Ellis, and Jeanne Spar-
row for coordinating the collection of samples and for laboratory
management, and to Lydia Liu for programming review.
Copyright © 2004 Massachusetts Medical Society. All rights reserved.
Downloaded from www.nejm.org at RIKSHOSPITALET HF on February 18, 2008 .
n engl j med 351;25 www.nejm.org december 16, 2004
2610
inflammatory markers and the risk of coronary heart disease in men and women
references
1. Libby P. Inflammation in atherosclero-
sis. Nature 2002;420:868-74.
2. Pradhan AD, Ridker PM. Do atheroscle-
rosis and type 2 diabetes share a common
inflammatory basis? Eur Heart J 2002;23:
831-4.
3. Yudkin JS, Kumari M, Humphries SE,
Mohamed-Ali V. Inflammation, obesity,
stress and coronary heart disease: is inter-
leukin-6 the link? Atherosclerosis 2000;148:
209-14.
4. Blake GJ, Ridker PM. Inflammatory bio-
markers and cardiovascular risk prediction.
J Intern Med 2002;252:283-94.
5. Diez-Ruiz A, Tilz GP, Zangerle R, Baier-
Bitterlich G, Wachter H, Fuchs D. Soluble
receptors for tumour necrosis factor in clin-
ical laboratory diagnosis. Eur J Haematol
1995;54:1-8.
6. Aderka D. The potential biological and
clinical significance of the soluble tumor ne-
crosis factor receptors. Cytokine Growth
Factor Rev 1996;7:231-40.
7. Benjafield AV, Wang XL, Morris BJ.
Tumor necrosis factor receptor 2 gene
(TNFRSF1B) in genetic basis of coronary ar-
tery disease. J Mol Med 2001;79:109-15.
8. Cesari M, Penninx BW, Newman AB, et
al. Inflammatory markers and onset of car-
diovascular events: results from the Health
ABC study. Circulation 2003;108:2317-22.
9. Ridker PM, Hennekens CH, Buring JE,
Rifai N. C-reactive protein and other mark-
ers of inflammation in the prediction of car-
diovascular disease in women. N Engl J Med
2000;342:836-43.
10. Pradhan AD, Manson JE, Rossouw JE, et
al. Inflammatory biomarkers, hormone re-
placement therapy, and incident coronary
heart disease: prospective analysis from the
Women’s Health Initiative observational
study. JAMA 2002;288:980-7.
11. Ridker PM, Cushman M, Stampfer MJ,
Tracy RP, Hennekens CH. Inflammation, as-
pirin, and the risk of cardiovascular disease
in apparently healthy men. N Engl J Med
1997;336:973-9. [Erratum, N Engl J Med
1997;337:356.]
12. Ridker PM, Rifai N, Rose L, Buring JE,
Cook NR. Comparison of C-reactive protein
and low-density lipoprotein cholesterol lev-
els in the prediction of first cardiovascular
events. N Engl J Med 2002;347:1557-65.
13. Koenig W, Lowel H, Baumert J, Meis-
inger C. C-reactive protein modulates risk
prediction based on the Framingham Score:
implications for future risk assessment: re-
sults from a large cohort study in southern
Germany. Circulation 2004;109:1349-53.
14. Ballantyne CM, Hoogeveen RC, Bang H,
et al. Lipoprotein-associated phospholipase
A2, high-sensitivity C-reactive protein, and
risk for incident coronary heart disease in
middle-aged men and women in the Athero-
sclerosis Risk in Communities (ARIC) study.
Circulation 2004;109:837-42.
15. Packard CJ, O’Reilly DS, Caslake MJ, et
al. Lipoprotein-associated phospholipase A2
as an independent predictor of coronary
heart disease: West of Scotland Coronary
Prevention Study Group. N Engl J Med 2000;
343:1148-55.
16. Danesh J, Wheeler JG, Hirschfield GM,
et al. C-reactive protein and other circulat-
ing markers of inflammation in the predic-
tion of coronary heart disease. N Engl J Med
2004;350:1387-97.
17. Hackam DG, Anand SS. Emerging risk
factors for atherosclerotic vascular disease:
a critical review of the evidence. JAMA 2003;
290:932-40.
18. Rimm EB, Giovannucci EL, Stampfer MJ,
Colditz GA, Litin LB, Willett WC. Reproduc-
ibility and validity of an expanded self-admin-
istered semiquantitative food frequency
questionnaire among male health profes-
sionals. Am J Epidemiol 1992;135:1114-26.
19. Colditz GA, Manson JE, Hankinson SE.
The Nurses’ Health Study: 20-year contribu-
tion to the understanding of health among
women. J Womens Health 1997;6:49-62.
20. Prentice RL, Breslow NE. Retrospective
studies and failure time models. Biometrika
1978;65:153-8.
21. Willett W, Lenart E. Reproducibility and
validity of food-frequency questionnaires.
In: Willett W, ed. Nutritional epidemiology.
New York: Oxford University Press, 1998:
101-47.
22. Pai JK, Curhan GC, Cannuscio CC, Rifai
N, Ridker PM, Rimm EB. Stability of novel
plasma markers associated with cardiovas-
cular disease: processing within 36 hours of
specimen collection. Clin Chem 2002;48:
1781-4.
23. Pischon T, Hankinson SE, Hotamisligil
GS, Rifai N, Willett WC, Rimm EB. Habitual
dietary intake of n-3 and n-6 fatty acids in re-
lation to inflammatory markers among US
men and women. Circulation 2003;108:155-
60.
24. Takkouche B, Cadarso-Suarez C,
Spiegelman D. Evaluation of old and new
tests of heterogeneity in epidemiologic meta-
analysis. Am J Epidemiol 1999;150:206-15.
25. Pearson TA, Mensah GA, Alexander RW,
et al. Markers of inflammation and cardio-
vascular disease: application to clinical and
public health practice: a statement for health-
care professionals from the Centers for Dis-
ease Control and Prevention and the Ameri-
can Heart Association. Circulation 2003;
107:499-511.
26. Wilson PW, D’Agostino RB, Levy D, Be-
langer AM, Silbershatz H, Kannel WB. Pre-
diction of coronary heart disease using risk
factor categories. Circulation 1998;97:1837-
47.
27. Ridker PM, Buring JE, Cook NR, Rifai N.
C-reactive protein, the metabolic syndrome,
and risk of incident cardiovascular events: an
8-year follow-up of 14 719 initially healthy
American women. Circulation 2003;107:
391-7.
28. Pischon T, Hankinson SE, Hotamisligil
GS, Rifai N, Rimm EB. Leisure-time physi-
cal activity and reduced plasma levels of obe-
sity-related inflammatory markers. Obes Res
2003;11:1055-64.
29. Imhof A, Froehlich M, Brenner H, Boe-
ing H, Pepys MB, Koenig W. Effect of alco-
hol consumption on systemic markers of in-
flammation. Lancet 2001;357:763-7.
30. Pradhan AD, Manson JE, Rifai N, Buring
JE, Ridker PM. C-reactive protein, interleu-
kin 6, and risk of developing type 2 diabetes
mellitus. JAMA 2001;286:327-34.
31. Hotamisligil GS. The role of TNFalpha
and TNF receptors in obesity and insulin re-
sistance. J Intern Med 1999;245:621-5.
32. Ridker PM, Rifai N, Pfeffer M, Sacks F,
Lepage S, Braunwald E. Elevation of tumor
necrosis factor-alpha and increased risk of
recurrent coronary events after myocardial
infarction. Circulation 2000;101:2149-53.
33. Cesari M, Penninx BW, Newman AB, et
al. Inflammatory markers and cardiovascular
disease (The Health, Aging and Body Com-
position [Health ABC] Study). Am J Cardiol
2003;92:522-8.
34. Richey Sharrett A, Coady SA, Folsom
AR, Couper DJ, Heiss G. Smoking and dia-
betes differ in their associations with sub-
clinical atherosclerosis and coronary heart
disease — the ARIC Study. Atherosclerosis
2004;172:143-9.
35. Jousilahti P, Vartiainen E, Tuomilehto J,
Puska P. Sex, age, cardiovascular risk fac-
tors, and coronary heart disease: a prospec-
tive follow-up study of 14 786 middle-aged
men and women in Finland. Circulation
1999;99:1165-72.
36. Ridker PM, Rifai N, Stampfer MJ, Hen-
nekens CH. Plasma concentration of inter-
leukin-6 and the risk of future myocardial
infarction among apparently healthy men.
Circulation 2000;101:1767-72.
37. Danesh J, Whincup P, Walker M, et al.
Low grade inflammation and coronary heart
disease: prospective study and updated meta-
analyses. BMJ 2000;321:199-204.
38. Ridker PM, Cook N. Clinical usefulness
of very high and very low levels of C-reactive
protein across the full range of Framingham
Risk Scores. Circulation 2004;109:1955-9.
39. van der Meer IM, de Maat MP, Kiliaan
AJ, van der Kuip DA, Hofman A, Witteman
JC. The value of C-reactive protein in cardio-
vascular risk prediction: the Rotterdam Study.
Arch Intern Med 2003;163:1323-8.
40. Pearson TA, Blair SN, Daniels SR, et al.
AHA guidelines for primary prevention of
cardiovascular disease and stroke: 2002 up-
date: Consensus Panel guide to comprehen-
sive risk reduction for adult patients without
coronary or other atherosclerotic vascular
diseases. Circulation 2002;106:388-91.
Copyright © 2004 Massachusetts Medical Society.
Copyright © 2004 Massachusetts Medical Society. All rights reserved.
Downloaded from www.nejm.org at RIKSHOSPITALET HF on February 18, 2008 .
n engl j med
352;14
www.nejm.org april
7, 2005
The
new england journal
of
medicine
1425
original article
Intensive Lipid Lowering with Atorvastatin
in Patients with Stable Coronary Disease
John C. LaRosa, M.D., Scott M. Grundy, M.D., Ph.D.,
David D. Waters, M.D., Charles Shear, Ph.D., Philip Barter, M.D., Ph.D.,
Jean-Charles Fruchart, Pharm.D., Ph.D., Antonio M. Gotto, M.D., D.Phil.,
Heiner Greten, M.D., John J.P. Kastelein, M.D., James Shepherd, M.D.,
and Nanette K. Wenger, M.D., for the Treating to New Targets (TNT) Investigators*
From the State University of New York
Health Science Center, Brooklyn (J.C.L.); the
University of Texas Southwestern Medical
Center, Dallas (S.M.G.); San Francisco Gen-
eral Hospital, San Francisco (D.D.W.); Pfizer,
Groton, Conn. (C.S.); the Heart Research In-
stitute, Sydney (P.B.); Institut Pasteur, Lille,
France (J C.F.); Weill Medical College of
Cornell University, New York (A.M.G.); Uni-
versitätsklinikum Eppendorf, Hamburg,
Germany (H.G.); Academic Medical Cen-
ter, University of Amsterdam, Amsterdam
(J.J.P.K.); the University of Glasgow, Glas-
gow, United Kingdom (J.S.); and Emory Uni-
versity School of Medicine, Atlanta (N.K.W.).
Address reprint requests to Dr. LaRosa at
the State University of New York Health
Science Center, 450 Clarkson Ave., Brooklyn,
NY 11203, or at
*Participants in the TNT Study are listed
in the Appendix.
This article was published at www.nejm.
org on March 8, 2005.
N Engl J Med 2005;352:1425-35.
Copyright © 2005 Massachusetts Medical Society.
background
Previous trials have demonstrated that lowering low-density lipoprotein (LDL) choles-
terol levels below currently recommended levels is beneficial in patients with acute cor-
onary syndromes. We prospectively assessed the efficacy and safety of lowering LDL
cholesterol levels below 100 mg per deciliter (2.6 mmol per liter) in patients with stable
coronary heart disease (CHD).
methods
A total of 10,001 patients with clinically evident CHD and LDL cholesterol levels of less
than 130 mg per deciliter (3.4 mmol per liter) were randomly assigned to double-blind
therapy and received either 10 mg or 80 mg of atorvastatin per day. Patients were fol-
lowed for a median of 4.9 years. The primary end point was the occurrence of a first
major cardiovascular event, defined as death from CHD, nonfatal non–procedure-relat-
ed myocardial infarction, resuscitation after cardiac arrest, or fatal or nonfatal stroke.
results
The mean LDL cholesterol levels were 77 mg per deciliter (2.0 mmol per liter) during
treatment with 80 mg of atorvastatin and 101 mg per deciliter (2.6 mmol per liter) dur-
ing treatment with 10 mg of atorvastatin. The incidence of persistent elevations in liver
aminotransferase levels was 0.2 percent in the group given 10 mg of atorvastatin and
1.2 percent in the group given 80 mg of atorvastatin (P<0.001). A primary event oc-
curred in 434 patients (8.7 percent) receiving 80 mg of atorvastatin, as compared with
548 patients (10.9 percent) receiving 10 mg of atorvastatin, representing an absolute
reduction in the rate of major cardiovascular events of 2.2 percent and a 22 percent rel-
ative reduction in risk (hazard ratio, 0.78; 95 percent confidence interval, 0.69 to 0.89;
P<0.001). There was no difference between the two treatment groups in overall mortality.
conclusions
Intensive lipid-lowering therapy with 80 mg of atorvastatin per day in patients with sta-
ble CHD provides significant clinical benefit beyond that afforded by treatment with
10 mg of atorvastatin per day. This occurred with a greater incidence of elevated amino-
transferase levels.
abstract
Copyright © 2005 Massachusetts Medical Society. All rights reserved.
Downloaded from www.nejm.org at RIKSHOSPITALET HF on February 18, 2008 .
n engl j med
352;14
www.nejm.org april
7
,
2005
The
new england journal
of
medicine
1426
he value of lowering low-density
lipoprotein (LDL) cholesterol levels in pre-
venting major cardiovascular events and
stroke has been well documented. Recent studies
have raised the issue of optimal treatment targets
for patients with coronary heart disease (CHD).
1-4
The value of reducing LDL cholesterol levels sub-
stantially below 100 mg per deciliter (2.6 mmol per
liter) in patients with CHD, particularly those with
stable nonacute disease, has not been clearly dem-
onstrated.
The Third Report of the National Cholesterol Ed-
ucation Program (NCEP) Adult Treatment Panel
5
and the most recent guidelines of the Third Joint
Task Force of European and Other Societies on Car-
diovascular Disease Prevention in Clinical Practice
6
have recommended an LDL cholesterol level of less
than 100 mg per deciliter as the goal of therapy for
patients at high risk for CHD. On the basis of data
from the Heart Protection Study (HPS)
1
and the
Pravastatin or Atorvastatin Evaluation and Infec-
tion Trial (PROVE IT),
2
the NCEP in conjunction
with the American Heart Association and the Amer-
ican College of Cardiology subsequently introduced
a more aggressive, but optional, LDL cholesterol
goal of less than 70 mg per deciliter (1.8 mmol per
liter) for patients at very high risk for CHD, even if
baseline LDL cholesterol levels were below 100 mg
per deciliter.
7
However, PROVE IT was conducted
in a population of patients with acute coronary syn-
dromes who were at very high risk for cardiovascu-
lar disease, and although many patients in the HPS
who began with an LDL cholesterol level of less than
100 mg per deciliter benefited from statin therapy,
this benefit was in comparison with placebo. Thus,
there is no definitive evidence that intensive stat-
in therapy, with a goal of reducing LDL cholesterol
levels to approximately 70 mg per deciliter, is asso-
ciated with better outcomes than moderate statin
therapy, with a goal of reducing LDL cholesterol lev-
els to about 100 mg per deciliter in patients with sta-
ble CHD. Data from the Treating to New Targets
(TNT) Study make it possible to test this hypothesis.
The design of the TNT Study has been described
in detail previously.
8
All patients gave written in-
formed consent, and the study was approved by the
local research ethics committee or institutional re-
view board at each center.
primary hypothesis
The primary hypothesis of the study was that re-
ducing LDL cholesterol levels to well below 100 mg
per deciliter in patients with stable CHD and slightly
elevated LDL cholesterol levels (despite previous
therapy with low-dose atorvastatin) could yield an
incremental clinical benefit. This hypothesis was
tested in a double-blind, parallel-group design. The
occurrence of major cardiovascular outcomes was
compared in two groups of patients: one group re-
ceived 10 mg of atorvastatin daily with the goal of
an average LDL cholesterol level of 100 mg per deci-
liter, and the other group received 80 mg of ator-
vastatin daily with the goal of an average LDL cho-
lesterol level of 75 mg per deciliter (1.9 mmol per
liter).
patient population
Eligible patients were men and women 35 to 75
years of age who had clinically evident CHD, defined
by one or more of the following: previous myocar-
dial infarction, previous or current angina with ob-
jective evidence of atherosclerotic CHD, and a his-
tory of coronary revascularization. The exclusion
criteria have been described in detail previously.
8
Randomization occurred between July 1998 and
December 1999.
study protocol
Any previously prescribed lipid-regulating drugs
were discontinued at screening, and all patients
completed a washout period of one to eight weeks.
To ensure that, at baseline, all patients had LDL cho-
lesterol levels consistent with then-current guide-
lines for the treatment of stable CHD, patients with
LDL cholesterol levels between 130 and 250 mg
per deciliter (3.4 and 6.5 mmol per liter, respective-
ly) and triglyceride levels of 600 mg per deciliter
(6.8 mmol per liter) or less entered an eight-week
run-in period of open-label treatment with 10 mg
of atorvastatin per day. At the end of the run-in
phase (week 0), patients with a mean LDL cholester-
ol level of less than 130 mg per deciliter (3.4 mmol
per liter) (determined four weeks and two weeks
before randomization) were randomly assigned to
double-blind therapy with either 10 mg or 80 mg
of atorvastatin per day. During the double-blind
period, follow-up visits occurred at week 12 and
at months 6, 9, and 12 in the first year and every
6 months thereafter.
t
methods
Copyright © 2005 Massachusetts Medical Society. All rights reserved.
Downloaded from www.nejm.org at RIKSHOSPITALET HF on February 18, 2008 .
n engl j med
352;14
www.nejm.org april
7, 2005
intensive atorvastatin therapy for stable coronary disease
1427
efficacy outcomes
The primary efficacy outcome was the occurrence of
a major cardiovascular event, defined as death from
CHD, nonfatal non–procedure-related myocardial
infarction, resuscitation after cardiac arrest, or fatal
or nonfatal stroke. Secondary outcomes included a
major coronary event (defined as death from CHD,
nonfatal non–procedure-related myocardial infarc-
tion, or resuscitation after cardiac arrest), a cere-
brovascular event, hospitalization for congestive
heart failure, peripheral-artery disease, death from
any cause, any cardiovascular event, and any coro-
nary event.
statistical analysis
Epidemiologic data suggested that the treatment-
related difference in LDL cholesterol levels between
the two groups would translate into 20 to 30 percent
fewer recurrent coronary events at five years in the
group given 80 mg of atorvastatin than in the group
given 10 mg of atorvastatin. The study’s original tar-
get enrollment was approximately 8600 patients on
the basis of a projected number of 750 major coro-
nary events during an average follow-up of 5.5 years.
However, the recruitment rate was higher than ex-
pected, and 10,003 patients underwent randomiza-
tion, all but 2 of whom received the study drug.
In February 2003, the steering committee added
stroke (fatal or nonfatal) to the primary efficacy out-
come. This change was made before any data were
reviewed and preceded the first interim analysis by
the independent data and safety monitoring board.
At the time, evidence was accumulating of the ben-
eficial role of statins in reducing the risk of stroke.
The change in the primary end point was made to
clarify this role. This modification led to an increase
in the projected number of primary events to 950
(750 coronary events plus 200 strokes) during the
trial, providing the study with a statistical power of
85 percent to detect an absolute reduction of 17 per-
cent in the five-year cumulative rate of the primary
efficacy outcome in the group given 80 mg of ator-
vastatin, as compared with the group given 10 mg
of atorvastatin, with the use of a two-sided test at
an alpha level of 0.05.
All analyses were performed on an intention-
to-treat basis. All randomized patients who were
dispensed one dose of the study drug were includ-
ed in the analyses. The primary and secondary com-
posite end points were analyzed from the time of
the first dose of study drug to the first event, ac-
cording to the Kaplan–Meier method. The study
had a statistical power of only 40 percent to detect
a 10 percent reduction in the risk of death from any
cause with the use of a two-sided test at an alpha
level of 0.05.
Two interim efficacy analyses were performed
and were based on a two-sided Peto type of moni-
toring boundary. For the final primary analysis,
an adjusted P value of 0.049 was considered to in-
dicate statistical significance, given a type I error
rate of 0.05. For all secondary outcomes, a P value
of 0.05 was considered to indicate statistical sig-
nificance, and all tests were two-sided.
The sponsor initiated the study. The steering
committee developed the protocol in collaboration
with the sponsor and took responsibility for the
final version. ICON Clinical Research (North Wales,
Pennsylvania) managed all data. ICON and Pfizer
provided site monitoring throughout the study.
An independent end-points committee adjudicat-
ed all potential end points in a blinded fashion. An
independent data and safety monitoring board with
its independent statistical-support group from the
University of Wisconsin performed interim mon-
itoring and analyses of efficacy, safety, and data
quality. The data were analyzed by the sponsor ac-
cording to the statistical-analysis plan approved
by the steering committee. The steering committee
had unrestricted, request-based access to the study
data, which were retained by the sponsor, and wrote
the article without constraints from the sponsor.
The steering committee assumes overall responsi-
bility for the integrity of the data, for the accuracy
of the data analyses, and for the completeness of
the material reported. The data reported were those
available to the steering committee as of January
29, 2005.
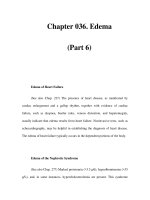
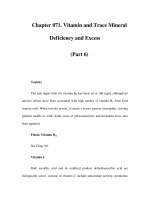
patient population
A total of 18,469 patients were screened at 256
sites in 14 countries (Fig. 1). Of these, 15,464 pa-
tients (83.7 percent) were deemed eligible to enter
the open-label run-in period. A further 5461 patients
were excluded after the open-label run-in phase.
Most of these excluded patients (4634, or 84.9 per-
cent) did not meet randomization criteria. Other
reasons included adverse events in 197 (3.6 percent),
death or an ischemic event in 211 (3.9 percent), and
lack of compliance in 70 (1.3 percent).
results
Copyright © 2005 Massachusetts Medical Society. All rights reserved.
Downloaded from www.nejm.org at RIKSHOSPITALET HF on February 18, 2008 .
n engl j med
352;14
www.nejm.org april
7
,
2005
The
new england journal
of
medicine
1428
Figure 1. Screening, Enrollment, and Outcomes.
To convert value for cholesterol to millimoles per liter, multiply by 0.02586; to convert value for triglycerides to millimoles
per liter, multiply by 0.0113. AST denotes aspartate aminotransferase, ALT alanine aminotransferase, and ULN upper
limit of the normal range.
18,469 Patients screened
5461 Excluded
4634 Did not meet randomization criteria
LDL cholesterol >130 mg/dl in 648
Triglycerides >600 mg/dl in 32
ALT or AST (or both) >1.5¬ULN in 96
195 Had ischemic events
197 Had adverse events
Myalgia in 35
70 Did not comply with treatment
16 Died
349 For other reasons
5006 Assigned to 10 mg
of atorvastatin per day
4995 Assigned to 80 mg
of atorvastatin per day
4959 Followed for end points
through end of study
9 Withdrew consent
38 Lost to follow-up
3005 Excluded
5006 Included in primary analysis
5006 Included in safety analysis
4995 Included in primary analysis
4995 Included in safety analysis
15,464 Entered open-label
run-in period
10,003 Underwent randomization
(2 not given drug)
Screening
Open-label treatment with
10 mg of atorvastatin per day
Randomization
4958 Followed for end points
through end of study
2 Withdrew consent
35 Lost to follow-up
1–8 Weeks Statin washout phase
8 Weeks
Up to
6 years
Copyright © 2005 Massachusetts Medical Society. All rights reserved.
Downloaded from www.nejm.org at RIKSHOSPITALET HF on February 18, 2008 .
n engl j med
352;14
www.nejm.org april
7, 2005
intensive atorvastatin therapy for stable coronary disease
1429
A total of 10,001 patients underwent random-
ization and received double-blind treatment with
either 10 mg or 80 mg of atorvastatin. The time of
randomization was taken as the baseline for the
study. Patients were followed for a median of 4.9
years.
The two groups were well matched at baseline
(Table 1), and the pattern of use of concomitant
medications was similar in the two groups. Blood
pressure was controlled for the duration of the
study in both groups.
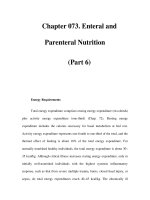
change in laboratory values
During the open-label period, the LDL cholesterol
level was reduced by 35 percent in the overall pa-
tient population, from a mean of 152 mg per deci-
liter (3.9 mmol per liter) to a mean of 98 mg per
deciliter (2.6 mmol per liter). Figure 2 summarizes
post-randomization lipid values in the two groups.
Mean LDL cholesterol levels during the study were
77 mg per deciliter (2.0 mmol per liter) among pa-
tients receiving 80 mg of atorvastatin and 101 mg
per deciliter (2.6 mmol per liter) among those re-
ceiving 10 mg of atorvastatin (Fig. 2A).
Total cholesterol levels (Fig. 2B) and triglycer-
ide levels (Fig. 2C) decreased significantly from
baseline to week 12 in the group given 80 mg of
atorvastatin (P<0.001 for both comparisons), and
the levels remained stable during the treatment pe-
riod. Both doses of atorvastatin produced nonsig-
* Plus–minus values are means ±SD.
† Race was self-designated.
‡ Body-mass index is the weight in kilograms divided by the square of the height in meters.
§ To convert values for cholesterol to millimoles per liter, multiply by 0.02586; to convert values for triglycerides to milli-
moles per liter, multiply by 0.0113. LDL denotes low-density lipoprotein, and HDL high-density lipoprotein.
Table 1. Baseline Characteristics of the Patients.*
Characteristic 10 mg of Atorvastatin (N=5006) 80 mg of Atorvastatin (N=4995)
Age — yr
60.9±8.8 61.2±8.8
Male sex — no. (%) 4045 (80.8) 4054 (81.2)
White race — no. (%)† 4711 (94.1) 4699 (94.1)
Systolic blood pressure — mm Hg 131±17 131±17
Diastolic blood pressure — mm Hg 78±10 78±10
Body-mass index‡ 28.6±4.7 28.4±4.5
Cardiovascular history — no. (%)
Current smoker 672 (13.4) 669 (13.4)
Former smoker 3167 (63.3) 3155 (63.2)
Systemic hypertension 2721 (54.4) 2692 (53.9)
History of diabetes mellitus 753 (15.0) 748 (15.0)
Myocardial infarction 2888 (57.7) 2945 (59.0)
Angina 4067 (81.2) 4084 (81.8)
Cerebrovascular accident 263 (5.3) 255 (5.1)
Peripheral-artery disease 570 (11.4) 603 (12.1)
Congestive heart failure 404 (8.1) 377 (7.6)
Arrhythmia 927 (18.5) 907 (18.2)
Coronary revascularization
Angioplasty 2719 (54.3) 2688 (53.8)
Bypass 2338 (46.7) 2317 (46.4)
Lipids — mg/dl§
LDL cholesterol 98±18 97±18
Total cholesterol 175±24 175±24
Triglycerides 151±72 151±70
HDL cholesterol 47±11 47±11
Copyright © 2005 Massachusetts Medical Society. All rights reserved.
Downloaded from www.nejm.org at RIKSHOSPITALET HF on February 18, 2008 .
n engl j med
352;14
www.nejm.org april
7
,
2005
The
new england journal
of
medicine
1430
nificant increases over baseline in high-density lipo-
protein (HDL) cholesterol levels, with no significant
difference between the groups during the course of
the study (Fig. 2D).
efficacy outcomes
A total of 434 patients in the group given 80 mg of
atorvastatin and 548 patients in the group given 10
mg of atorvastatin had a primary event during the
study, representing an event rate of 8.7 percent and
10.9 percent, respectively. This rate was equivalent
to an absolute reduction of 2.2 percent in the group
given 80 mg of atorvastatin. As compared with the
group given 10 mg of atorvastatin, the group given
80 mg had a 22 percent relative reduction in the pri-
mary composite efficacy outcome of death from
CHD, nonfatal non–procedure-related myocardial
infarction, resuscitation after cardiac arrest, or fatal
or nonfatal stroke (hazard ratio, 0.78; 95 percent
confidence interval, 0.69 to 0.89; P<0.001) (Fig. 3).
There were 545 major cardiovascular events (as a
first or subsequent event) in the group given 80 mg
of atorvastatin and 715 events in the group given 10
mg of atorvastatin (Table 2 shows only first events).
Outcomes for individual components of the primary
end point are shown in Table 2. Relative reductions
in the risk of death from CHD, nonfatal non–pro-
cedure-related myocardial infarction, and fatal or
nonfatal stroke with treatment with 80 mg of ator-
vastatin, as compared with 10 mg of atorvastatin,
were all consistent with the reduction observed for
the primary composite outcome. There was no sta-
tistical interaction for age or sex in the primary out-
come measure.
As compared with patients given 10 mg of ator-
vastatin, patients given 80 mg of atorvastatin also
had significant reductions in the risk of a major cor-
onary event (hazard ratio, 0.80; 95 percent confi-
dence interval, 0.69 to 0.92; P=0.002), any coronary
event (hazard ratio, 0.79; 95 percent confidence
interval, 0.73 to 0.86; P<0.001), a cerebrovascular
event (hazard ratio, 0.77; 95 percent confidence
interval, 0.64 to 0.93; P=0.007), hospitalization
with a primary diagnosis of congestive heart fail-
ure (hazard ratio, 0.74; 95 percent confidence inter-
val, 0.59 to 0.94; P=0.01), and any cardiovascular
event (hazard ratio, 0.81; 95 percent confidence in-
terval, 0.75 to 0.87; P<0.001) (Table 2). The effect
Figure 2. Mean Lipid Levels during the Study.
To convert values for cholesterol to millimoles per liter, multiply by 0.02586; to convert values for triglycerides to milli-
moles per liter, multiply by 0.0113.
LDL Cholesterol (mg/dl)
160
140
120
80
60
20
100
40
0
Screening 0 3 12 24 36 48 60 Final
Months
Total Cholesterol (mg/dl)
250
200
150
50
100
0
Screening 0 3 12 24 36 48 60 Final
Triglycerides (mg/dl)
200
180
160
120
100
20
140
40
80
60
0
Screening 0 3 12 24 36 48 60 Final
HDL Cholesterol (mg/dl)
60
40
42
44
46
48
50
52
54
56
58
0
Screening 0 3 12 24 36 48 60 Final
Months
Months Months
10 mg of atorvastatin
80 mg of atorvastatin
10 mg of atorvastatin
80 mg of atorvastatin
10 mg of atorvastatin
80 mg of atorvastatin
10 mg of atorvastatin
80 mg of atorvastatin
A
C
D
B
Copyright © 2005 Massachusetts Medical Society. All rights reserved.
Downloaded from www.nejm.org at RIKSHOSPITALET HF on February 18, 2008 .
n engl j med
352;14
www.nejm.org april
7, 2005
intensive atorvastatin therapy for stable coronary disease
1431
of 80 mg of atorvastatin on the risk of peripheral-
artery disease did not differ significantly from that
of 10 mg of atorvastatin (hazard ratio, 0.97; 95 per-
cent confidence interval, 0.83 to 1.15; P=0.76).
The risk of death from any cause also did not
differ significantly between the two drug regimens
(hazard ratio, 1.01; 95 percent confidence interval,
0.85 to 1.19; P=0.92). There were 155 deaths from
cardiovascular causes in the group given 10 mg of
atorvastatin (3.1 percent) and 126 in the group giv-
en 80 mg of atorvastatin (2.5 percent; hazard ratio,
0.80; 95 percent confidence interval, 0.64 to 1.08;
P=0.08). There were 127 deaths from noncardio-
vascular causes in the group given 10 mg of ator-
vastatin (2.5 percent) and 158 in the group given
80 mg of atorvastatin (3.2 percent; hazard ratio,
1.25; 95 percent confidence interval, 0.99 to 1.57;
P=0.06).
Cancer accounted for more than half the deaths
from noncardiovascular causes in both groups —
75 in the group given 10 mg of atorvastatin (1.5 per-
cent) and 85 in the group given 80 mg of atorva-
statin (1.7 percent; hazard ratio, 1.13; 95 percent
confidence interval, 0.83 to 1.55; P=0.42) — and
there were 43 deaths (0.9 percent) and 58 deaths
(1.2 percent), respectively, from nontraumatic caus-
es other than cancer (hazard ratio, 1.35; 95 percent
confidence interval, 0.91 to 2.00; P=0.13). There
were 16 hemorrhagic strokes in the group given 80
mg of atorvastatin and 17 in the group given 10 mg
of atorvastatin. Deaths from hemorrhagic stroke
or trauma (including accidental death, suicide, and
homicide) were infrequent, and the rates did not
differ significantly between the two groups.
No significant increase in adverse events of any
type was identified among patients who had very
Figure 3. Cumulative Incidence of a First Major Cardiovascular Event (Panel A), a First Major Coronary Event (Panel B),
Nonfatal Myocardial Infarction (MI) or Death from CHD (Panel C), and a First Fatal or Nonfatal Stroke (Panel D).
The primary end point was a first major cardiovascular event, and a first major coronary event was defined as death
from CHD, nonfatal non–procedure-related MI, or resuscitation after cardiac arrest. HR denotes hazard ratio for the
group given 80 mg of atorvastatin (ATV) as compared with the group given 10 mg of ATV.
HR=0.78 (0.69–0.89)
P<0.001
HR=0.78 (0.68–0.91)
P<0.001
HR=0.75 (0.59–0.96)
P=0.02
HR=0.80 (0.69–0.92)
P=0.002
Major Cardiovascular
Event (%)
0.15
0.10
0.05
0.00
0 1 2 3 4 5 6
Years
Major Coronary
Event (%)
0.10
0.05
0.00
0 1 2 3 4 5 6
Years
10 mg of ATV
80 mg of ATV
10 mg of ATV
80 mg of ATV
10 mg of ATV
80 mg of ATV
10 mg of ATV
80 mg of ATV
No. at Risk
10 mg of ATV
80 mg of ATV
0
0
2337
2391
4537
4589
4666
4706
4783
4809
4893
4909
5006
4995
No. at Risk
10 mg of ATV
80 mg of ATV
0
0
2304
2344
4456
4521
4596
4654
4738
4774
4866
4889
5006
4995
Nonfatal MI or Death
from CHD (%)
0.10
0.05
0.00
0 1 2 3 4 5 6
Years
Fatal or Nonfatal Stroke
(%)
0.04
0.03
0.02
0.01
0.00
0 1 2 3 4 5 6
Years
No. at Risk
10 mg of ATV
80 mg of ATV
0
0
2447
2451
4663
4684
4761
4771
4859
4862
4937
4937
5006
4995
No. at Risk
10 mg of ATV
80 mg of ATV
0
0
2361
2395
4539
4596
4670
4715
4792
4812
4693
4911
5006
4995
A
C
D
B
Copyright © 2005 Massachusetts Medical Society. All rights reserved.
Downloaded from www.nejm.org at RIKSHOSPITALET HF on February 18, 2008 .
n engl j med
352;14
www.nejm.org april
7
,
2005
The
new england journal
of
medicine
1432
low levels of LDL cholesterol (less than 70 mg per
deciliter [1.8 mmol per liter]), as compared with
those with higher levels.
safety
Adverse events related to treatment occurred in 406
patients in the group given 80 mg of atorvastatin,
as compared with 289 patients in the group given
10 mg of atorvastatin (8.1 percent vs. 5.8 percent,
P<0.001). The respective rates of discontinuation
due to treatment-related adverse events were 7.2 per-
cent and 5.3 percent (P<0.001). Treatment-related
myalgia was reported by 241 patients in the group
given 80 mg of atorvastatin and by 234 patients in
the group given 10 mg of atorvastatin (4.8 percent
and 4.7 percent, respectively; P=0.72). A total of
60 patients receiving 80 mg of atorvastatin had a
persistent elevation in alanine aminotransferase,
aspartate aminotransferase, or both (defined as two
consecutive measurements obtained 4 to 10 days
apart that were more than three times the upper lim-
it of the normal range), as compared with 9 patients
receiving 10 mg of atorvastatin (1.2 percent vs. 0.2
percent, P<0.001). There were no persistent eleva-
tions in creatine kinase (defined as two consecutive
measurements obtained 4 to 10 days apart that were
more than 10 times the upper limit of the normal
range). Five cases of rhabdomyolysis were report-
ed (two in the group given 80 mg of atorvastatin
and three in the group given 10 mg of atorvastat-
in); relevant clinical information about these cases
is presented in Table 3.
This trial provides evidence that the use of inten-
sive atorvastatin therapy to reduce LDL cholester-
ol levels below 100 mg per deciliter is associated
with substantial clinical benefit in patients with
stable CHD. Both atorvastatin groups had low rates
of CHD events. The rate in the group given 10 mg
of atorvastatin was lower than rates reported with
discussion
* In each row, only the first event for each patient is counted. CI denotes confidence interval.
† This was the original primary outcome (death from CHD, nonfatal non–procedure-related myocardial infarction, or resuscitation after cardiac
arrest).
‡ A cerebrovascular event was defined as fatal or nonfatal stroke or transient ischemic attack.
§ Peripheral-artery disease was defined as any new diagnosis of peripheral-artery disease, any admission related to its treatment, or any incidental
discovery of plaques or stenosis.
¶Any coronary event was defined as a major coronary event, revascularization procedure, procedure-related myocardial infarction, or document-
ed angina.
Table 2. Estimated Hazard Ratio for Individual Components of the Primary and Secondary Efficacy Outcomes.*
Outcome
10 mg of Atorvastatin
(N=5006)
80 mg of Atorvastatin
(N=4995) Hazard Ratio (95% CI) P Value
no. with first event (%)
Primary outcome
Total major cardiovascular events
548 (10.9) 434 (8.7) 0.78 (0.69–0.89) <0.001
Death from CHD 127 (2.5) 101 (2.0) 0.80 (0.61–1.03) 0.09
Nonfatal, non–procedure-related
myocardial infarction
308 (6.2) 243 (4.9) 0.78 (0.66–0.93) 0.004
Resuscitation after cardiac arrest 26 (0.5) 25 (0.5) 0.96 (0.56–1.67) 0.89
Fatal or nonfatal stroke 155 (3.1) 117 (2.3) 0.75 (0.59–0.96) 0.02
Secondary outcomes
Major coronary event†
418 (8.3) 334 (6.7) 0.80 (0.69–0.92) 0.002
Cerebrovascular event‡ 250 (5.0) 196 (3.9) 0.77 (0.64–0.93) 0.007
Hospitalization for congestive heart failure 164 (3.3) 122 (2.4) 0.74 (0.59–0.94) 0.01
Peripheral-artery disease§ 282 (5.6) 275 (5.5) 0.97 (0.83–1.15) 0.76
Death from any cause 282 (5.6) 284 (5.7) 1.01 (0.85–1.19) 0.92
Any cardiovascular event 1677 (33.5) 1405 (28.1) 0.81 (0.75–0.87) <0.001
Any coronary event¶ 1326 (26.5) 1078 (21.6) 0.79 (0.73–0.86) <0.001
Copyright © 2005 Massachusetts Medical Society. All rights reserved.
Downloaded from www.nejm.org at RIKSHOSPITALET HF on February 18, 2008 .
n engl j med
352;14
www.nejm.org april
7, 2005
intensive atorvastatin therapy for stable coronary disease
1433
statin treatment in placebo-controlled, secondary-
prevention trials of populations with a baseline
risk similar to that of our patients.
1,10,11
The relative reduction in the risk of the primary
composite end point of death from CHD, nonfatal
non–procedure-related myocardial infarction, re-
suscitation after cardiac arrest, and fatal or nonfa-
tal stroke was 22 percent in the group given 80 mg
of atorvastatin, as compared with the group given
10 mg of atorvastatin. Our findings indicate that
the quantitative relationship between reduced LDL
cholesterol levels and reduced CHD risk demon-
strated in prior secondary-prevention trials of stat-
ins holds true even at very low levels of LDL cho-
lesterol (Fig. 4). If these results were extrapolated
to clinical practice, the use of an 80-mg dose of
atorvastatin to reduce LDL cholesterol levels from
a baseline of 101 mg per deciliter to 77 mg per
deciliter in 1000 patients with stable CHD would
prevent 34 major cardiovascular events over a pe-
riod of five years; in other words, approximately
30 patients would need to be treated to prevent
one event.
Evaluation of individual components of the pri-
mary and secondary end points shows that treat-
ment with 80 mg of atorvastatin had a consistent
and significant beneficial effect on most measures
of CHD-related morbidity and mortality. The clini-
cal benefit of reducing LDL cholesterol levels sub-
stantially below 100 mg per deciliter extended be-
yond the CHD-related vasculature. As compared
with the 10-mg dose of atorvastatin, intensive ther-
apy with high-dose atorvastatin reduced the risk of
cerebrovascular events by 23 percent. There was no
significant difference between groups in the num-
bers of hemorrhagic strokes as a first event.
The study was not adequately powered to de-
tect changes in the risk of death from any cause.
There were no significant differences between the
two atorvastatin groups in the risk of death from
cardiovascular or noncardiovascular causes. The
rates of death from coronary causes in both groups
were very low as compared with those in previous
secondary-prevention trials of statins, accounting
for only about one third of all deaths. As a conse-
quence, the 20 percent reduction in the risk of
death from CHD in the group given 80 mg of ator-
vastatin as compared with the group given 10 mg
of atorvastatin was not large enough to have a sig-
nificant effect on the risk of death from any cause.
In both groups, cancer (mainly lung and gas-
trointestinal) was the leading noncardiovascular
cause of death; other causes included respiratory
diseases, infection, degenerative diseases, and met-
abolic abnormalities. Although for most of these
noncardiovascular causes, the number of deaths
was slightly higher in the group given 80 mg of ator-
vastatin than in the group given 10 mg of atorva-
* The criteria of the American College of Cardiology, American Heart Association, and National Heart, Lung, and Blood Institute for rhabdomy-
olysis are muscle symptoms plus a creatine kinase level that is more than 10 times the upper limit of the normal range (>10¬ULN) plus an
elevation in creatinine or urinary abnormalities (e.g., myoglobinuria).
9
Cases were identified by the investigator with direct responsibility for
the patient; none of the cases were believed to be related to the study drug. MI denotes myocardial infarction.
Table 3. Characteristics of Five Patients with Rhabdomyolysis.*
Characteristic Patient 1 Patient 2 Patient 3 Patient 4 Patient 5
Clinical presentation
Congestive heart
failure, MI, re-
spiratory fail-
ure, pneu-
mothorax
Accidental fall Pneumonia
and sepsis
Weakness with con-
comitant inges-
tion of alcohol
and cetirizine
Postoperative thromboem-
bolic disease; occluded
arterial supply to right
arm and left leg
Atorvastatin group 80 mg 10 mg 10 mg 10 mg 80 mg
Muscle symptoms No Yes No Yes No
Creatine kinase (U/liter)
Peak 4228 611 4913 7265 Not available
Normal range 25–195 55–170 Not available <180 Not available
Creatine kinase
>10¬ULN
Yes No Yes Yes Not available
Creatinine elevation
(or urinary ab-
normalities)
Undetermined Yes (marginal increase
in creatinine)
Not available Undetermined Renal failure
Copyright © 2005 Massachusetts Medical Society. All rights reserved.
Downloaded from www.nejm.org at RIKSHOSPITALET HF on February 18, 2008 .
n engl j med
352;14
www.nejm.org april
7
,
2005
The
new england journal
of
medicine
1434
statin, no single cause (according to body system
or pathologic process) and no single type of can-
cer accounted for the nonsignificant difference in
deaths from any cause between the groups.
The findings regarding drug safety are consis-
tent with the adverse-event profiles of these two
doses of atorvastatin reported in other large-scale
trials of atorvastatin.
2,3
The exclusion of 131 pa-
tients because of abnormal liver-function tests or
myalgia during the run-in phase is unlikely to ac-
count for the low incidence of persistent eleva-
tions in liver aminotransferase levels and the low
rate of muscle-related adverse events during the
study.
In summary, our findings demonstrate that the
use of an 80-mg dose of atorvastatin to reduce LDL
cholesterol levels to 77 mg per deciliter provides
additional clinical benefit in patients with stable
CHD that is perceived to be well controlled at an
LDL level of approximately 100 mg per deciliter.
These data confirm and extend the growing body
of evidence indicating that lowering LDL choles-
terol levels well below currently recommended lev-
els can have clinical benefit.
Funded by Pfizer.
Dr. LaRosa reports having received consulting fees from Pfizer,
Merck, Bristol-Myers Squibb, and AstraZeneca and lecture fees
from Pfizer; Dr. Grundy lecture fees from Merck, Pfizer, Kos Phar-
maceutical, Abbott, and AstraZeneca and grant support from Kos
Pharmaceutical and Merck; and Dr. Waters consulting fees from
AstraZeneca and Pfizer; lecture fees from Merck, Pfizer, and Novar-
tis; and grant support from Merck and Johnson & Johnson. Dr. Shear
is an employee of Pfizer and owns stock in that company. Dr. Barter
reports having received consulting fees from Pfizer, AstraZeneca,
and Sanofi-Aventis; lecture fees from Pfizer, AstraZeneca, Fournier-
Pharma, and Sanofi-Aventis; and grant support from Pfizer; and
Dr. Fruchart consulting fees from Pfizer and Fournier and lecture
fees from Merck, Fournier, Pierre Fabrie, and AstraZeneca. Dr.
Gotto reports having received consulting fees from AstraZeneca,
Bristol-Myers Squibb, Merck, ScheringPlough, Pfizer, Novartis, and
Reliant and lecture fees from AstraZeneca, Merck, ScheringPlough,
Pfizer, and Reliant and having testified before the Food and Drug
Administration on behalf of Johnson & Johnson–Merck. Dr. Greten
reports having received consulting and lecture fees from Pfizer,
Merck, and ScheringPlough; Dr. Kastelein consulting fees, lec-
ture fees, and grant support from Pfizer, Merck, ScheringPlough,
AstraZeneca, Bristol-Myers Squibb, and Sankyo; Dr. Shepherd
consulting fees from AstraZeneca, GlaxoSmithKline, Merck,
ScheringPlough and Oxford Biosensors and lecture fees from
AstraZeneca, Merck, and ScheringPlough; and Dr. Wenger consult-
ing fees from Eli Lilly, Merck, Bristol-Myers Squibb, Pfizer, and Kos
Pharmaceuticals; lecture fees from Eli Lilly, Pfizer, Novartis, Merck,
Bristol-Myers Squibb, and Kos Pharmaceuticals; and grant support
from Eli Lilly, Novartis, Bristol-Myers Squibb, and AstraZeneca.
We are indebted to all the trial participants; to the large number
of doctors, nurses, and hospital administrative staff in various coun-
tries for their long-term commitment to the study; and to Diane
Hessinger, Roger Chan, Andrei Breazna, Eric Gibson, Liz Cusenza,
Sheila Auster, Patrick Ferrebee, and Roddy Carter (all full-time em-
ployees of Pfizer) for their contributions.
appendix
The following persons participated in the TNT Study:
Steering Committee:
J. LaRosa (chair), New York; P. Barter, Sydney; J C. Fruchart,
Lille, France; A. Gotto, New York; H. Greten, Hamburg, Germany; S. Grundy, Dallas; D. Hunninghake, Minneapolis; J. Kastelein, Amster-
dam; J. Shepherd, Glasgow; D. Waters, San Francisco; N. Wenger, Atlanta;
End-Points Committee
: L. Cohen (chair), New Haven, Conn.; J M.
LaBlanche, Lille, France; H. Levine, Boston; U. Sechtem, Stuttgart, Germany; F. Welty, Boston;
Data and Safety Monitoring Board
: C. Hen-
nekens (chair), Miami; V. Brown, Atlanta; R. Carmena, Valencia, Spain; R. D’Agostino, Boston; S. Haffner, San Antonio, Tex.; E. Leitersdorf,
Jerusalem;
Investigators (numbers of randomized patients in parentheses)
:
Australia (608 patients):
C. Aroney, P. Barter, J. Bradley, D. Colqu-
houn, A. Dart, M. d’Emden, J. Lefkovits, R. Minson, G. Nelson, R. O’Brien, P. Roberts-Thomson, A. Thomson, D. Sullivan, P. Thompson;
Austria (29 patients):
H. Drexel, H. Sinzinger, F. Stockenhuber;
Belgium (300 patients):
P. Chenu, G. Heyndrickx, J. Van Cleemput, A. Van Dorpe,
W. Van Mieghem, P. Vermeersch;
Canada (1052 patients):
M. Arnold, R. Baigrie, J. Bergeron, C. Gagné, J. Davignon, J. Ducas, J. Genest, L.
Higginson, G. Hoag, J. Bonet, A. Ignaszewski, L. Leiter, S. LePage, P. Ma, M. McQueen, D. Mymin, B. O’Neill, B. Sussex, P. Theroux, G.
Tremblay, W. Tymchak, J. Warnica;
France (207 patients):
P. Attali, J. Bonnet, L. Caster, R. Constans, J. Demarcq, I. Ginon, J. Leymarie, J. Man-
sourati, J. Ollivier, F. Paillard, J. Ponsonnaille;
Germany (144 patients):
U. Beil, H. Fritz, D. Hüwel, W. Huppertz, W. Liebscher, K Schussmann,
E. Steinhagen-Thiessen;
Ireland (53 patients):
B. Buckley, P. Crean;
Italy (75 patients):
A. Branzi, P. Fioretti, G. Gensini, N. Mininni, G. Pinelli,
E. Uslenghi;
the Netherlands (788 patients):
R. Anthonio, J. Bonnier, H. Crijns, H. Dohmen, P. Dunselman, M. Galjee, B. Hamer, J. Hoorntje,
Figure 4. Event Rates Plotted against LDL Cholesterol Levels during Statin
Therapy in Secondary-Prevention Studies.
HPS denotes Heart Protection Study,
1
CARE Cholesterol and Recurrent
Events Trial,
10
LIPID Long-term Intervention with Pravastatin in Ischaemic
Disease,
11
and 4S Scandinavian Simvastatin Survival Study.
12
Event rates
for HPS, CARE, and LIPID are for death from CHD and nonfatal myocardial
infarction. Event rates for 4S and the TNT Study also include resuscitation
after cardiac arrest. To convert values for LDL cholesterol to millimoles per
liter, multiply by 0.02586.
4S
CARE
LIPID
4S
LIPID
HPS
HPS
TNT (80 mg of atorvastatin)
Statin
Placebo
CARE
TNT (10 mg of atorvastatin)
Event (%)
30
25
20
10
5
15
0
0 70 90 110 130 150 170 190 210
LDL Cholesterol (mg/dl)
Copyright © 2005 Massachusetts Medical Society. All rights reserved.
Downloaded from www.nejm.org at RIKSHOSPITALET HF on February 18, 2008 .
n engl j med
352;14
www.nejm.org april
7, 2005
intensive atorvastatin therapy for stable coronary disease
1435
J. Jukema, A. Oude-Ophuis, H. Plokker, J. Posma, J. Ruiter, M. Trip, A. van Boven;
South Africa (523 patients):
A. Dalby, L. Disler, A. Doubell,
J. King, E. Lloyd, J. Marx, P. Roux;
Spain (525 patients):
M. Anguita, C. Brotons, C. Calvo, J. Cruz-Fernandez, F. Fernandez-Aviles, A. Fernan-
dez-Cruz, I. Ferreira, E. Gonzalez, E. Lage, P. Mata, J. Mostaza, R. Muñoz-Aguilera, E. Lopez de Sa, G. Pedro, G. Permanyer, A. Pozuelo, R.
Querejeta, J. Ribera, E. Ros-Rahola, M. Vela;
Switzerland (91 patients):
W. Angehrn, L. Kappenberger, T. Moccetti, H. Saner;
United Kingdom
(299 patients):
D. Brydie, A. Chauhan, R. Greenbaum, H. Kadr, C. Kaski, R. Mattu, W. McCrea, J. McMurray, D. Mikhailidis, A. Salmasi, N. Sa-
mani, M. Shiu, A. Timmis, S. Turley, J. Wictome;
United States (5309 patients):
R. Abadier, S. Alexander, B. Asbill, J. Bagdade, B. Beard, J. Beck-
er, V. Bittner, R. Blumenthal, M. Bolton, W. Bremner, D. Brewer, C. Brown, K. Browne, J. Carstens, W. Cefalu, J. Chambers, J. Cohen, M. Col-
lins, S. Crespin, M. Cressman, R. Curry, M. Davidson, G. De Gent, J. de Lemos, P. Deedwania, D. Dixon, J. Duncan, C. East, D. Edmundowicz,
B. Effron, M. Elam, M. Ettinger, R. Feldman, D. Fiske, J. Forrester, G. Fraser, Z. Freedman, S. Freeman, V. Fonseca, D. Frid, K. Friday, J. Geo-
has, H. Ginsberg, A. Goldberg, E. Goldenberg, D. Goldner, D. Goldscher, B. Gordon, S. Gottlieb, M. Grayson, R. Guthrie, J. Guyton, J.
Haas, F. Handel, R. Hartman, J. Henry, M. Hepp, R. Heuser, D. Herrington, M. Hibbard, C. Hjemdahl-Monsen, G. Hopkins, V. Howard, J.
Hsia, D. Hunninghake, S. Jafri, P. Jones, P. Kakavas, J. Kane, L. Keilson, E. Kerut, R. Kloner, R. Knopp, J. Kostis, L. Kozlowski, R. Krasuski,
A. Kugelmass, K. LaBresh, J. Larry, C. Lavie, B. Lewis, S. Lewis, M. Linton, P. Linz, R. Lloret, V. Lucarella, J. Maciejko, D. McElroy, J. McGhee,
M. McGowan, W. McGuinn, M. Melucci, J. Merillat, M. Michalski, D. Miller, L. Miller, M. Miller, M. Mirro, V. Miscia, J. Mossberg, B. Musa,
S. Nash, R. Nesto, M. Neustel, T. Noonan, J. O’Keefe, B. Olafsson, S. Oparil, T. Pearson, C. Pepine, G. Peterson, G. Pogson, K. Powers, D.
Rader, R. Reeves, J. Reusch, G. Revtyak, D. Robertson, J. Robinson, W. Robinson, M. Rocco, J. Robinson, J. Rodgers, R. Rosenson, E. Roth,
S. Sadanandan, K. Salisbury, D. Sato, J. Saucedo, E. Schaefer, H. Schrott, L. Seman, G. Schectman, C. Schmalfuss, D. Schneider, B. Sobel, R.
Schneider, S. Schwartz, P. Seigel, M. Seyal, S. Sharp, D. Shindler, D. Smith, D. Sprecher, L. Solberg, E. Sontz, J. Stamper, E. Stein, V. Subbarao,
A. Susmano, A. Talle, P. Thompson, J. Torelli, F. Torres, D. Triffon, G. Vetrovec, N. Vijay, W. Wickermeyer, K. Wool, M. Zakrzewski, S. Zar-
ich, J. Zavoral, F. Zieve.
references
1.
Heart Protection Study Collaborative
Group. MRC/BHF Heart Protection Study of
cholesterol lowering with simvastatin in
20,536 high-risk individuals: a randomised
placebo-controlled trial. Lancet 2002;360:7-
22.
2.
Cannon CP, Braunwald E, McCabe CH,
et al. Intensive versus moderate lipid lower-
ing with statins after acute coronary syn-
dromes. N Engl J Med 2004;350:1495-504.
3.
Sever PS, Dahlof B, Poulter NR, et al. Pre-
vention of coronary and stroke events with
atorvastatin in hypertensive patients who
have average or lower-than-average choles-
terol concentrations, in the Anglo-Scandina-
vian Cardiac Outcomes Trial–Lipid Lowering
Arm (ASCOT-LLA): a multicentre random-
ised controlled trial. Lancet 2003;361:1149-
58.
4.
Koren MJ, Hunninghake DB. Clinical
outcomes in managed-care patients with cor-
onary heart disease treated aggressively in
lipid-lowering disease management clinics:
the ALLIANCE study. J Am Coll Cardiol 2004;
44:1772-9.
5.
Expert Panel on Detection, Evaluation,
and Treatment of High Blood Cholesterol
in Adults. Executive summary of the Third
Report of the National Cholesterol Educa-
tion Program (NCEP) Expert Panel on De-
tection, Evaluation, and Treatment of High
Blood Cholesterol in Adults (Adult Treatment
Panel III). JAMA 2001;285:2486-97.
6.
De Backer G, Ambrosioni E, Borch-
Johnsen K, et al. European guidelines on car-
diovascular disease prevention in clinical
practice: Third Joint Task Force of European
and Other Societies on Cardiovascular Dis-
ease Prevention in Clinical Practice. Eur Heart
J 2003;24:1601-10.
7.
Grundy SM, Cleeman JI, Merz CN, et al.
Implications of recent clinical trials for the
National Cholesterol Education Program
Adult Treatment Panel III guidelines. Circu-
lation 2004;110:227-39. [Erratum, Circula-
tion 2004;110:763.]
8.
Waters DD, Guyton JR, Herrington DM,
et al. Treating to New Targets (TNT) Study:
does lowering low-density lipoprotein cho-
lesterol levels below currently recommend-
ed guidelines yield incremental clinical ben-
efit? Am J Cardiol 2004;93:154-8.
9.
Pasternak RC, Smith SC Jr, Bairey-Merz
CN, et al. ACC/AHA/NHLBI clinical advisory
on the use and safety of statins. Circulation
2002;106:1024-8.
10.
Sacks FM, Pfeffer MA, Moyé LA, et al.
The effect of pravastatin on coronary events
after myocardial infarction in patients with
average cholesterol levels. N Engl J Med 1996;
335:1001-9.
11.
The Long-Term Intervention with Prava-
statin in Ischaemic Disease (LIPID) Study
Group. Prevention of cardiovascular events
and death with pravastatin in patients with
coronary heart disease and a broad range of
initial cholesterol levels. N Engl J Med 1998;
339:1349-57.
12.
Scandinavian Simvastatin Survival Study
Group. Randomised trial of cholesterol
lowering in 4444 patients with coronary
heart disease: the Scandinavian Simvastat-
in Survival Study (4S). Lancet 1994;344:
1383-9.
Copyright © 2005 Massachusetts Medical Society.
full text of all
journal
articles on the world wide web
Access to the complete text of the
Journal
on the Internet is free to all subscribers. To use this Web site, subscribers should go to
the
Journal’
s home page
(www.nejm.org)
and register by entering their names and subscriber numbers as they appear on their
mailing labels. After this one-time registration, subscribers can use their passwords to log on for electronic access to the entire
Journal
from any computer that is connected to the Internet. Features include a library of all issues since January 1993 and
abstracts since January 1975, a full-text search capacity, and a personal archive for saving articles and search results of interest.
All articles can be printed in a format that is virtually identical to that of the typeset pages. Beginning six months after publication,
the full text of all Original Articles and Special Articles is available free to nonsubscribers who have completed a brief registration.
Copyright © 2005 Massachusetts Medical Society. All rights reserved.
Downloaded from www.nejm.org at RIKSHOSPITALET HF on February 18, 2008 .
clinical practice
T h e
ne w eng l a n d j ou r n a l o f m edic ine
n engl j med 356;12 www.nejm.org march 22, 2007
1241
This Journal feature begins with a case vignette highlighting a common clinical problem.
Evidence supporting various strategies is then presented, followed by a review of formal guidelines,
when they exist. The article ends with the author’s clinical recommendations.
Intermittent Claudication
Christopher White, M.D.
From the Department of Cardiology,
Ochsner Medical Center, New Orleans.
Address reprint requests to Dr. White at
the Department of Cardiology, Ochsner
Medical Center, 1514 Jefferson Hwy.,
New Orleans, LA 70121, or at cwhite@
ochsner.org.
N Engl J Med 2007;356:1241-50.
Copyright © 2007 Massachusetts Medical Society.
A 58-year-old, previously healthy mail carrier reports cramping pain in his right calf
when he walks. The discomfort has progressively worsened over the past 6 months
and now forces him to rest after walking half a block on level ground at a normal pace.
The pain is interfering with his ability to perform his job. He has a normal right femo-
ral pulse and a diminished right popliteal pulse; the right ankle and foot pulses are
absent. How should this patient be evaluated and treated? Should he undergo revas-
cularization?
T h e Cl i nic a l Proble m
Peripheral arterial disease is a common manifestation of atherosclerosis, and its
prevalence increases with age and the presence of cardiovascular risk factors.
1,2
Cigarette smoking and diabetes mellitus are the strongest risk factors; more than
80% of patients with peripheral arterial disease are current or former smokers.
Hypertension, dyslipidemia, and hyperhomocysteinemia also significantly increase
the risk of peripheral arterial disease.
Most persons with this disease are asymptomatic, and the condition is detected
during routine physical examination of abnormal pulses, vascular bruits, or an ab-
normal value for the ankle–brachial index.
3,4
Less than 20% of patients with pe-
ripheral arterial disease report the typical symptom of intermittent claudication —
leg-muscle discomfort on exertion that is relieved with rest.
5
Many patients present
with atypical symptoms, including leg fatigue, difficulty walking, and leg pain that
is not typical of claudication.
Studies of the natural history of intermittent claudication indicate that the risk
of limb loss for patients who do not have diabetes is low (2% or less).
6
However,
the risk of progression to limb-threatening ischemia is increased by a factor of three
among patients with diabetes who require oral or insulin therapy as compared
with patients without diabetes, and the risk increases by 20 to 25% for each 0.1-unit
decrease in the ankle–brachial index.
7,8
Cardiovascular disease is the major cause of death in patients with intermittent
claudication; the annual rate of cardiovascular events (myocardial infarction, stroke,
or death from cardiovascular causes) is 5 to 7%.
9
Thus, the treatment of claudication
is directed not only at improving walking distance but also, and more important, at
reducing cardiovascular risk.
S tr ate gi e s a nd E v ide nc e
Evaluation
A careful history taking and examination will generally distinguish intermittent
claudication from nonvascular causes that may mimic claudication (pseudoclaudi-
Downloaded from www.nejm.org on February 18, 2008 . Copyright © 2007 Massachusetts Medical Society. All rights reserved.
T h e n e w e ngl a nd jo u r na l o f me dici n e
n engl j med 356;12 www.nejm.org march 22, 2007
1242
cation) (Table 1).
9,10
The patient’s lower legs and
feet should be examined with shoes and socks
off, with attention to pulses, hair loss, skin color,
and trophic skin changes.
Calculation of the ankle–brachial index (Fig. 1)
is recommended as the initial screening test. An
abnormal result (0.9 or less) is sufficient to make
the diagnosis of peripheral arterial disease in a
clinically appropriate setting. When the disease
is suspected on the basis of clinical observations
but the resting ankle–brachial index is normal,
the index should also be calculated after exercise
— after the patient has performed toe raises
(standing flat-footed and raising the heels off
the ground repeatedly) or has walked on a tread-
mill. Patients with large-vessel “inflow” disease
of the distal aorta or iliac arteries may have nor-
mal resting blood flow, but in the setting of
exercise and associated vasodilatation, pressure
gradients develop across the proximal stenoses,
leading to symptoms and an abnormally low val-
ue for the ankle–brachial index.
If the diagnosis of peripheral arterial disease is
uncertain, or if revascularization is being planned,
further imaging with duplex ultrasound, comput-
ed tomographic angiography (CTA), or magnetic
resonance angiography (MRA) may be useful. Seg-
mental pressure recording and pulse-volume re-
cording are used in some cases to assess the loca-
tion and severity of the lesion. In patients with
noncompressible vessels (usually patients with
diabetes or renal failure), the diagnosis can be
confirmed by measuring the toe–brachial index
(determined according to the return of pulsatile
flow on deflation of a small blood-pressure cuff
on the great or second toe with a plethysmo-
graphic device).
Both CTA and MRA produce images of vascu-
lar structures in cross-sectional slices that can be
reformatted into three-dimensional angiograph-
ic images (Fig. 2). In a randomized trial compar-
ing MRA with CTA for initial imaging in periph-
eral arterial disease, the two techniques were
similar in ease of use and clinical outcome, but
total diagnostic costs were lower for CTA.
11
The gold standard for diagnosis and evaluation
of peripheral arterial disease is invasive digital-
subtraction angiography, which is used if endo-
vascular intervention is planned (Fig. 3). Serious
complications of this procedure, which are infre-
quent, include reactions to the contrast material
(in 4% of patients or less), bleeding (2% or less),
nephropathy due to contrast material (0.2 to 1.4%),
and cholesterol embolization (0.1% or less).
12,13
Table 1. Differentiation of True Claudication from Pseudoclaudication (Nonvascular Causes).
Characteristic
Intermittent
Claudication Spinal Stenosis Arthritis Venous Congestion
Compartment
Syndrome
Character of discom-
fort
Cramping, tightness,
or tiredness
Same symptoms as
with claudication
or tingling, weak-
ness, or clumsi-
ness
Aching Tightness, bursting
pain
Tightness, bursting
pain
Location of discom-
fort
Buttock, hip, thigh,
calf, foot
Buttock, hip, thigh Hip, knee Groin or thigh Calf
Exercise-induced dis-
comfort
Yes Variable Variable After walking After excessive
exercise
Walking distance Reproducible Variable Variable Variable Variable
Discomfort with
standing
No Yes Yes, changes with
shift in position
Yes, changes with
shift in position
Yes, changes with
shift in position
Relief of discomfort Rapid relief with rest Relief with sitting or
otherwise chang-
ing position
Slow relief with avoid-
ance of bearing
weight
Slow relief with leg
elevation
Slow relief with leg
elevation
Other Associated with ath
-
erosclerosis and
decreased pulses
History of lower-back
problems
Discomfort at joint
spaces
History of deep ve
-
nous thrombosis,
signs of venous
congestion
May occur in ath
-
letes after stren
-
uous exercise
* Information is from the American Heart Association and the American College of Cardiology
(Hirsch et al.
9
) and from Schmieder and
Comerota.
10
Downloaded from www.nejm.org on February 18, 2008 . Copyright © 2007 Massachusetts Medical Society. All rights reserved.
clinical pr actice
n engl j med 356;12 www.nejm.org march 22, 2007
1243
The advantages and disadvantages of digital-
subtraction angiography, CTA, MRA, and duplex
ultrasound are listed in Table 2.
Treatment
The mainstays of treatment for peripheral arte-
rial disease include risk-factor modification, an
exercise program, antiplatelet therapy, and, if war-
ranted for symptomatic relief, additional phar-
macologic therapy, and revascularization. Revas-
cularization (endovascular or surgical) therapy is
reserved for patients whose job performance or
lifestyle is compromised by claudication, patients
who do not have a response to exercise and phar-
macotherapy, and patients for whom the risk–
benefit ratio with revascularization is favorable.
9
Risk-Factor Modification
Since cardiovascular events are the major cause
of death in patients with peripheral arterial dis-
ease, modification of atherosclerotic risk factors
is routinely warranted, with a particular empha-
sis on smoking cessation and regular exercise.
Pharmacologic therapy and dietary modification
should be tailored to meet current guidelines for
risk factors: low-density lipoprotein cholesterol,
less than 100 mg per deciliter (2.6 mmol per liter)
or, for those at very high risk for ischemic events,
less than 70 mg per deciliter (1.8 mmol per liter);
blood pressure, less than 140 mm Hg systolic and
90 mm Hg diastolic or, for patients with diabetes
or renal disease, less than 130 mm Hg systolic
and 80 mm Hg diastolic; and glycated hemoglo-
bin, less than 7% in patients with diabetes.
14,15
Beta-blockers are effective as antihyperten-
sive therapy and are not contraindicated in pa-
tients with peripheral arterial disease. In the
Heart Outcomes Prevention Evaluation study, the
risk of heart attack, stroke, and death from vas-
cular causes was reduced by 22% for patients
given an angiotensin-converting–enzyme inhibi-
tor (ramipril).
16
Antiplatelet and Other Pharmacologic Therapy
Antiplatelet therapy with aspirin (75 mg to 325
mg daily) reduces the risk of death from vascular
causes, myocardial infarction, and stroke in pa-
tients with vascular diseases by 25% and is rec-
ommended for patients with peripheral arterial
disease.
17
A large, randomized, 3-year trial involv-
02/16/07
AUTHOR PLEASE NOTE:
Figure has been redrawn and type has been reset
Please check carefully
Author
Fig #
Title
ME
DE
Artist
Issue date
COLOR FIGURE
Version 2
White
1
LAM
3/22/07
Peripheral arterial disease
CS
SH
Interpretation of calculated index
Above 0.90 — normal
0.71–0.90 — mild obstruction
0.41–0.70 — moderate obstruction
0.00–0.40 — severe obstruction
Highest right ankle pressure (mm Hg)
Highest arm pressure (mm Hg)
Right ankle–brachial index
=
Highest left ankle pressure (mm Hg)
Highest arm pressure (mm Hg)
Left ankle–brachial index
Highest ankle pressure
Highest brachial pressure
92 mm Hg
164 mm Hg
0.56 Moderate obstruction
Pressure at posterior tibial
and dorsalis pedis arteries in
right and left ankle
Pressure at right
or left arm
Example
Formula
=
= = =
Figure 1. Performing Pressure Measurements and Calculating the Ankle–Brachial Index.
To calculate the ankle–brachial index, systolic pressures are determined in both arms and both ankles with the use
of a hand-held Doppler instrument. The highest readings for the dorsalis pedis and posterior tibial arteries are used
to calculate the index.
Downloaded from www.nejm.org on February 18, 2008 . Copyright © 2007 Massachusetts Medical Society. All rights reserved.
T h e n e w e ngl a nd jo u r na l o f me dici n e
n engl j med 356;12 www.nejm.org march 22, 2007
1244
ing high-risk patients, including patients with pe-
ripheral vascular disease, showed that rates of
death from vascular causes, myocardial infarction,
and stroke were significantly, albeit modestly, low-
er with clopidogrel than with aspirin; the rates of
bleeding complications were similar.
18
Thus, the
more expensive thienopyridines (ticlopidine and
clopidogrel) may be considered as alternatives to
aspirin, particularly in patients who cannot toler-
ate aspirin. Current data do not show an advantage
of dual antiplatelet therapy (aspirin and clopido-
grel) over single-agent therapy in patients with pe-
ripheral arterial disease.
9
Cilostazol is a phosphodiesterase type 3 in-
hibitor with vasodilator and mild antiplatelet
properties. Several randomized trials have shown
that walking distance is increased by about 50%
with cilostazol (100 mg twice a day), as compared
with placebo, after 3 to 6 months of therapy.
19
The most common side effects include headache,
diarrhea, palpitations, and dizziness. Cilostazol
is contraindicated in patients with heart failure,
because similar drugs, such as milrinone, are as-
sociated with increased mortality in this group.
In a trial comparing cilostazol, pentoxifylline
(a derivative of methylxanthine), and placebo,
pentoxifylline was inferior to cilostazol and no
better than placebo for relief from claudication.
20
Oral vasodilator prostaglandins, vitamin E, and
chelation therapy with EDTA have not proved to
be effective in reducing symptoms or increasing
walking distance.
9
Table 3 summarizes the phar-
macologic treatments for peripheral arterial dis-
ease and indicates the nature of the evidence sup-
porting their use.
Exercise
A Cochrane review of three randomized trials
showed that exercise increased maximal walking
distance by 150% over a period of 3 to 12 months,
as compared with usual care.
21
A meta-analysis of
eight randomized trials showed a greater symp-
tomatic benefit with a supervised (as opposed to
unsupervised) exercise program.
22
Supervised ex-
ercise commonly involves walking on a treadmill,
with the initial workload set to elicit symptoms
within 3 to 5 minutes of walking. The patient is
permitted to rest until the symptoms resolve and
then resumes exercise. In a meta-analysis of 18
randomized and nonrandomized trials, the great-
est benefit (assessed according to the distance
walked before claudication developed) was asso-
ciated with continued walking until pain was
nearly maximal and with sessions that lasted
longer than 30 minutes, took place three or more
times per week, and continued for more than
6 months.
23
Typically, it takes 1 to 2 months for
the patient to begin to notice benefits, which grad-
ually increase over a period of several months.
Revascularization
Superficial femoral-artery stenosis or occlusion
is the most common lesion associated with clau-
dication. Revascularization (surgery or percutane-
22p3
AUTHOR
FIGURE
JOB:
ISSUE:
4-C
H/T
RETAKE 1st
2nd
SIZE
ICM
CASE
Line
H/T
Combo
Revised
AUTHOR, PLEASE NOTE:
Figure has been redrawn and type has been reset.
Please check carefully.
REG F
FILL
TITLE
3rd
Enon
ARTIST:
White
2a-c of 3
3-22-07
mst
35612
A
B
C
Figure 2. Aortograms with Runoff Images in Three Patients.
The digital-subtraction angiogram in Panel A shows occlusion of the right
external iliac artery (arrow), bilateral narrowing of the superficial femoral
arteries, and single-vessel runoff below the knees. The CTA in Panel B is a
three-dimensional reconstruction showing very mild narrowing of the bilat-
eral superficial femoral arteries (double-headed arrow). The MRA in Panel
C, with enhancement from contrast material, shows bilateral occlusions of
the superficial femoral arteries with a patent femoral–popliteal graft (arrow)
on the right.
Downloaded from www.nejm.org on February 18, 2008 . Copyright © 2007 Massachusetts Medical Society. All rights reserved.