Báo cáo y học: "Predictive value of procalcitonin decrease in patients with severe sepsis: a prospective observational study" pps
Bạn đang xem bản rút gọn của tài liệu. Xem và tải ngay bản đầy đủ của tài liệu tại đây (378.71 KB, 10 trang )
RESEARC H Open Access
Predictive value of procalcitonin decrease in
patients with severe sepsis: a prospective
observational study
Sari Karlsson
1*
, Milja Heikkinen
2
, Ville Pettilä
3
, Seija Alila
4
, Sari Väisänen
2
, Kari Pulkki
2
, Elina Kolho
5
, Esko Ruokonen
6
,
the Finnsepsis Study Group
1
Abstract
Introduction: This prospective study investigated the predictive value of procalcitonin (PCT) for survival in 242
adult patients with severe sepsis and septic shock treated in intensive care.
Methods: PCT was analyzed from blood samples of all patients at baseline, and 155 patients 72 hours later.
Results: The median PCT serum concentration on day 0 was 5.0 ng/ml (interquartile range (IQR) 1.0 and 20.1 ng/ml)
and 1.3 ng/ml (IQR 0.5 and 5.8 ng/ml) 72 hours later. Hospital mortality was 25.6% (62/242). Median PCT
concentrations in patients with community-acquired infections were higher than with nosocomial infections (P =
0.001). Blood cultures were positive in 28.5% of patients (n = 69), and severe sepsis with positive blood cultures was
associated with higher PCT levels than with negative cultures (P = < 0.001). Patients with septic shock had higher
PCT concentrations than patients without (P = 0.02). PCT concentrations did not differ between hospital survivors
and nonsurvivors (P = 0.64 and P = 0.99, respectively), but mortality was lower in patients whose PCT concentration
decreased > 50% (by 72 hours) compared to those with a < 50% decrease (12.2% vs. 29.8%, P = 0.007).
Conclusions: PCT concentrations were higher in more severe forms of severe sepsis, but a substantial
concentration decrease was more important for survival than absolute values.
Introduction
Because promptly administered antimicrobial and early
goal-directed treatment has been shown to improve out-
come in patients with severe sepsis [1,2], early recogni-
tion of infection as a cause of critical illne ss is of major
importance. Various biomarkers, such as C-reactive pro-
tein (CRP), interleukin-6 (IL-6), and triggering receptor
expressed on myeloid cells-1 (TREM-1), have been stu-
died as a means of detecting infection as a cause of sys-
temic inflammation response syndrome, but none has
been shown to be used reliably to diagnose sepsis [3]. In
addition, CRP and other biomarkers have not been
shown to detect patients with a high risk of poor out-
come [4].
Procalcitonin (PCT) is a 116-amino acid prohormone
of calcitonin [5] that is found in the bloodstream with-
out changes in the total amount of calcitonin [6]. The
production of PCT is stimulated by inflammatory cyto-
kines, such as tumor necrosis factor-alpha and IL-6 [7].
PCT concentrations increase after bacterial infection but
also in noninfectious conditions with systemic inflam-
mation, such as multiple trauma, cardiogenic shock,
induction of hypothermia after cardiac arrest, and drug
sensitivity react ions [8-11]. PCT concentrations are also
elevated after major surgery [12]. However, bacterial
infections increase the expression of the PCT-produci ng
CALC-1 gene in multiple extrathyroid tissues through-
out the body [13].
Patients without infection and inflammation usually
have low serum PCT concentrations (< 0.05 ng/mL). In
patients with severe seps is or septic shock, PCT concen-
trations may increase significantly (up to 1,000 ng/mL)
[5]. The cutoff value for sepsis has been set at 0.44 to
* Correspondence:
1
Department of Intensive Care Medicine, Tampere University Hospital,
Teiskontie 35, 33521 Tampere, Finland
Full list of author information is available at the end of the article
Karlsson et al. Critical Care 2010, 14:R205
/>© 2010 Karlsson et al.; licensee BioMe d Central Ltd. This is an open access article distributed under the terms of the Creative Commons
Attribution License ( which permits unrestricted use, distr ibution, and reproduction in
any medium, provided the original work is properly cited.
1.0 ng/mL in different studies [14,15]. PCT concentra-
tions have been used to differentiate noninfected
patients from infected patients in prospective clinical
studies, and higher mortality has been associated with
patients who have increasing or persistently high PCT
concentrations [16]. Recent studies concerning PCT
have focused on pati ents with suspected or verified bac-
terial infections, and the duration of antibiotic treatment
was guided by decreasing PCT concentrations [17-19].
Reduced antibiotic administration without increased
adverse outcomes has been shown in patients with
lower respiratory tract infections (LRTIs) [18], medical
intensive care unit (ICU) patients [19], and patients with
severe sepsis and septic shock [20].
Meta-analyses of PCT have produced conflicting
results. One study concluded that PCT measurement
cannot differentiate sepsis reliably from other causes of
systemic inflammatory response syndrome and should
not be used widely in a critical care setting [21]. In con-
trast, another study regarded PCT as superior to CRP
measurement and concluded that PCT should be used
to diagnose sepsis in ICUs [22]. Differences in the case
mix may contribute to the varying results in critical care
settings: on admission to the hospital o r ICU, patients
are at different phases in the course of their sepsi s; pre-
ceding antibiotic treatment may be absent, ineffective
[23], or delayed [1]; and in postoperative patients, the
type of surgery may influence PCT concentrations [24].
In the present study, we measured PCT concentra-
tions twice in adult ICU patients with clinically diag-
nosed severe sepsis in the first 3 days after diagnosis.
We evaluated PCT concentrations and the type of organ
dysfunction, the type of infection (blood culture-positive,
community-acquired, or nosocomial), and the predictive
value for outco me of the first PCT concentration and
the decrease in PCT after treatment in this large popu-
lation of patients with severe sepsis.
Materials and met hods
Patient selection
This study was part of the Finnsepsis study, a prospec-
tive observational cohort study of incidence and out-
come of severe sepsis in Finland [25] . All adult
consecutive ICU admission episodes (4,500) in 24 ICUs
were screened for severe sepsis in a 4-month period
(from 1 November 2004 to 28 February 2005). Patients
were eligible if they fulfilled the American College of
Chest Physicians/Society of Critical Care Medicine
(ACCP/SCCM) criteria for severe sepsis or septic shock
[26]. Study entry (day 0) was the time when these cr i-
teria were first met. Consent from the ethics committee
was granted from each hospital. All pa tients or their
next of kin gave written consent for the study. APACHE
II (Acute Physiology and Chronic Health Evaluation II)
score and SAPS II (Simplified Acute Physiology Score
II) [27,28], organ dysfunction evaluated with SOFA
(Sequent ial Organ Failure Assessment) score, maximum
SOFA scores [29,30], and ICU and hospital mortalities
were recorded. Septic shock was defined as cardiovascu-
lar SOFA score 4, and acute kidne y injury was defined
as renal SOFA score 3 or 4. Severe sepsis was defined as
community-acquired if the infection was present or sus-
pected at hospital admission or less than 48 hours
thereafter and was defined as nosocomial if the infection
was diagnosed at least 48 hours after hospital admission.
Blood CRP concentrations were analyzed as daily rou-
tine samples in each participating hospital. Blood cul-
tures were drawn when clinically indicated and were
analyzed locally.
Blood samples
Arterial blood samples for PCT analyses were drawn
after informed co nsent within 24 hours of study entry
(day 0) and 72 hours thereafter. The reason for exclu-
sion was failure to obtain consent. Blood for serum sam-
ples was collected, and the samples were prepared
within 60 minutes of sampling. The samples were stored
at -80°C for later analysis. Serum PCT levels were mea-
sured with the Cobas 6000 analyzer (Hitachi High-Tech-
nologies Corporation, Tokyo, Japan). Analyzer reagents
(Elecsys B·R·A·H·M·S PCT assay) were developed in col-
laboration with B·R·A·H·M·S Aktiengesellschaft (Hen-
nigsdorf, Germany) and Roche Diagnostics (Mannheim,
Germany). The functional assay sensitivity (that is, the
lowest concentration that can be quantified with a
between-run imprecision of 20%) met the Roche Diag-
nostics specification of 0.06 ng/mL. The respective
within- and between-day coefficients of variation for
PCT analyses were 1.4% and 3.0% for 0.46 ng/mL PCT
and 1.1% and 2.6% for 9.4 ng/mL PCT.
Statistical analyses
Data are presented as median and interquartile range
(IQR) (25th to 75th percentiles), absolute value and per-
centage, or mean ± standard deviation. The nonpara-
metric data between survivors and nonsurvivors were
compa red with the Mann-Whitney U test, and categori-
cal variables were compared with the chi-square test.
PCT kinetics are expressed a s delta PCT (ΔPCT) con-
centrations. ΔPCT was calculated as the difference
between concentrations on day 0 and 72 hours (day 0 to
72 hours). ΔPCT w as positive with decreasing concen-
trations and negative with increasing concentrations.
The level of change between the two samples (for exam-
ple, greater than 50%) was calculated as a pro portion of
ΔPCT/PCT on day 0. The sensitivity, specificity, and
positive likelihood ratio for different PCT cutoff levels
were calculated. To determine the prognostic accuracy
Karlsson et al. Critical Care 2010, 14:R205
/>Page 2 of 10
of PCT and CRP on both time points, receiver operating
characteristic (ROC) curves were constructed and the
area s under the curve (AUCs) were calculated with 95%
confidence intervals (CIs). A P value of less than 0.05
was considered to be statistically significant in a ll tests.
The analyses were performed using SPSS 17.0 software
(SPSS Inc., Chicago, IL, USA).
Results
Informed consent and blood samples for the PCT ana-
lyses were obtained from 242 out of 470 patients
(51.2%) of the Finnsepsis study population. Two hun-
dred forty-two samples were obtained at baseline (day
0); of these, 155 samples were available 72 hours later.
Fourteen patient s died and 13 were discharged from the
ICU before the second sample w as obtained. Owing to
logistical reasons, an additional 59 sa mples were not
available.
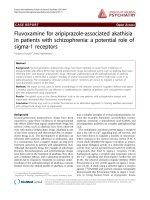
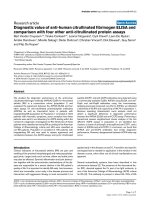
The flowchart of the study is presented in Figure 1.
The patients were divided by the t ype of infection and
the cutoff concentratio n for PCT to detect unlikely sep-
sis (< 0.5 ng/mL) in semiquantitative PCT measure-
ments (PCT-Q test) [31]. Age, gender, APACHE II
score, SAPS II, maximum SOFA score, ICU mortalities,
and hospital mortalities did not differ from the Finnsep-
sis patients who did not have PCT analyses (P = 0.75,
0.63, 0.58, 0.35, 0.22, 024, and 0.18, respectively). The
infection and mortality data of patients with commu-
nity-acquired or nosocomial severe sepsis are presented
in Table 1. Mortality in patients with positive blood cul-
tures did not differ from patients with blood culture-
negative infections (26.1% and 25.4%, respectively; P =
0.92). Hospital mortality of patients with severe septic
shock (cardiovascular SOFA score 4) was higher than
that of patients with less severe or absent cardiovasc ular
failure (31.6% versus 22.4%, P = 0.015).
Procalcitonin concentrations
The median PCT concentrations in patient s with severe
sepsis are presented in Table 2. On day 0, the range var-
iedfrom0.02to261.9ng/mL,andafter72hours,the
range varied from 0.03 to 439 ng/mL. PCT concentra-
tions did not differ between hospital survivors and non-
survivors at either time point (P = 0.64 and P = 0.99 for
day 0 and 72 hours, respectively). The ROC curves for
day-0 and 72-h our PCT concentrations and mortality
showed AUCs of 0.42 (95% CI 0.31 to 0.54, P =0.19)
and 0.50 (95% CI 0.38 to 0.62, P = 0.99), respectively.
High PCT concentrations (PCT > 10 ng/mL) on day 0
or 72 hours did not predict mortality; AUCs were 0.58
(CI 0.43 to 0.73, P = 0.25) and 0.36 (CI 0.09 to 0.62, P =
0.33), respectively.
Procalcitonin and type of infection
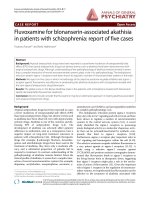
The median PCT concentrations on day 0 and after
72 hours in patients with community-acquired infections
were higher than in patients with nosocomial infections
(P =0.001andP = 0.003, respe ctively ) (Figure 2). Blood
cultures were drawn from 160 out of 242 pati ents (66%)
and were positive in 69 out of 242 (28.5%). PCT concen-
trations in relation to blood cultures and community-
acquired or nosocomial infections are presented in
Table 2. PCT concentrations were higher in patients with
positive blood cultures at both time point s (P < 0.001
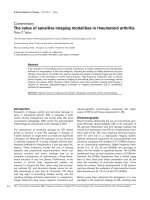
and P < 0.001, respectively). The ROC curves for day-0
and 72-hour PCT concentrations predicted blood cul-
ture-positive infections, with AUC s of 0. 76 (95% C I 0.66
to 0.86, P < 0.001 ) and 0.74 (95% CI 0.64 to 0.84, P <
0.001) (Figure 3). The cutoff PCT concentration for
blood culture-positive infection with 90% sensitivity (95%
CI 83% to 97%) was 1.2 ng/mL. The positive likelihood
ratio was 1.4 (95% CI 1.2 to 1.6). The cutoff PCT concen-
tration of 10 ng/mL had 62% (95% CI 51% to 74%) sensi-
tivity and 73% (95% CI 63% to 82%) specificity with a
positive likelihood ratio of 2.3 (95% CI 1.5 to 3.3) for
positive blood culture. PCT of greater than 20 ng/mL
had 85% specificity (95% CI 77% to 92%), and the positive
likelihood ratio was 3 (95% CI 1.7 to 5.2).
Thirty-six patients with clinically diagnosed severe
sepsis and low PCT concentrations (’seps is unlikely’)
had median PCT concentrations of 0.17 ng/mL (IQR
0.93 and 0.27 ng/mL) on day 0 and 0.13 ng/mL (IQR
0.08 and 0.22 ng/mL). Only one patient had a strongly
increasing PCT of 17.88 ng/mL after 72 hours. The
patient had an intra-abdominal infection. Nosocomial
infection was found in 53% (19/36) of these patients,
and the sources of infection were the lungs in 44%
(16/36) and intra-abdominal in 31% (11/36). One patient
242 patients with severe sepsis
157 patients with community-
acquired severe sepsis
85 patients with nosocomial
severe sepsis
PCT day 0
<0.5 ng/ml
17
p
atients
PCT day 0
>
0.5 ng/ml
140
p
atients
PCT day 0
<0.5 ng/ml
19
p
atients
PCT day 0
>
0.5 ng/ml
66
p
atients
Hospital
mortality
21.1%
(
4/19
)
Hospital
mortality
30.3%
(
20/66
)
Hospital
mortality
23.5%
(
4/17
)
Hospital
mortality
24.3%
(
34/140
)
Figure 1 Flowchart of the study. PCT, procalcitonin.
Karlsson et al. Critical Care 2010, 14:R205
/>Page 3 of 10
hadabloodculture-positiveinfection,and14other
patients had significant microbial growths.
Procalcitonin and organ dysfunction
Patientswithsepticshockoracutekidneyinjuryalso
had significantly higher PCT concentrations on day 0
compared with patients with milder or absent organ
dysfunction (P =0.020andP=0.027, respectively)
(Table 2). When patie nts w ith two available PCT
samples (n = 155) were divided into two groups accord-
ing to decreasing PCT (n = 130) or increasing PCT (n =
25), no significant differences were found in organ dys-
function (P = 0.58).
Changes in procalcitonin concentrations
We analyzed the difference in PCT concentrations on
day 0 and 72 hours (ΔPCT) for the 155 patients with
two blood samples available. The PCT concentration
Table 1 Patient data for all study patients and different types of infections
All patients Community-acquired Nosocomial P value
Number of patients 242 157/242 (64.9%) 85/242 (35.1%) < 0.001
Age in years (SD) 59.8 (15.4) 58.2 (15.6) 62.7 (14.7) 0.03
Males (percentage) 165 (68.2%) 109 (69.4%) 56 (65.9%) 0.57
APACHE II score (SD) 24.0 (9.0) 23.9 (8.8) 24.1 (9.5) 0.93
SAPS II (SD) 43.8 (16.8) 42.6 (16.0) 46.1 (17.9) 0.22
SOFA on day 1
a
(SD) 8.4 (3.6) 8.5 (3.6) 8.2 (3.5) 0.74
SOFAmax
b
(SD) 10.9 (4.3) 11.0 (4.4) 10.7 (4.1) 0.68
Postoperative (percentage) 63 (26.0%) 31 (19.7%) 32 (37.6%) < 0.01
Chronic renal failure 4 (1.7%) 1 (0.6%) 3 (3.5%) 0.16
Chronic lung disease 25 (10.3%) 17 (10.8%) 8 (9.4%) 0.84
Chronic hepatic disease 13 (5.4%) 6 (3.8%) 7 (8.2%) 0.22
Immunosuppression 30 (12.4%) 20 (12.7%) 10 (11.7%) 0.80
ICU mortality 33/242 (13.6%) 20/157 (12.7%) 13/85 (15.3%) 0.58
Hospital mortality 62/242 (25.6%) 38/157 (24.2%) 24/85 (28.2%) 0.49
Source of infection
Pulmonary 101 (41.7%) 69 (43.9%) 32 (37.6%) 0.34
Intra-abdominal 77 (31.9%) 42 (26.8%) 35 (41.2%) 0.02
Skin or soft tissue 24 (9.9%) 17 (10.8%) 7 (8.2%) 0.52
Urinary tract 11 (4.5%) 8 (5.1%) 3 (3.5%) 0.58
Other 33 (13.6%) 24 (15.3%) 9 (10.6%) 0.31
Blood cultures
Blood cultures taken 160/242 (66.1%) 110/157 (70.1%) 49/85 (57.6%)
Positive blood cultures 69/160 (43.1%) 56/110 (50.9%) 13/49 (26.5%)
Microbes in positive
blood cultures
Streptococcus pneumoniae 13 13 0
Staphylococcus aureus 11 10 1
Streptococcus species 9 9 0
Other Gram-positive 4 4 0
Escherichia coli 14 11 3
Other Gram-negative 13 8 5
Yeasts 4 1 3
Mycobacterium 1 0 1
Ongoing antibiotic
treatment before day 0
98/242 (40.5%) 38 (24.2%) 60 (70.6%) < 0.001
P values refer to patients with community-acquired or nosocomial infections.
a
Sequential Organ Failure Assessment score on the day after study entry.
b
Maximum Sequential Organ Failure Assessment score. APACHE II, Acute Physiology and Chronic Health Evaluation II; ICU, intensive care unit; SAPS II, Simplified
Acute Physiology Score II; SD, standard deviation.
Karlsson et al. Critical Care 2010, 14:R205
/>Page 4 of 10
decreased in 130 patients and increased in the remain-
ing 25 pati ents, but t he change in PCT concentration
was not associated with mortality (P =0.25).Of
the patients with decreasing PCT concentrations, 66%
(86/130) had community-acquired infections and 34%
(44/130) had nosocomial infections (P = 0.014).
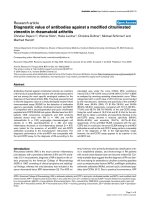
When the decreases in PCT concentrations were
divided into arbitra ry classes from greater than 50% to
greater than 90%, a substantial decrease in PCT concen-
tration of greater than 50% between the first and secon d
time points ha d an effect on hospital survival (Figure 4).
The hospital mortality in patients with a greater than
50% decrease in PCT was 12.2% (12/98) compar ed with
29.8% (17/57) in patients with a less than 50% decrease
(P = 0.007). Community-acquired infections (69.8%,
67/96) were associated with a greater than 50% decrease
more often than nosocomial infections were (52.5%,
31/59; P = 0.031). In patients with community-acquired
severe sepsis, a greater than 50% decrease was associated
with better outcome (62.5% survivors) compared with
patients with less than 50% decrease (19.8% survivors,
P = 0.05). However, this associat ion was not present for
patients with nosocomial severe sepsis (P =0.40).Inall
patients with available ΔPCT (n = 155 ), a g reater than
50% PCT decrease showed a poor AUC of 0.52 (95% CI
0.36 to 0.68). The PCT decrease of greater than 50%
was not independently as sociated with in-hospital mor-
tality (P = 0.47, odds ratio 0.99, 95% CI 0 .96 to 1.02)
either.
C-reactive protein measurements
The median CRP concentrations of this study popula-
tion were 197 mg/L (104 and 294 mg/L) on day 0 and
149 mg/L (76 and 201 mg/L) after 72 hours. Patients
with positive blood cultures had higher day-0 CRP con-
centrations compared with patients with negative cul-
tures (244 mg/L [131 to 325 mg/mL] and 187 mg/L [89
to 273 mg /L], respectively; P = 0.016). For patients with
decreasing or increasing PCT concentrations, the CRP
levels did not differ significantly on day 0 or after
72 hours (P = 0.138 and P = 0.552, respectively). CRP
concentrations were not associated with the severity of
cardiovascular dysfunction (P =0.35andP =0.11for
day 0 and 72 hours, respectively). The ROC curves for
day-0 and 72-hour CRP concentrations and mortality
showed inadequate AUCs of 0.52 (95% CI 0.46 to 0.58)
and 0.59 (95% CI 0.53 to 0.65), respectively (P = 0.99).
Discussion
PCT concentrations varied largely among individual ICU
patients with cli nically diagnosed severe sepsis. The pre-
dictive value of the individual PCT samples for mortality
was poor, but a prompt 50% decrease in PCT indicating
resolving inf ection was associated with a favorable out-
come. Patients with community-acquired infections had
higher PCT concentrations compared with patients with
nosocomial infe ctions. PCT concentrations were not
superior to C RP concentrations for predicting mortality
or severity of illness in our study.
The high values (up to 439 ng/mL) of the PCT con-
centrations in this study are in accordance with those in
other studie s [6,15]. The method used in this study was
able to detect low PCT concentrations (sensitivity of
0.06 ng/mL) more sensitively than the older LUMItest
assay (B·R·A·H·M·S), which has a detection limit of 0.3
to 0.5 ng/mL [32] and was used in many previous stu-
dies [15,16]. The cutoff limit for PCT is often set at
approximately 1 ng/mL in studies detecting sepsis from
other causes of systemic inflammatory response
[15,16,33,34]. The median PCT concentrations in our
patients were 5.0 ng/mL on the day that severe sepsis
was diagnosed and 6.5 ng/mL in patients with septic
shock. These concentrations are concordant with other
studies in patients with diagnosed severe sepsis [20,35].
In our study, as many as 22.7% of patients (55/242) had
a first PCT concentration of below 1 ng/mL. Nobre and
colleagues [20] found that 19.1% of severely septic
patients (13/68) had equally low PCT concentrations.
Notably, 15% of patients with clinically diagnosed severe
sepsis had low PCT concentrations both at s tudy entry
and at 72 hours.
PCT concentrations were higher in patients with
blood culture-positive severe sepsis, septic shock, or
Table 2 Procalcitonin concentrations in different patient
groups
Procalcitonin, ng/mL
Day 0 72 hours
All patients 5.0 (1.0-20.1) 1.3 (0.5-5.8)
Septic shock (SOFA 4)
a
6.5 (1.6-29.0) 2.3 (0.7-7.4)
Without septic shock
(SOFA 0-3)
a
3.2 (0.9-14.7) 1.1 (0.3-4.4)
Severe acute kidney injury
(SOFA 3-4)
b
9.4 (2.4-38.2) 4.9 (0.9-9.5)
Without severe acute kidney
injury (SOFA 0-2)
b
4.3 (0.9-16.4) 1.2 (0.3-4.9)
Blood culture-positive
infection
c
15.6 (4.3-43.6) 5.2 (1.7-8.7)
Blood culture-negative
infection
c
2.9 (0.8-12.5) 1.0 (0.3-4.3)
Community-acquired infection
d
6.6 (1.4-33.2) 2.4 (0.7-6.5)
Nosocomial infection
d
2.9 (0.8-10.6) 0.9 (0.2-2.8)
The data are presented as median (interquartile range). P values refer to
differences between patient groups (for example, those with and those
without septic shock).
a
P = 0.020 on day 0 and P = 0.031 at 72 hours;
b
P =
0.027 on day 0 and P = 0.02 at 72 hours;
c
P < 0.001 on day 0 and P < 0.001
at 72 hours;
d
P = 0.001 on day 0 and P = 0.003 at 72 hours. SOFA, Sequential
Organ Failure Assessment.
Karlsson et al. Critical Care 2010, 14:R205
/>Page 5 of 10
acute renal failure. High PCT concentrations in septic
shock or blood culture-positive patients were found in
other studies [15,36,37]. Using PCT levels of greater
than 0.5 ng/mL as the diagnostic criteria could decrease
the need for blood cultures in patients with community-
acquired pneumonia by 52% while still identifying 88%
of positive cultures [38]. In our more heterogeneous
patient population, the PCT concentration cutoff for
88% sensitivity was higher (2.7 ng/mL), with a specificity
of 53%. Meisner and colleagues [ 39] found th at higher
SOFA scores were associa ted with higher PCT concen-
trations in 40 patients, but in our larger study, we found
no association with overall organ dysfunction, even with
increasing concentrations.
We found higher PCT concentrations in patients with
community-acquired infectionsthaninpatientswith
nosocomial infections. Few studies have made compari-
sons between these patient groups. However, previous
sepsis may h ave an influence on decreasing PCT values
compared with patients with primary sepsis [40]. In that
study, all cases of secondary sepsis were nosocomial in
origin, but 64% of primary sepsis cases were community-
acquired. We had significantly more intra-abdominal
infections in the nosocomial group; of these patients,
52.9% had ongoing antimicrobial treatment. In general,
PCT concentrations may also be influenced by the organ-
ism causing infection [41,42].
PCT concentrations in intra-abdominal infections can
be useful when deciding the time frame for on-demand
laparotomy, and a PCT ratio cutoff value of 1.03 has
been proposed to predict successful elimination of the
intra-abdominal infection source [43]. In postoperative
critically ill patients, the cutoff point for PCT concentra-
tion was 1.44 ng/mL to detect worse outcome [44],
which may be due to infection and possible unsuccessful
control of the source.
In general, the severity of the inflammatory response,
the appropriate antimicrobial therapy, the timing for
antimicrobial administration , and adequate source con-
trol all have influence on infection healing and PCT
Figure 2 Procalcitonin (PCT) concentrations in patients with community-acquired or nosocomial infections. P = 0.001 on day 0 and P =
0.003 at 72 hours between the patient groups. PCT concentrations are shown in logarithmic scale and are presented in nanograms per milliliter.
Karlsson et al. Critical Care 2010, 14:R205
/>Page 6 of 10
decrease. These variable factors may explain the differ-
ences in PCT concentrations in patients with commu-
nity-acquired or nosocomial infections.
In our study, unlike in the s tudy by Clec’h and collea-
gues [15], single PCT concentrations did not predict
mortality; however, CRP w as equally poor at predicting
outcome in both studies. In a French study, the first
PCT concentration did not predict outcome, but con-
centrations were higher in nonsurvivors measured 3
days later [14]. Jensen and colleagues [16] studied the
predictive value of PCT in critically ill patients in gen-
eral and found that concentrations over 1 ng/mL pre-
dicted worse outcome. This is in accordance with other
studies’ cutoff limits that were used to discriminate
patients with severe infections from those without
severe infections.
In rece nt studies, a cutoff value of 1 ng/mL was used
[20,45] to reduce antibiot ic exposure or the length of
antibiotic treatment was based on PCT cutoff ranges or
decreasing PCT concentrations. In the ProHOSP study,
antibiotic administration was strongly encouraged for
patients with LRTIs and PCT concentrations of higher
than 0.5 ng/mL [18]. Patients in this study had commu-
nity-acquired pneumonia or LRTI and were not necessa-
rily critically ill [18]. Howev er, in critically ill patients,
PCT-guided termination of antibiotic treatment was
used without worsening outcome [19,45].
Our study has some limitations. Owing to unavailable
consent, blood samples were drawn from only half of the
patients (51.2%) in the Finnsepsis study, and ΔPCT could
be calculated from only one third of all patients (155/470,
33%). However, the patients with PCT measurements did
not differ from the other patients with regard to demo-
graphic data or severity of illness. Furthermore, we mea-
sured PCT concentrations at only two time points: on the
day severe sepsis was diag nosed and 72 hours afterwards,
rather than serially during the entire length of stay in the
ICU. On the other hand, our study, with 242 patients, is
one of the largest published studies of PCT measurements
in clinically diagnosed severe sepsis patients who were
treated in intensive care. Finally, antibiotic treatment was
not adjusted on the basis of PCT, but of clinical response
and CRP values. Thus, the outcome was not biased or
affected by PCT measurements.
Figure 3 Receiver operating characteristic curve for procalcitonin (PCT) concentration and positive blood culture. Areas under the curve
are 0.76 (95% confidence interval [CI] 0.66 to 0.86, P < 0.001) for PCT on day 0 and 0.74 (95% CI 0.64 to 0.84, P < 0.001) for PCT at 72 hours.
Karlsson et al. Critical Care 2010, 14:R205
/>Page 7 of 10
Conclusions
PCT concentrations are elevated in patients with blood
culture-positive infections and septic shock, but single
values have no predictive value for patient outcome.
However, a decrease in PCT concentrations may be
associated with a favorable outcome in p atients with
severe sepsis. Because of a substantial proportion of
severe sepsis patients with low PCT concentrations on
admission, clinical suspicion and diagnosis of severe sep-
sis cannot be replaced with PCT measurements.
Key messages
• Procalcitonin (PCT) concentrati ons are elevated in
patients with severe sepsis, especially with positive
blood culture infections or with septic shock.
• Some patients with severe sepsis may have low
PCT levels and the d iagnosis cannot be based only
on PCT concentrations.
• A substantial decrease in PCT concentration seems
to be more important for survival than individual
values.
Abbreviations
APACHE II: Acute Physiology and Chronic Health Evaluation II; AUC: area
under the curve; CI: confidence interval; CRP: C-reactive protein; ICU:
intensive care unit; IL-6: interleukin-6; IQR: interquartile range; LRTI: lower
respiratory tract infection; PCT: procalcitonin; ROC: receiver operating
characteristic; SAPS II: Simplified Acute Physiology Score II; SOFA: Sequential
Organ Failure Assessment.
Acknowledgements
The authors would like to acknowledge all investigators and study nurses
taking part in the Finnsepsis study at the participating hospitals (hospital:
investigator, study nurses): (1) Satakunta Central Hospital: Vesa Lund, Marika
Vettenranta, Päivi Tuominen; (2) East Savo Central Hospital: Markku Suvela,
Sari Hirvonen, Anne-Marja Turkulainen; (3) Central Finland Central Hospital:
Raili Laru-Sompa, Tiina Kirkhope; (4) South Savo Central Hospital: Heikki
Laine, Aki Savinen, Pekka Kettunen; (5) North Karelia Central Hospital: Sari
Karlsson, Jaana Kallinen, Vesa Parviainen; (6) Seinäjoki Central Hospital: Kari
Saarinen, Johanna Kristola, Niina Tuominen; (7) South Karelia Central Hospital:
Seppo Hovilehto, Sari Melto, Marjut Repo; (8) Kainuu Central Hospital: Tuula
Korhonen, Ulla Koponen, Kirsti Pomell; (9) Vaasa Central Hospital: Pentti Kairi,
Marianne Ström; (10) Kanta-Häme Central Hospital: Ari Alaspää, Elina
Helminen; (11) Lappi Central Hospital: Outi Kiviniemi, Tarja Laurila; (12) Midde
Pohjanmaa Central Hospital: Tadeusz Kaminski, Tea Verronen; (13)
Kymenlaakso Central Hospital: Jussi Pentti, Seija Alila; (14) Helsinki University
Hospital: Ville Pettilä, Marjut Varpula, Marja Hynninen, Elina Kolho, Marja Pere
Figure 4 Change in procalcitonin ( PCT) concentration (ΔPCT/PCT on day 0) in hospital survivors and nonsurvivors.Asterisksreferto
difference in PCT change. Positive change is defined as decreasing concentrations.
Karlsson et al. Critical Care 2010, 14:R205
/>Page 8 of 10
(
, Maiju Salovaara; (15) Helsinki University Hospital (Jorvi): Tero Varpula, Mirja
Vauramo; (16) Helsinki University Hospital (Peijas): Rita Linko, Kimmo Kuusisto;
(17) Tampere University Hospital: Esko Ruokonen, Pertti Arvola, Minna-Liisa
Peltola, Anna-Liina Korkala, Jani Heinilä; (18) Kuopio University Hospital: Ilkka
Parviainen, Seija Laitinen, Elina Halonen, Mirja Tiainen, Heikki Ahonen; (19)
Oulu University Hospital: Tero Ala-Kokko, Jouko Laurila, Tarja Lamberg,
Sinikka Sälkiö; (20) West Pohja Central Hospital: Jorma Heikkinen, Kirsi
Heinonen. This study was supported by Helsinki University Hospital EVO
grant T102010070.
Author details
1
Department of Intensive Care Medicine, Tampere University Hospital,
Teiskontie 35, 33521 Tampere, Finland.
2
Department of Clinical Chemistry,
University of Eastern Finland and Eastern Finland Laboratory Centre,
Puijonlaaksontie 2, 70211 Kuopio, Finland.
3
Division of Anaesthesia and
Intensive Care Medicine, Department of Surgery, Helsinki University Hospital,
Haartmaninkatu 4, 00029 HUS, Helsinki, Finland.
4
Department of Anaesthesia
and Intensive Care Medicine, Kymenlaakso Central Hospital, Kotkantie 41,
48210 Kotka, Finland.
5
Division of Infectious Diseases, Department of
Medicine, Helsinki University Hospital, Haartmaninkatu 4, 00029 HUS, Helsinki,
Finland.
6
Department of Intensive Care Medicine, Kuopio University Hospital,
Puijonlaaksontie 2, 70211 Kuopio, Finland.
Authors’ contributions
SK contributed the idea and design of the Finnsepsis study and this
substudy, analyzed the data, and wrote the initial manuscript. VP and ER
contributed the idea and design of the Finnsepsis study and this substudy
and contributed to the drafts of the manuscript. EK contributed the idea
and design of the Finnsepsis study and this substudy. MH, SV, and KP
helped to carry out the analyses and contributed to the manuscript. SA
collected the data and contributed to the drafting of the manuscript. All
authors read and approved the final version of the manuscript.
Competing interests
The authors declare that they have no competing interests.
Received: 12 August 2010 Revised: 2 November 2010
Accepted: 15 November 2010 Published: 15 November 2010
References
1. Kumar A, Roberts D, Wood KE, Light B, Parrillo JE, Sharma S, Suppes R,
Feinstein D, Zanotti S, Taiberg L, Gurka D, Kumar A, Cheang M: Duration of
hypotension before initiation of effective antimicrobial therapy is the
critical determinant of survival in human septic shock. Crit Care Med
2006, 34:1589-1596.
2. Rivers E, Nguyen B, Havstad S, Ressler J, Muzzin A, Knoblich B, Peterson E,
Tomlanovich M, Early-Goal-Directed Therapy Collaborative Group: Early
goal-directed therapy in the treatment of severe sepsis and septic
shock. N Engl J Med 2001, 345:1368-1377.
3. Kofoed K, Andersen O, Kronborg G, Tvede M, Petersen J, Eugen-Olsen J,
Larsen K: Use of plasma C-reactive protein, procalcitonin, neutrophils,
macrophage migration inhibitory factor, soluble urokinase-type
plasminogen activator receptor, and soluble triggering receptor
expressed on myeloid cells-1 in combination to diagnose infections: a
prospective study. Crit Care 2007, 11:R38.
4. Silvestre J, Povoa P, Coelho L, Almeida E, Moreira P, Fernandes A, Mealha R,
Sabino H: Is C-reactive protein a good prognostic marker in septic
patients? Intensive Care Med 2009, 35:909-913.
5. Jacobs JW, Lund PK, Potts JT Jr, Bell NH, Habener JF: Procalcitonin is a
glycoprotein. J Biol Chem 1981, 256:2803-2807.
6. Assicot M, Gendrel D, Carsin H, Raymond J, Guilbaud J, Bohuon C: High
serum procalcitonin concentrations in patients with sepsis and infection.
Lancet 1993, 341:515-518.
7. Dandona P, Nix D, Wilson MF, Aljada A, Love J, Assicot M, Bohuon C:
Procalcitonin increase after endotoxin injection in normal subjects. J Clin
Endocrinol Metab 1994, 79:1605-1608.
8. Maier M, Wutzler S, Lehnert M, Szermutzky M, Wyen H, Bingold T,
Henrich D, Walcher F, Marzi I: Serum procalcitonin levels in patients with
multiple injuries including visceral trauma. J Trauma 2009, 66:243-249.
9. Picariello C, Lazzeri C, Chiostri M, Gensini G, Valente S: Procalcitonin in
patients with acute coronary syndromes and cardiogenic shock
submitted to percutaneous coronary intervention. Intern Emerg Med 2009,
4:403-408.
10. Schuetz P, Affolter B, Hunziker S, Winterhalder C, Fischer M, Balestra GM,
Hunziker P, Marsch S: Serum procalcitonin, C-reactive protein and white
blood cell levels following hypothermia after cardiac arrest: a
retrospective cohort study. Eur J Clin Invest 2010, 40:476-481.
11. Bonaci-Nikolic B, Jeremic I, Nikolic M, Andrejevic S, Lavadinovic L: High
procalcitonin in a patient with drug hypersensitivity syndrome. Intern
Med 2009, 48:1471-1474.
12. Sarbinowski R, Arvidsson S, Tylman M, Oresland T, Bengtsson A: Plasma
concentration of procalcitonin and systemic inflammatory response
syndrome after colorectal surgery. Acta Anaesthesiol Scand 2005,
49:191-196.
13. Müller B, White JC, Nylén ES, Snider RH, Becker KL, Habener JF: Ubiquitous
expression of the calcitonin-i gene in multiple tissues in response to
sepsis. J Clin Endocrinol Metab 2001, 86
:396-404.
14. Charles PE, Tinel C, Barbar S, Aho S, Prin S, Doise JM, Olsson NO, Blettery B,
Quenot JP: Procalcitonin kinetics within the first days of sepsis:
relationship with the appropriateness of antibiotic therapy and the
outcome. Crit Care 2009, 13:R38.
15. Clec’h C, Ferriere F, Karoubi P, Fosse JP, Cupa M, Hoang P, Cohen Y:
Diagnostic and prognostic value of procalcitonin in patients with septic
shock. Crit Care Med 2004, 32:1166-1169.
16. Jensen JU, Heslet L, Jensen TH, Espersen K, Steffensen P, Tvede M:
Procalcitonin increase in early identification of critically ill patients at
high risk of mortality. Crit Care Med 2006, 34:2596-2602.
17. Venkatesh B, Kennedy P, Kruger PS, Looke D, Jones M, Hall J, Barruel GR:
Changes in serum procalcitonin and C-reactive protein following
antimicrobial therapy as a guide to antibiotic duration in the critically ill:
a prospective evaluation. Anaesth Intensive Care 2009, 37:20-26.
18. Schuetz P, Christ-Crain M, Thomann R, Falconnier C, Wolbers M, Widmer I,
Neidert S, Fricker T, Blum C, Schild U, Regez K, Schoenenberger R,
Henzen C, Bregenzer T, Hoess C, Krause M, Bucher HC, Zimmerli W,
Mueller B, ProHOSP Study Group: Effect of procalcitonin-based guidelines
vs standard guidelines on antibiotic use in lower respiratory tract
infections: the ProHOSP randomized controlled trial. JAMA 2009,
302:1059-1066.
19. Bouadma L, Luyt CE, Tubach F, Cracco C, Alvarez A, Schwebel C,
Schortgen F, Lasocki S, Veber B, Dehoux M, Bernard M, Pasquet B,
Régnier B, Brun-Buisson C, Chastre J, Wolff M, Prorata trial group: Use of
procalcitonin to reduce patients’ exposure to antibiotics in intensive
care units (PRORATA trial): a multicentre randomised controlled trial.
Lancet 2010, 375:463-474.
20. Nobre V, Harbarth S, Graf JD, Rohner P, Pugin J: Use of procalcitonin to
shorten antibiotic treatment duration in septic patients: a randomized
trial. Am J Respir Crit Care Med 2008, 177:498-505.
21. Tang BM, Eslick GD, Craig JC, McLean AS: Accuracy of procalcitonin for
sepsis diagnosis in critically ill patients: systematic review and meta-
analysis. Lancet Infect Dis 2007, 7:210-217.
22. Uzzan B, Cohen R, Nicolas P, Cucherat M, Perret GY: Procalcitonin as a
diagnostic test for sepsis in critically ill adults and after surgery or
trauma: a systematic review and meta-analysis. Crit Care Med 2006,
34:1996-2003.
23. Kumar A, Ellis P, Arabi Y, Roberts D, Light B, Parrillo JE, Dodek P, Wood G,
Kumar A, Simon D, Peters C, Ahsan M, Chateau D, Cooperative
Antimicrobial Therapy of Septic Shock Database Research Group: Initiation
of inappropriate antimicrobial therapy results in a fivefold reduction of
survival in human septic shock. Chest 2009, 136:1237-1248.
24. Meisner M, Tschaikowsky K, Hutzler A, Schick C, Schüttler J: Postoperative
plasma concentrations of procalcitonin after different types of surgery.
Intensive Care Med 1998, 24:680-684.
25. Karlsson S, Varpula M, Ruokonen E, Pettilä V, Parviainen I, Ala-Kokko TI,
Kolho E, Rintala EM: Incidence, treatment, and outcome of severe sepsis
in ICU-treated adults in Finland: the Finnsepsis study. Intensive Care Med
2007, 33:435-443.
26. Bone RC, Balk RA, Cerra FB, Dellinger RP, Fein AM, Knaus WA, Schein RM,
Sibbald WJ: Definitions for sepsis and organ failure and guidelines for
the use of innovative therapies in sepsis. The ACCP/SCCM Consensus
Conference Committee. American College of Chest Physicians/Society of
Critical Care Medicine. Chest 1992, 101
:1644-1655.
Karlsson et al. Critical Care 2010, 14:R205
/>Page 9 of 10
27. Knaus WA, Draper EA, Wagner DP, Zimmerman JE: APACHE II: a severity of
disease classification system. Crit Care Med 1985, 13 :818-829.
28. Le Gall JR, Lemeshow S, Saulnier F: A new Simplified Acute Physiology
Score (SAPS II) based on a European/North American multicenter study.
JAMA 1993, 270:2957-2963.
29. Vincent JL, Moreno R, Takala J, Willatts S, De Mendonça A, Bruining H,
Reinhart CK, Suter PM, Thijs LG: The SOFA (Sepsis-related Organ Failure
Assessment) score to describe organ dysfunction/failure. On behalf of
the Working Group on Sepsis-Related Problems of the European Society
of Intensive Care Medicine. Intensive Care Med 1996, 22:707-710.
30. Moreno R, Vincent JL, Matos R, Mendonça A, Cantraine F, Thijs L, Takala J,
Sprung C, Antonelli M, Bruining H, Willatts S: The use of maximum SOFA
score to quantify organ dysfunction/failure in intensive care. Results of a
prospective, multicentre study. Working Group on Sepsis related
Problems of the ESICM. Intensive Care Med 1999, 25:686-696.
31. Meisner M, Brunkhorst FM, Reith HB, Schmidt J, Lestin HG, Reinhart K:
Clinical experiences with a new semi-quantitative solid phase
immunoassay for rapid measurement of procalcitonin. Clin Chem Lab
Med 2000, 38:989-995.
32. Whang KT, Steinwald PM, White JC, Nylen ES, Snider RH, Simon GL,
Goldberg RL, Becker KL: Serum calcitonin precursors in sepsis and
systemic inflammation. J Clin Endocrinol Metab 1998, 83:3296-3301.
33. Mokart D, Merlin M, Sannini A, Brun JP, Delpero JR, Houvenaeghel G,
Moutardier V, Blache JL: Procalcitonin, interleukin 6 and systemic
inflammatory response syndrome (SIRS): early markers of postoperative
sepsis after major surgery. Br J Anaesth 2005, 94:767-773.
34. Harbarth S, Holeckova K, Froidevaux C, Pittet D, Ricou B, Grau GE, Vadas L,
Pugin J, Geneva Sepsis Network: Diagnostic value of procalcitonin,
interleukin-6, and interleukin-8 in critically ill patients admitted with
suspected sepsis. Am J Respir Crit Care Med 2001, 164:396-402.
35. Dorizzi RM, Polati E, Sette P, Ferrari A, Rizzotti P, Luzzani A: Procalcitonin in
the diagnosis of inflammation in intensive care units. Clin Biochem 2006,
39:1138-1143.
36. Brunkhorst FM, Wegscheider K, Forycki ZF, Brunkhorst R: Procalcitonin for
early diagnosis and differentiation of SIRS, sepsis, severe sepsis, and
septic shock. Intensive Care Med 2000, 26 Suppl 2:S148-S152.
37. Nakamura A, Wada H, Ikejiri M, Hatada T, Sakurai H, Matsushima Y,
Nishioka J, Maruyama K, Isaji S, Takeda T, Nobori T: Efficacy of procalcitonin
in the early diagnosis of bacterial infections in a critical care unit. Shock
2009, 31:586-591.
38. Müller F, Christ-Crain M, Bregenzer T, Krause M, Zimmerli W, Mueller B,
Schuetz P, PreHOSP Study Group: Procalcitonin levels Predict Bacteremia
in Patients with community-acquired Pneumonia: A prospective cohort
trial. Chest 2010, 138:121-129.
39. Meisner M, Tschaikowsky K, Palmaers T, Schmidt J: Comparison of
procalcitonin (PCT) and C-reactive protein (CRP) plasma concentrations
at different SOFA scores during the course of sepsis and MODS. Crit Care
1999, 3:45-50.
40. Charles PE, Ladoire S, Snauwaert A, Prin S, Aho S, Pechinot A, Olsson NO,
Blettery B, Doise JM, Quenot JP: Impact of previous sepsis on the
accuracy of procalcitonin for the early diagnosis of blood stream
infection in critically ill patients. BMC Infect Dis 2008, 8:163.
41. Charles PE, Ladoire S, Aho S, Quenot JP, Doise JM, Prin S, Olsson NO,
Blettery B: Serum procalcitonin elevation in critically ill patients at the
onset of bacteremia caused by either Gram negative or Gram positive
bacteria. BMC Infect Dis 2008, 8:38.
42. Martini A, Gottin L, Menestrina N, Schweiger V, Simion D, Vincent JL:
Procalcitonin levels in surgical patients at risk of candidemia. J Infect
2010, 60:425-430.
43. Novotny AR, Emmanuel K, Hueser N, Knebel C, Kriner M, Ulm K, Bartels H,
Siewert JR, Holzmann B: Procalcitonin ratio indicates successful surgical
treatment of abdominal sepsis. Surgery 2009, 145:20-26.
44. Schneider CP, Yilmaz Y, Kleespies A, Jauch KW, Hartl WH: Accuracy of
procalcitonin for outcome prediction in unselected postoperative
critically ill patients. Shock 2009, 31:568-573.
45. Hochreiter M, Kohler T, Schweiger AM, Keck FS, Bein B, von Spiegel T,
Schroeder S: Procalcitonin to guide duration of antibiotic therapy in
intensive care patients: a randomized prospective controlled trial. Crit
Care 2009, 13:R83.
doi:10.1186/cc9327
Cite this article as: Karlsson et al.: Predictive value of procalcitonin
decrease in patients with severe sepsis: a prospective observational
study. Critical Care 2010 14:R205.
Submit your next manuscript to BioMed Central
and take full advantage of:
• Convenient online submission
• Thorough peer review
• No space constraints or color figure charges
• Immediate publication on acceptance
• Inclusion in PubMed, CAS, Scopus and Google Scholar
• Research which is freely available for redistribution
Submit your manuscript at
www.biomedcentral.com/submit
Karlsson et al. Critical Care 2010, 14:R205
/>Page 10 of 10