Báo cáo y học: " Acute pancreatitis with organ dysfunction associates with abnormal blood lymphocyte signaling: controlled laboratory study" ppt
Bạn đang xem bản rút gọn của tài liệu. Xem và tải ngay bản đầy đủ của tài liệu tại đây (1.21 MB, 11 trang )
RESEARC H Open Access
Acute pancreatitis with organ dysfunction
associates with abnormal blood lymphocyte
signaling: controlled laboratory study
Jani Oiva
1*
, Harri Mustonen
1
, Marja-Leena Kylänpää
1
, Lea Kyhälä
1
, Krista Kuuliala
2
, Sanna Siitonen
3
,
Esko Kemppainen
1
, Pauli Puolakkainen
1
, Heikki Repo
2
Abstract
Introduction: Severe acute pancreatitis is associated with systemic inflammation, compensatory immune
suppression, secondary infections, vital organ dysfunction, and death.
Our study purpose was to delineate signaling profiles of circulating lymphocytes in acute pancreatitis complicated
by organ dysfunction.
Methods: Sixteen patients with acute pancreatitis, dysfunction of vital organ(s), and immune suppression
(proportion of HLA-DR Human Leukocyte Antigen - DR - positive monocytes < 80%) participated. Healthy
volunteers served as reference subjects. Using phospho-specific whole blood flow cytometry we studied
lymphocyte phosphorylation of nuclear factor-B (NFB), mitogen-activated protein kinases p38 and extracellular
signal-regulated kinases (ERK)1/2, and signal transducers and activators of transcription (STATs) 1, 3, and 6. Statistical
comparisons were performed with the Wilcoxon-Mann-Whitney test.
Results: In blood samples supplemented with tumor necrosis factor, E. coli or S. aureus, phosphorylation levels of
NFB were lower and levels of p38 were higher in patients with acute pancreatitis than healthy subjects. Low
NFB activation involved CD3+CD4+ and CD3+CD8+ lymphocytes. ERK1/2 phosphorylation induced by co-
stimulation with phorbol 12-myristate 13-acetate and calcium ionophore A23187 was depressed in patients. STAT3
was con stitutively activated in patients’ CD3+CD4+ and CD3+CD8+ lymphocytes. Also, IL-6-induced STAT1
phosphorylation was impaired while IL-4-induced STAT6 phosphorylation was enhanced.
Conclusions: Lymphocytes of pa tients with acute pancreatitis, organ dysfunction and immune suppression show
impaired NFB activation, which increases infection risk and enhanced p38 activation, which sustains inflammation.
Secondly, they indicate constitutive STAT3 activation, which may favor Th17 lineage of CD4+ lymphocyte
differentiation. Thirdly, they reveal impaired STAT1 activation and enhanced STAT6 activation, denoting a shift from
Th1 towards Th2 differentiation.
Introduction
Acute pancreatitis (AP) is usually a self-limiting disease
resolving within days. Some patients, however, develop
overwhelming systemic inflammation, which contributes
to the development of vital organ dysfunction, the major
cause of mortality in AP [1,2]. Systemic inflammation is
designated by activation of circulating cells of both the
innate immune system, such as monocytes [3], and the
adaptive immune system, such a s CD4+ T-helper (Th)
-lymphocytes, CD8+ -lymphocytes [4,5], and CD19+
B -lymphocytes [6]. Cellular activation results in the sys-
temic release of pro- and anti-inflammatory mediators,
such as tumor n ecrosis factor (TNF) and interleukin
(IL) -10 [7]. The latter promotes immune suppression,
increasing the risk of secondary infections and multiple
organ dysfunction syndrome [8-11]. Also, experimental
[12] and clinical [13] studies suggest that the host’s
defense against infection is further depressed as the Th1
* Correspondence:
1
Department of Surgery, Helsinki University Central Hospital, PO Box 340,
00290 HUS, Helsinki, Finland
Full list of author information is available at the end of the article
Oiva et al. Critical Care 2010, 14:R207
/>© 2010 Oiva et al.; licensee BioMed Central Ltd. This is an open access article distributed under the terms of the Creative Commons
Attribution License ( which permits unrestricted use, distribution, and repro duct ion in
any medium, pro vided the original work is properly cited.
subpopulation of CD4+ T-cells becomes more strongly
suppress ed than the Th2 cells in the course of AP, lead-
ing to Th1/Th2 cytokine imbalance.
The molecular mechanisms involved in the pathogen-
esis of systemic inflammation and s ubsequent immune
suppression include multiple signaling pathways and
families of transcription factors, such as signal transdu-
cers and activators of transcription (STATs), nuclear
factor-B(NFB), and members of the mitogen-
activated protein (MAP)-kinase family [14]. In lympho-
cytes, STAT1 is activated by IL-6 and pro-inflammatory
interferons [15,16], which support Th1 polarization of
Th-lymphocytes, STAT3 by anti-inflammatory IL-10
[17] and by IL-6, which supports the Th17 lineage of
lymphocyte differentiation [18] and STAT6 by IL-4,
which supports Th2 polarization of Th-cells [19]. The
lymphocyte NFB is activated by TNF [20,21], while
MAP-kinases ERK (extracellular signal-regulated kinase)
1/2 and p38 are phosphorylated by cytokine receptor
activation [22], or by co-stimulation of lymphocytes
with calcium ionophore and PMA (phorbol 12-myristate
13-acetate).
We recently described monocyte signaling profiles in
13 AP patients with vital organ dysfunction using phos-
pho-specific whole blood flow cytometry [23]. In t he
present study we describe signaling profiles of the
patients’ circulating lymphocytes.
Material and methods
Patients and controls
The study comprises 16 men with AP admitted to the
intensive care unit (ICU) at Helsink i University Central
Hospital. The first 13 patients, whose monocyte signal-
ing profiles are described in our previous study [23],
were admitted between September 2007 and January
2009 and the last three patients between January and
May 2010 (Table 1). In addition to severe AP, the inclu-
sion criterion for the study was that the proportion of
HLA-DR-positive monocytes in circulation was less
than 80%. Sixteen healthy volunteers (median age 45
years, range 25 to 66, 13 women) served as reference
subjects. The study protocol was approved by the Surgi-
cal Ethical Review Board of the Joint Authority for the
Hospital District of Helsinki and Uusimaa, and
informed consent was obtained from each patient, or
their next of kin.
The diagnosis of AP was based on typical clinical find-
ings (acute onset of epigastric pain, nausea, and vomit-
ing), elevated serum a mylase levels (more than three
times the upper reference limit), and/or typical findings
in computed tomography performed on all patients
within zero to two days after admission to ICU. The AP
severity was determined according to the At lanta classi-
fication [24].
Blood samples and study design
Blood samples were collected within three to five days
aft er the initial determination of the patients ’ monocyte
HLA-DR expression status. E ach patient had a reference
subject of his own, with the exception of two patients
who shared one reference subject. Of the two data sets
from this reference subject, the latter was excluded from
the data analyses. Parallel peripheral blood samples were
obtained from the patient and from his reference subject
on two consecutive days, with the exception of one
patient, who had different reference subje cts on Days 1
and 2. On Day 1, a 4-ml sample of peripheral venous
blood was taken (i) for the study of phosphorylation
promoted by soluble leukocyte agonists and (ii) for the
re-study of the proportion of HLA-DR-positive mono-
cytes. On Day 2, a 4-ml blood sample was taken for the
study of leukocyte phosphorylation in response to bac-
terial cells. The blood samples were collected into Fal-
con polypropylene tubes (Becton Dickinson, Lincoln
Park, NJ, USA) containing pyrogen-free citrate phos-
phate dextrose (ACD, Baxter Health Ca re Ltd, Norfolk,
England, UK, 0.14 ml/ml blood), kept at the room tem-
perature, and transported within 1 5 minutes to the
laboratory. All aliquots of the blood samples were sti-
mulated within four hours of sampling.
While the study was in progress the patients’ lympho-
cytes showed constitutive STAT3 activation, that is,
STAT3 RFU-values in resting cells were consistently
higher in patients than healthy subjects. The original
protocol was adapted to measure constitutive STAT3
activation and determinate the involved lymphocyte sub-
sets. The revised protocol was applied to patients 11 to
13 and the STAT3 part of the revised protocol to
patients 14 to 16 (Table 1).
Table 1 Characteristics of the patients
(n = 16)
Character Median (range)
Age, years 47 (30 to 74)
ICU stay, days 23 (4 to 54)
Respirator, days 18 (0 to 42)
Dialysis, days 9 (0 to 40)
Sampling time
1
, days 13 (3 to 39)
CRP at transfer to ICU, mg/l 230 (3 to 566)
APACHE at transfer to ICU 14 (8 to 20)
SOFA at transfer to ICU 5 (4 to 13)
CRP
2
, mg/ml 215 (80 to 451)
APACHE II
2
15 (6 to 24)
SOFA
2
8 (2 to 17)
Highest CRP (mg/l) 409 (207 to 566)
APACHE II, Acute Physiology and Chronic Health Evaluation II; CRP, C-reactive
protein; SOFA, Sequential Organ Failure Assessment.
1
Denotes time period
from hospital admission to day of blood sampling for lymphocyte functional
studies.
2
At day of blood sampling for lymphocyte functional studies.
Oiva et al. Critical Care 2010, 14:R207
/>Page 2 of 11
Biological agents and leukocyte agonists
We purchased fluorescein isothiocyanate (FITC)-conju-
gated monoclonal antibodies (mAbs) to CD14 clone
MjP9 (IgG
2b
), CD19 clone SJ25C1 (IgG
1
), CD4 clone
SK3 (IgG
1
), and CD8 clone SK1 (IgG
1
), and peridinine-
chlorophyll protein (PerCP)- conjugated mAb to CD3
clone SK7 (IgG
1
), phycoerythrin (PE)-conjugated anti-
HLA-DR mAb clone L243 (IgG
2a
) and its isotype con-
trol ( mouse IgG
2a
), Alexa 647-labeled phospho-specific
mAbs to pNF-kB p65 (pS529) clone K10-895.12.50
(IgG
2b
), STAT1 (pY701) clone 4a (IgG
2a
), ERK1/2
(pT202/pY204) clone 20A (IgG
1
), and PE-labeled phos-
pho-specific mAbs to STAT3 (pY705) clone 4/P-STAT3
(IgG
2a
) and STAT6 (Y641) clone18 (IgG
2a
)fromBec-
ton-Dickinson Biosciences (San Jose, CA, USA). Inflixi-
mab (Remicade®) was from Schering-Plough Co.
(Kenilworth, NJ, USA) and anakinra (Kineret®) from
Amgen Inc. (Thousand Oaks, CA, USA).
The recombinant cytokines TNF, IL-4, and IL-6 were
purchased from R&D (Minneapolis, MN, USA) and
phorbol-12-myristate-13-acet ate (PMA), E. coli O111:B4
lipopolysacharide (LPS), N-acetylmuramyll-alanyl-D-
isoglutamine (MDP), and calcium ionophore A23187
from Sigma (St. Louis, MO, USA).
S. aureus (IHT 61972) and E. coli (IH 3080) were kind
gifts from Jaana Vuopio, MD, PhD (The National Insti-
tute for Health and Welfare , Helsinki, Finland). S. epi-
dermidis was the strain ATCC 53103. Each stra in was
initially grown in a brain heart infusion (BHI) medium
for 18 hours at r oom temperature (E. co li)orat37°C
(S. aureus and S. epidermidis). After incubation, the
bacteria were pelleted by centrifugation, re-suspended in
fresh BHI me dium, and further cultured at 37°C for five
hours. The secondary cult ures were pelleted and washed
twice with phosphate buffered saline (PBS). From an ali-
quot of each cell suspension a diluted culture was made
to quantify viable bacteria. The rest of the bacteria were
pelleted and re-suspended in a glycerol-tryptone soya
broth medium and stored in 1.8-ml aliquots at -70°C.
Ex vivo stimulation and immunolabeling of blood
samples for three-color flow cytometry
Flow cytometry was first used by Fleisher and co-
workers [25] to demonstrate intracellular phosphoryla-
tion of STAT1 in density gradient-separated monocytes
activated ex vivo with IFN-g. We recently developed a
whole blood modification o f the method [26]. In the
present setup, lymphocytes were first delineated accord-
ing to their light scattering properties using electronic
gates and monocytes were recognized by CD14-FITC
label positivity and excluded. To study lymphocyte sub-
populations, the CD19-FITC-label was used to identify
B -lymphocytes and the CD3-PerCP-label was used in
combination with the CD4-FITC - or CD8-FITC- labels
to identify CD3+CD4+T lymphocytes and CD3+CD8+T
lymphocytes. The Alexa647-label was used to detect
phosphorylated forms of NF-B, STAT1, and ERK1/2
and the PE-label to detect phosphorylated STAT3 and
STAT6.
The 4-ml blood sample was divided into 90 μl aliquots
in Falcon polystyrene tubes (Becton Dickinson, Lincoln
Park, NJ, USA) and placed at 37°C. Aliquots of FITC-
conjugated mAbs to CD14, CD4, and CD8 were added
to the tubes. Next the tubes were supplemented with
TNF at the final concentration of 10 ng/ml (10 patients)
and incubated for 5 minutes at 37°C, IL-6 100 ng/ml
(13 patients) for 5 minutes, IL-4 100 ng/ml (10 patients)
for 5 minutes, a combination of PMA 1 μM and calcium
ionophore A23187 1 μM (10 patients) for 5 minutes,
LPS 100 ng/ml (10 patients) for 10 minutes, MDP 100
ng/ml (10 patients) for 20 minutes, E. coli 50 cells/leu-
kocyte (10 patients) f or 10 minutes, S. aureus 50 cells/
leukocyte ( 9 patients) for 20 minutes, or S. epidermidis
50 cells/leukocyte (9 pa tients ) for 40 minutes. Reference
tubes were left withou t stimulus. In one experimental
series infliximab (final concentration 10 μg/ml), anakinra
(100 μg/ml), or both were mixed with the blood
obtained from healthy volunteers before addition of
bacteria.
After incubation, red c ell lysis, leukocyte fixation, and
leukoc yte permeabilization were performed according to
BD Phosflow Protocol III for Human Whole Blood [27],
as described in detail. Briefly, a 1× BD PhosFlow Lyse/
Fix Buffer (1.9 ml) pre-warmed to 37°C was added to
each tube, they were then incubated for 10 minutes at
37°C, and washed once with Hank’s balanced salt solu-
tion (Life Technologies, Paisley, UK). For permeabiliza-
tion, the cell pellet was re-suspended in 1 ml of BD
Phosflow Perm Buffer III, pre-cooled at -20°C. The
tubes were stored at -20°C until staining with phosphos-
pecific mAbs. After permeabilization, the cell samples
were washed twice with ice-cold BD Pharmingen Stain
Buffer (BD Sciences, San Jose, CA, USA) and re-
suspended in 100 μl of the buffer. Aliquots of Alexa647-
and PE-lab elled phosphospecific mAbs were then added
to the stimulus-t reated samples and respective reference
samples. Also, aliquots of CD3-PerCP mAb were added
at this stage, because PerCP did not withstand the per-
meabilization procedure. The samples were further incu-
bated i n the dark for 30 minutes at 0°C, washed once,
and r e-suspended in 500 μl of the ice-cold stain buffer.
The samples were stored at 0°C and analyzed by flow
cytometry within three hours.
Data acquisition and analysis were done with a FACS
Calibur flow cytometer and Cell Quest software (BD
Sciences, San Jose, CA, USA). A total of 1×10
4
lympho-
cytes, 2×10
3
CD3+CD4+ T lymphocytes, 2×10
3
CD3+
CD8+ T lymphocytes, and 2×10
3
CD19+B lymphocyte s
Oiva et al. Critical Care 2010, 14:R207
/>Page 3 of 11
were collected. Finally, appropriate Alexa647- and PE-
histograms were developed to determine the intracellu-
lar signaling profiles of the cells.
First, data are presented as median fluorescence inten-
sity, in other words, median RFU (relative fluorescence
units) of the whole lymphocyte population, and second, as
a proportion of positively fluorescing cells and third, as
mean fluorescence intensity of the positively f luorescing
cells. If a patient’s lymphocytes respond normally, but in
reduced number compared to healthy subjects, the mean
fluorescence intensity of positively fluorescing cells would
remain the same. On the other hand, if a patients’ lympho-
cytes were in a reduced phosphorylation state, this would
lead to decreased mean fluorescence intensity of positively
fluorescing cells. The proportion of positively fluoresci ng
cells was determined using a threshold method, where an
electronic gate was manually set to include the brightest 2
to 4% of the cells in non-stimulated sample. Then the
same gate served to determine the proportion of positively
fluorescing cells in the respective stimulus-treated sample.
Thus, the values < 5% indicate cells not responding to the
stimulus. During the study, it emerged that in a proportion
of a patient’s lymphocyte STAT3 was constitutively active.
To determine the proportion of lymphocytes showing
constitutive activated STAT3 lymphocytes, the electronic
gate of non-stimulated lymphocytes of the healthy subject
studied concomitantly was used in the analysis of the
patients’ samples.
The coefficient of variation was 5% within experiments
and 10% between experiments.
The activation of signaling proteins have been con-
firmed using Western blot analyses by us [26] concern-
ing STAT1 and by Grammer [28] concerning multiple
components of NFB, STAT and MAP-kinase pathways.
Monocyte surface expression of HLA-DR, expressed as
the proportion (%) of monocytes positive for HLA-DR
fluorescence, was determined as described previously [10].
Statistical analysis
Results are shown in mean ± SEM or median (range).
Using the nonparametric Wilcoxon-Mann-Whit ney test
we carried out statistical comparisons between the
groups. Statistic al analyses were performed with SPSS
software (v15, SPSS Inc, Chicago, IL, USA). Probabilities
were regarded as statistically significant at the 0.05 level.
Results
Patients
The etiology for AP was alcohol consumption in 15
patients and biliary stones in 1 patient. Patient charac-
teristics are presented in Table 1. All patients were men.
One patient had recurrent AP. All patients developed
organ failure: 15 needed mechanical ventilation and 9
needed hemodialysis. Ten patients underwent surgery,
11 had infections, and 3 died due to multiple organ fail-
ure(Table2).TheproportionofHLA-DR-positive
monocytes was 55.0 ± 4.1% and 93 .1 ± 3.4% (P <0.001)
in patients and healthy reference subject.
NFB and p38 phosphorylation
We used three-color flow cytometry to measure phos-
phorylation levels of NFB p65 (pNFB, Fi gure 1) and
p38 (pp38, Table 3) of lymphocytes in whole blood sam-
ples supplemented with TNF or whole bacteria of
E. coli, S. aureus,andS. epidermidis. We measured
phosphorylation levels in all lymphocytes and, in the
case of TNF also in the lymphocytes subclasses, includ-
ing CD3+CD4+ T lymphocytes, CD3+CD8+ T lympho-
cytes, and CD19+ B lymphocytes.
Figure 1A shows t hat TNF stimulation increased
pNFB fluorescence intensity values in all lymphocytes,
and in CD3+CD4+ and CD3+CD8+ lymphocyte subsets,
but not in CD19+ lymphocyte subset of healthy subjects.
In patients, the TNF-induced responses of all lympho-
cytes, CD3+CD4+ lymphocytes, and CD3+CD8+ lym-
phocytes were significantly lower than those of healthy
subjects. The pNFB levels of the non-stimulated lym-
phocytes were comparable.
Further analysis of the data (Figure 1B) showed that the
proportions of pNFB-positive lymphocytes in TNF-
treated samples were lower in patients than in healthy
subjects among all lymphocytes, CD3+CD4+ T lympho-
cytes, and CD3+CD8+ T lymphocytes, indicating that
patients had a reduced number of TNF responding cells.
In addition, the pNFB fluorescence intensity of the TNF
responding cells was lower in patien ts than in healthy
Table 2 Outcome of the patients
(n = 16)
Complication Number of patients
Local complication, number of patients 8
Pancreatic necrosis 5
Pseudocyst 2
Both 1
Operation, number of patients 10
Laparotomy and open abdomen 4
Necrosectomy 5
ERCP 1
Infectious complication 11
Sepsis 2
Abdominal abscess 3
Pneumonia 2
Sepsis and abdominal abscess 2
Abdominal abscess and pneumonia 2
Died
1
3
ERCP, Endoscopic Retrograde Cholangiopancreatography.
1
Patients died on
the 4
th
,19
th
and 24
th
ICU day.
Oiva et al. Critical Care 2010, 14:R207
/>Page 4 of 11
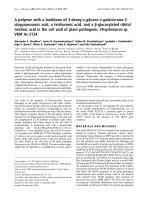
Figure 1 NF-B signaling. Levels of phosphorylated NF-Bp65(pNF-B) in lymphocytes (Ly) of healthy subjects (circles) and patients
(quadrangles) with acute pancreatitis were measured in whole blood samples left without supplement (open symbols) or supplemented (closed
symbols) with TNF (10 ng/ml, five minutes), E. coli, S. aureus, S. epidermidis, LPS, or MDP. Responses to TNF, determined as: A. Fluorescence
intensity (FI) of all Ly and subsets of Ly (N = 9 to 10); B. As a proportion of pNFB-positive Ly and their FI. C. The sample histograms of TNF-
stimulated (white) and non-stimulated (gray) Ly. The M1 (marker) denotes proportion of pNF-B-positive Ly. D. Responses to bacteria, LPS, and
MDP, determined as the FI of all Ly (N = 8 to 10). E. As proportion of pNFB-positive cells among all Ly and their FI. RFU, relative fluorescence
units. In A and D, horizontal lines denote median, and in B and E, data are given as mean ± SEM. *P < 0.05, **P < 0.01, *** P < 0.001.
Oiva et al. Critical Care 2010, 14:R207
/>Page 5 of 11
subjects, in all lymphocytes, CD3+CD4+ cells and CD3
+CD8+ cells. The shape of lymphocyte histograms (Figure
1C), and those of lympho cyte subsets (not shown), were
uniform and did not reveal any lymphocyte s ubpopulations.
Whole bacteria, but not LPS or MDP, increased the
pNFB levels of all lymphocytes in blood samples from
healthy subjects (Figure 1D). The pNFB fluorescence
intensities induced by whole bacteria were lower in
patients than in healthy subjects. The proportions of
pNFB-positive lymphocytes were significantly lower in
patients’ cells than control cells exposed to E. coli and S.
epidermidis (Figure 1E), indicating that patients had
fewer responding cells. The difference in pNFB fluores-
cence intensities of the responding cells between
patients and healthy subjects was not significant.
We supplemented the culture tubes with anti-TNF mAb
infliximab, IL-1ra anakinra, or a combination of them to
investigate whether bacteria-induced ly mphocyte activation
was secondary to phagocyte-derived cytokines (Figure 2).
Infliximab decreased, although not completely, NFBacti-
vation induced by S. epidermidis, but not by E. coli or S.
aureus. A nakinra had no effect on pNFB levels.
The fluorescence intensity of pp38 of all lymphocytes,
induced by TNF, E. coli,orS. aureus, was higher in patients
than in healthy subjects ( Table 3). The proportions of posi-
tively fluorescing cells, induced by E. coli or S. aureus,were
higher in patients. The fluorescence intensity of the pp38-
positive cells was also higher in patients than controls, but
the difference was not statistically significant.
ERK1/2 phosphorylation
The pERK1/2 levels of all lymphocytes induced by the
combination of PMA and calcium ionophore were lower
in the patients (P = 0.034, Figure 3). The proportion of
pERK1/2-positive lymphocytes was also lowe r in the
patient group (22.8 ± 7.8% vs 43.3 ± 5.1%, P = 0.043),
indicating that the responding cells in patients were
decreased. The fluorescence intensity of pERK1/2 posi-
tive cells of patients and healthy subjects were compar-
able (12.2 ± 0.6 RFU vs. 11.5 ± 0.6 RFU, P > 0.05).
STAT3 phosphorylation
In the non-stimulated samples, the pSTAT3 fluores-
cence intensity of all lymphocytes was significantly
Table 3 p38 signaling
Stimulation TNF LPS MDP
FI (RFU) of pp38 Ly Healthy subject 2.5 ± 0.1 1.9 ± 0.1 1.9 ± 0.1
Patient 3.4 ± 0.5* 2.1 ± 0.1 2.0 ± 0.1
% of pp38 positive Ly Healthy subject 18.4 ± 2.3 3.4 ± 0.3 3.4 ± 0.4
Patient 22.1 ± 2.9 4.8 ± 0.6 3.2 ± 0.3
FI (RFU) of pp38 positive Ly Healthy subject 6.4 ± 0.3 5.5 ± 0.4 5.1 ± 0.4
Patient 7.1 ± 0.6 6.6 ± 1.2 7.3 ± 1.8
Stimulation E. coli S. aureus S. epidermidis
FI (RFU) of pp38 Ly Healthy subject 2.0 ± 0.1 2.1 ± 0.1 2.1 ± 0.1
Patient 2.7 ± 0.2** 2.9 ± 0.3* 2.2 ± 0.1
% of pp38 positive Ly Healthy subject 8.3 ± 0.9 6.1 ± 0.6 6.9 ± 0.7
Patient 15.6 ± 1.8** 16.0 ± 3.5* 5.4 ± 0.9
FI (RFU) of pp38 positive Ly Healthy subject 6.3 ± 1.0 5.2 ± 0.4 5.1 ± 0.3
Patient 6.9 ± 0.7 7.5 ± 1.1 7.3 ± 1.3
FI, fluorescence intensity; LPS, lipopolysaccharide; Ly, lymphocytes; MDP, N-acetylmuralyl-alanyl-D-isoglutamine; TNF-a, tumor necrosis factor-a. N = 9 to 10, *P <
0.05, **P < 0.01 as compared to healthy subject
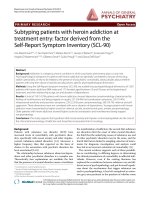
Figure 2 The effects of infliximab and anakinra on bacteria-
induced NF-B phosphorylation in lymphocytes. Whole blood
samples of healthy subjects were left without cytokine inhibitor or
mixed with infliximab, an anti-TNF mAb, anakinra, an IL-1 receptor
antagonist, or both, and then left without further supplement or
supplemented with E. coli, S. aureus,orS. epidermidis.*P < 0.05 (N =
4 to 6).
+
Significantly different (P < 0.05) from respective E. coli, S.
aureus, and S. epidermidis groups with the exception of S.
epidermidis with infliximab only (P = 0.055), or infliximab + anakinra
(P = 0.054).
Oiva et al. Critical Care 2010, 14:R207
/>Page 6 of 11
higher in patients than healthy subjects (P <0.001,
Figure 4A). The shapes of t he patients’ pSTAT3 histo-
grams were biphasic (Figure 4B), indicating the presence
of an activated cells subset . To evaluat e the proportions
of pSTAT3 positive cells in patient samples, the electro-
nic gate of healthy subjects lymphocytes was applied to
the patient lymphocytes. The prop ortion of p STAT3-
positive cells was higher in patients than in healthy sub-
jects (42.0 ± 4.7% vs 2.6 ± 0.1%, P < 0.001, Figure 4C).
In the IL-6-treated samples, the proportion of
pSTAT3 positive lymphocytes in patients was 66.5 ±
3.1% and in healthy subjects 58.6 ± 2.3% (P > 0.05). The
fluorescence intensity values of positively fluorescing
cells of patients and healthy subjects were 27.1 ± 2.2
and 25.5 ± 2.8 (P > 0.05).
The lymphocyte subgroup analysis of non-stimulated
cells showed that patients’ CD3+CD4+ lymphocytes, com-
pared to reference cells, had higher pSTAT3 levels,
defined as fluorescence intensity of all CD3+CD4+ cells
(Figure 4D), the proportion of pSTAT3-positive cells
(Figure 4E), and fluorescence intensity of pSTAT3-positive
cells (Figure 4F). The proportion of pSTAT3 positive CD+
CD8+ lymphocytes was higher in patients (Figure 4E).
STAT1 and STAT6 phosphorylation
The patients had lower IL-6 induced pSTAT1 levels
than the healthy subjects, determined as fluorescence
intensity of all lymphocytes (P = 0.058, Figure 5A), p ro-
portionofpSTAT1positivecells,andfluorescence
intensity of pSTAT1 positive cells (P < 0.05, Table 4).
The pSTAT6 levels of all lymphocytes induced by IL-4
were high er in patients than in hea lthy subjects (Figure
5B). The proportion of pSTAT6 positive cells and the
fluorescence intensity of them were also higher in
patients, but the difference was not significant (Table 4).
Discussion
Our results show multiple aberrations in pro- and anti-
inflammatory signaling pathways of lymphocytes, deter-
mined b y phos pho-specific whole blood flow cytometry,
in AP patients with vital organ dysfunction and immune
suppression. Patients’ lymphocytes showed decreased
NFB phosphorylation in whole blood samples supple-
mented with exogenous TNF. T he defect appeared to
involve all TNF-responding lymphocytes rather than a
subset, because the pNFBhistogramswereuniform.
Both the p roportion of pNFB-positive cells and their
fluorescence intensity were also reduced among CD3+
CD4+ and CD3+CD8+ T lymphocytes. NFB phosphor-
ylation promoted by E. coli, S. aureus,andS. epidermi-
dis was also reduced. Lymphocyte activation was
probably secondary to phlogi stic mediators generated in
whole blood samples supplemented with bacteria.
Indeed, the TNF-blocking agent infliximab in co-culture
with S. epidermidis,butnotwithE. coli or S. aureus,
reduced NFB phosphorylation, while the IL-1 receptor
antagonist, anakinra, had no effect, suggesting that lym-
phocyte activation involved TNF among other factor(s).
We have recently found that monocytes of the patients
also showed reduced NFB phosphorylation in response
to bacterial stimuli [23], which agrees with our finding
that TNF production by anergic monocytes is reduced
[29]. Colle ctively, the above data shows disturba nces in
collaboration between patien ts’ lymphocytes and mono-
cytes. The impaired collaboration, together with a signif-
icant reduction of circulating T- and B-lymphocytes in
severe AP [13, 30] may contribute to the development of
secondary infections in the patients. The risk of infec-
tions, however, remains to be determined in prospective
follow-up studies of leukocyte NFBphosphorylation
profiles in relation to clinical outcome.
In contrast to NF B activation, the proportion of
pp38-positive lymphocytes induced by E. coli or S. aur-
eus were higher in patients than reference subjects, indi-
cating that patients had an increased number of
responding cells. Of note, the lymphocytes were double-
staine d with pNFB and pp38 mAbs, and, consequently,
activity of the two signaling pathways could be evaluated
simultaneously. Unlike lymphocytes, the p38 phosphory-
lation of the patients’ monocytes was normal [23]. Given
that MAP-kinases are associated with the development
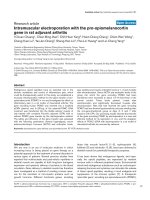
Figure 3 ERK1/2 signaling. Levels of ERK1/2 phosphorylation in
lymphocytes of healthy subjects (circles) and patients (quadrangles)
were measured in whole blood samples without supplement (open
circles) or supplemented (closed symbols) with combination of PMA
(1 μM) and Ca-ionophore (1 μM). RFU, relative fluorescence units. *P
< 0.05 (N = 8 to 10).
Oiva et al. Critical Care 2010, 14:R207
/>Page 7 of 11
Figure 4 STAT3 signaling. Levels of phosphorylated STAT3 (pSTAT3) in lymphocytes of healthy subjects (circles) and patients (quadrangles) in
whole blood samples without supplement (open symbols) or supplemented (closed symbols) with IL-6 (100 ng/ml, five minutes). A.
Fluorescence intensity (RFU, relative fluorescence units); B. sample histograms; C. proportion of pSTAT3-positive cells among all lymphocytes (N =
12 to 13); D. Fluorescence intensity; E. proportion of pSTAT3-positive lymphocytes among; F. fluorescence intensity of pSTAT3-positive
lymphocytes among subsets of non-stimulated lymphocytes. Horizontal lines in A and C-F denote median and M1 (marker) in B denotes
proportion of pSTAT3-positive lymphocytes. *P < 0.05, **P < 0.01, *** P < 0.001.
Oiva et al. Critical Care 2010, 14:R207
/>Page 8 of 11
of systemic inflammation [14], o ur finding raises the
question of whether enhanced p38 activation provid es a
target for immune suppression in AP patients or if it
represents a vital counter-reaction of cells to inhibit
NFB, and should therefore be strengthened rather than
depressed.
Phosphorylation of the other MAP-kinase protein
ERK1/2 was depressed in this study. ERK1/2 is function-
ally related to the migration of inflammatory cells,
including lymphocytes [31]. Monocytes of our patients
showed low pERK1/2 levels and poor transmigration
in vitro, w hereas their pp38 levels were normal [23].
The possibility that the inhibition of p38 expression and
upregulation of ERK1/2 expression is beneficial in
human AP, as suggested by studies in experimental AP
[32], warrants further studies.
The results show that STAT3 is constitutively acti-
vated in the patients’ lymphocytes, particularly in CD3+
CD4+ and CD3+CD8+ T-lymphocytes. T he constitutive
STAT3 activation was confined to lymphocytes and did
not o ccur in the patients’ monocytes [23]. Constitutive
STAT3 expression has been described in a variety of
disorders [33-35] and may involve a complex crosstalk
between different signaling pathways [36]. Because
STAT3 mediates anti-inflammatory signals its constitu-
tive activation may denote an a ttempt to down-regulate
inflammation. The activation was partial and could be
completed with IL-6, which promoted pSTAT3 le vels in
patients’ lymphocytes similar to those in reference lym-
phocytes of hea lthy subjects. Unlike lymphocytes, the
IL-6 induced STAT3 phosphorylation of the patients’
monocytes was depressed [23]. Thus, STAT3 signaling
pathway was more impaired in monocytes than in lym-
phocytes. In addition to IL- 6, STAT3 is activated by
IL-10, and circulating levels of b oth are elevated in AP
patients [11], thus possibly contributing to the constitu-
tive pSTAT3 expression. In this context it is of interest
that IL-6 together with IL-21 and IL-23 promote sus-
tained STAT3 activation, which favors the Th17 devel-
opmental program of CD4+ l ymphocytes [18]. Serum
Figure 5 STAT1 and STAT6 signa ling. Levels of A.pSTAT1fluorescenceintensity(FI);B. pSTAT6 F I in lymphoc ytes (Ly) o f healthy subje cts
(circles) and patients (quadrangles) in whole blood samples left without supplement (open symbols) or supplemented (closed symbols) with IL-6
(100 ng/ml, five minures) in A and IL-4 (100 ng/ml, five minutes) in B. RFU, relative fluorescence units. *P < 0.05.
Table 4 The proportions of pSTAT1- or pSTAT6-positive
lymphocytes (Ly) and their fluorescence intensity (FI)
Transcription factor pSTAT1 pSTAT6
Stimulation IL-6 IL-4
% of pSTAT-positive Ly Healthy subject 22.5 ± 2.8 37.0 ± 5.8
Patient 13.8 ± 1.6* 47.6 ± 5.1
FI (RFU) of pSTAT-positive Ly Healthy subject 11.4 ± 0.4 5.8 ± 0.3
Patient 9.7 ± 0.2* 6.3 ± 0.3
RFU, relative fluorescence units. *P < 0.05.
Oiva et al. Critical Care 2010, 14:R207
/>Page 9 of 11
levels of IL-17 were also elevated and served as prognos-
tic markers in patients with severe AP [37]. The Th17
immune pathway has not, to our knowledge, been thor-
oughly explored in patients with AP. If involved in the
pathogenesis of tissue injury in severe AP, the Th17
pathway may reveal novel prognostic markers and thera-
peutic possibilities.
STAT1 is activated by multiple cytokines [15,16] and
associated with pro-inflammatory signaling and devel-
opment of inflammatory tissue injury. We used IL-6 to
phosphorylate STAT1 and found lower levels in
patients’ lymphocytes than in reference cells. The pro-
portion of pSTAT1-positive cells and their fluores-
cence intensity were also lower, indicating that the
defect involved all IL-6-responding lymphocytes rather
than a subset of them. Also the patients’ monocytes
were depressed [23]. Unlike pSTAT1 levels, the IL-4-
induced levels of p-STAT6, which mediates Th2
signals and is associated with less injurious tissue reac-
tions, were higher in patients’ cells. The results suggest
that the patients’ immune system tries to inhibit
inflammatory tissue injury by shifting the tissue-
destructive Th1 type of immune response to the less
injurious Th2 type. Our results are in accordance with
the findings regarding experimental AP [12] and
patients with AP, indicating that although both Th1
and Th2 cytokines are elevated, the m agnitude of ele-
vation of the latter is much higher [13].
Taken together, our data concerning the patients’ lym-
phocytes and monocytes indicate that signaling path-
ways are more impaired in monocytes. The strong
depression of monocytes is meaningful because mono-
cytes are powerful mediators of tissue destruction.
Despite our findings being in accordance with clinical
findings and current concepts of immune pathogenesis
of severe systemic inflammation, the data should be
interpreted with caution. First, the study was confined
to a limited number o f patients, who had vital organ
dysfunction and whose clinical outcome and immune
inflammatory status were reasonably comparable. We
focused on these patients to screen for t he affected sig-
naling profiles in the most severe form of AP. In the
future, the aberrant profiles of lymphocytes and mono-
cytes [23] need to be studied prospectively during fol-
low-up of patients with varying AP severi ty. Second,
phospho-specific whole blood flow cytometry is suscep-
tible to methodological errors. A meticulous sample
handl ing is needed to avoid inappropriate cell activation
ex vivo [23]. Another critical step is permeabilization of
the cells, because it permits the phospho-specific anti-
body molecules to enter the intracellular compartments.
Leukocyte activation may increase cellular resistance to
membrane-active agents [ 38]. Although we cannot
exclude the possibility that patient lymphocytes are
more resistant to permeabilization, such a difference is
not supported by our findings that pSTAT3 levels were
constitutively increased in the patient lymphocytes and
double-stained lymphocytes sho wed simultaneously
enhanced p38 activation and depress ed NFB activation
in the same cell. Considering caveats, our present results
and previ ous studies [21,23,26] suggest that whole blood
phosphor-specific flow cytometry is a suitable method
for immune monitoring of patients with systemic
inflammation.
Conclusions
Our results show a variety of aberrations in the signaling
profile of lymphocytes, which are in accordance with
clinical data and the immune status of the patients.
Although the data are preliminary, because of confine-
ment to a limited number of patients with the most
severe disease form, the results encourage study of the
possibility that prospective monitoring of lymphocyte
signaling profiles may ai d in predicting AP outcome and
provide novel targets for immune therapy.
Key messages
• Signaling profiles of lymphocytes provide a novel
means for immune monitoring of patients with sys-
temic inflammation.
• Our data show, for the first time, that in acute
pancreatitis complicated by vital organ dysfunction
multiple aberrations occur in lymphocyte si gnaling
profiles.
• The possibiliti es that the aberrations predict organ
dysfunction and reveal novel means for targeted
therapy warrant further studies.
Abbreviations
AP: acute pancreatitis; APACHE II: Acute Physiology and Chronic Health
Evaluation II; BHI: brain heart infusion; CRP: C-reactive protein; E. coli:
Escherichia coli; ERCP: Endoscopic Retrograde Cholangiopancreatography;
ERK: extracellular signal regulated kinase; FI: fluorescence intensity; FITC:
fluorescein isothiocyanate; HLA-DR: human leukocyte antigen -DR; IFN-g:
interferon-g; IL: interleukin; IL-1ra: IL-1 receptor antagonist; LPS:
lipopolysaccharide; Ly: lymphocyte; MAP: mitogen activated protein; MDP: N-
acetylmuralyl-alanyl-D-isoglutamine; NFB: nuclear factor B; pNFB:
phosphorylated NFB; PBS: phosphate buffered saline; PE: phycoerythrin;
PerCP: peritidine-chlorophyll protein; PMA: phorbol-12-myristate-13-acetate;
pp38: phosphorylated p38; pSTAT: phosphorylated STAT; RFU: relative
fluorescence unit; S. aureus: Staphylococcus aureus ; S. epidermidis:
Staphylococcus epidermidis; SEM: standard error of the mean; SOFA:
Sequential Organ Failure Assessment; STAT: signal transducer and activator
of transcription; TNF-a: tumor necrosis factor-a
Acknowledgements
The authors thank Ms. Eine Virolainen and Ms. Sanna Vainionpää for
excellent technical assistance.
Author details
1
Department of Surgery, Helsinki University Central Hospital, PO Box 340,
00290 HUS, Helsinki, Finland.
2
Department of Bacteriology and Immunology,
University of Helsinki, The Haartman Institute, PO Box 21, 00014 University of
Oiva et al. Critical Care 2010, 14:R207
/>Page 10 of 11
Helsinki, Helsinki, Finland.
3
Laboratory Services (HUSLAB), Helsinki University
Central Hospital, PO Box 720, 00290 HUS, Helsinki, Finland.
Authors’ contributions
JO collected clinical data and participated in data analyses and the writing
of the manuscript. HM participated in design of the study and drafting of
the manuscript and performed statistical analysis. MLK and LK participated in
design and coordination of the study and drafting of the manuscript. KK
participated in flow cytometry and drafting of the manuscript. SS was
responsible for the flow cytometry and participated in drafting of the
manuscript. EK and PP participated in design and coordination of the study
and helped draft the manuscript. HR conceived the study, participated in its
design, and helped draft the manuscript.
Competing interests
The authors declare that they have no competing interests.
Received: 15 August 2010 Revised: 27 October 2010
Accepted: 18 November 2010 Published: 18 November 2010
References
1. Tenner S, Sica G, Hughes M, Noordhoek E, Feng S, Zinner M, Banks PA:
Relationship of necrosis to organ failure in severe acute pancreatitis.
Gastroenterology 1997, 113:899-903.
2. Halonen KI, Pettilä V, Leppäniemi AK, Kemppainen EA, Puolakkainen PA,
Haapiainen RK: Multiple organ dysfunction associated with severe acute
pancreatitis. Crit Care Med 2002, 30:1274-1279.
3. Kylanpaa ML, Repo H, Puolakkainen PA: Inflammation and
immunosuppression in severe acute pancreatitis. World J Gastroenterol
2010, 16:2867-2872.
4. Pezzilli R, Billi P, Gullo L, Beltrandi E, Maldini M, Mancini R, Incorvaia L,
Miglioli M: Behavior of serum soluble interleukin-2 receptor, soluble CD8
and soluble CD4 in the early phases of acute pancreatitis. Digestion 1994,
55:268-273.
5. Beger HG, Gansauge F, Mayer JM: The role of immunocytes in acute and
chronic pancreatitis: when friends turn into enemies. Gastroenterology
2000, 118:626-629.
6. Mora A, Perez-Mateo M, Viedma JA, Carballo F, Sanchez-Paya J, Liras G:
Activation of cellular immune response in acute pancreatitis. Gut 1997,
40:794-797.
7. Davies MG, Hagen PO: Systemic inflammatory response syndrome. Br J
Surg 1997, 84:920-935.
8. Garcia-Sabrido JL, Valdecantos E, Bastida E, Tellado JM: The anergic state as
a predictor of pancreatic sepsis. Zentralbl Chir 1989, 114:114-120.
9. Richter A, Nebe T, Wendl K, Schuster K, Klaebisch G, Quintel M, Lorenz D,
Post S, Trede M: HLA-DR expression in acute pancreatitis. Eur J Surg 1999,
165:947-951.
10. Kylanpaa-Back ML, Takala A, Kemppainen E, Puolakkainen P, Kautiainen H,
Jansson SE, Haapiainen R, Repo H: Cellular markers of systemic
inflammation and immune suppression in patients with organ failure
due to severe acute pancreatitis. Scand J Gastroenterol 2001, 36:1100-1107.
11. Mentula P, Kylanpaa ML, Kemppainen E, Jansson SE, Sarna S,
Puolakkainen P, Haapiainen R, Repo H: Early prediction of organ failure by
combined markers in patients with acute pancreatitis. Br J Surg 2005,
92:68-75.
12. Ueda T, Takeyama Y, Yasuda T, Takase K, Nishikawa J, Kuroda Y: Functional
alterations of splenocytes in severe acute pancreatitis. J Surg Res 2002,
102:161-168.
13. Pietruczuk M, Dabrowska MI, Wereszczynska-Siemiatkowska U, Dabrowski A:
Alteration of peripheral blood lymphocyte subsets in acute pancreatitis.
World J Gastroenterol 2006, 12:5344-5351.
14. Matsuda N, Hattori Y: Systemic inflammatory response syndrome (SIRS):
molecular pathophysiology and gene therapy. J Pharmacol Sci 2006,
101:189-198.
15. Brierley MM, Fish EN: Stats: multifaceted regulators of transcription. J
Interferon Cytokine Res 2005, 25:733-744.
16. Durbin JE, Hackenmiller R, Simon MC, Levy DE: Targeted disruption of the
mouse Stat1 gene results in compromised innate immunity to viral
disease. Cell 1996, 84:443-450.
17. Murray PJ: STAT3-mediated anti-inflammatory signalling. Biochem Soc
Trans 2006, 34:1028-1031.
18. Egwuagu CE: STAT3 in CD4+ T helper cell differentiation and
inflammatory diseases. Cytokine 2009, 47:149-156.
19. Hebenstreit D, Wirnsberger G, Horejs-Hoeck J, Duschl A: Signaling
mechanisms, interaction partners, and target genes of STAT6. Cytokine
Growth Factor Rev 2006, 17:173-188.
20. Baud V, Karin M: Signal transduction by tumor necrosis factor and its
relatives. Trends Cell Biol 2001, 11:372-377.
21. Stjernberg-Salmela S, Ranki A, Karenko L, Siitonen S, Mustonen H,
Puolakkainen P, Sarna S, Pettersson T, Repo H: Low TNF-induced NF-
kappaB and p38 phosphorylation levels in leucocytes in tumour necrosis
factor receptor-associated periodic syndrome. Rheumatology (Oxford)
2010, 49:382-390.
22. Dodeller F, Schulze-Koops H: The p38 mitogen-activated protein kinase
signaling cascade in CD4 T cells. Arthritis Res Ther 2006, 8:205.
23. Oiva J, Mustonen H, Kylanpaa ML, Kyhala L, Alanara T, Aittomaki S,
Siitonen S, Kemppainen E, Puolakkainen P, Repo H: Patients with acute
pancreatitis complicated by organ failure show highly aberrant
monocyte signaling profiles assessed by phospho-specific flow
cytometry. Crit Care Med 2010, 38:1702-1708.
24. Bradley EL: A clinically based classification system for acute pancreatitis.
Arch Surg 1993, 128:586-590.
25. Fleisher TA, Dorman SE, Anderson JA, Vail M, Brown MR, Holland SM:
Detection of intracellular phosphorylated STAT-1 by flow cytometry. Clin
Immunol 1999, 90:425-430.
26. Vakkila J, Nieminen U, Siitonen S, Turunen U, Halme L, Nuutinen H,
Mustonen H, Puolakkainen P, Farkkila M, Repo H: A novel modification of a
flow cytometric assay of phosphorylated STAT1 in whole blood
monocytes for immunomonitoring of patients on IFN alpha regimen.
Scand J Immunol 2008, 67:95-102.
27. BD Biosciences. [ />display_product.php?keyID=94#3].
28. Grammer AC, Fischer R, Lee O, Zhang X, Lipsky PE: Flow cytometric
assessment of the signaling status of the human B lymphocytes from
normal and autoimmune individuals. Arthritis Res Ther 2004, 6:28-38.
29. Docke WD, Randow F, Syrbe U, Krausch D, Asadullah K, Reinke P, Volk HD,
Kox W: Monocyte deactivation in septic patients: restoration by IFN-
gamma treatment. Nat Med
1997, 3:678-681.
30. Takeyama Y, Takas K, Ueda T, Hori Y, Goshima M, Kuroda Y: Peripheral
lymphocyte reduction in severe acute pancreatitis is caused by
apoptotic cell death. J Gastrointest Surg 2000, 4:379-387.
31. Yessoufou A, Ple A, Moutairou K, Hichami A, Khan NA: Docosahexaenoic
acid reduces suppressive and migratory functions of CD4+CD25+
regulatory T-cells. J Lipid Res 2009, 50:2377-2388.
32. Chen P, Zhang Y, Qiao M, Yuan Y: Activated protein C, an anticoagulant
polypeptide, ameliorates severe acute pancreatitis via regulation of
mitogen-activated protein kinases. J Gastroenterol 2007, 42:887-896.
33. Frank DA, Mahajan S, Ritz J: B lymphocytes from patients with chronic
lymphocytic leukemia contain signal transducer and activator of
transcription (STAT) 1 and STAT3 constitutively phosphorylated on
serine residues. J Clin Invest 1997, 100:3140-3148.
34. Nepomuceno RR, Snow AL, Robert Beatty P, Krams SM, Martinez OM:
Constitutive activation of Jak/STAT proteins in Epstein-Barr virus-infected
B-cell lines from patients with posttransplant lymphoproliferative
disorder. Transplantation 2002, 74:396-402.
35. Ramos HL, Valencia-Pacheco G, Alcocer-Varela J: Constitutive STAT3
activation in peripheral CD3(+) cells from patients with primary
Sjogren’s syndrome. Scand J Rheumatol 2008, 37:35-39.
36. Han SS, Yun H, Son DJ, Tompkins VS, Peng L, Chung ST, Kim JS, Park ES,
Janz S: NF-kappaB/STAT3/PI3K signaling crosstalk in iMyc E mu B
lymphoma. Mol Cancer 2010, 9:97.
37. Botoi G, Andercou A: Interleukin 17–prognostic marker of severe acute
pancreatitis. Chirurgia (Bucur) 2009, 104:431-438.
38. Vuorte J, Jansson SE, Repo H: Evaluation of red blood cell lysing solutions
in the study of neutrophil oxidative burst by the DCFH assay. Cytometry
2001, 43:290-296.
doi:10.1186/cc9329
Cite this article as: Oiva et al.: Acute pancreatitis with organ dysfunction
associates with abnormal blood lymphocyte signaling: controlled
laboratory study. Critical Care 2010 14:R207.
Oiva et al. Critical Care 2010, 14:R207
/>Page 11 of 11