Báo cáo y học: "The value of correlation of serum 20S proteasome concentration and percentage of lymphocytic apoptosis in critically ill patients: a prospective observational study" pps
Bạn đang xem bản rút gọn của tài liệu. Xem và tải ngay bản đầy đủ của tài liệu tại đây (1.59 MB, 13 trang )
RESEARC H Open Access
The value of correlation of serum 20S
proteasome concentration and percentage of
lymphocytic apoptosis in critically ill patients:
a prospective observational study
Ayman A Yousef
1*
, Ghada A Suliman
2
, Maaly M Mabrouk
2
Abstract
Introduction: Sepsis in critically ill patients is almost associated with bad prognosis and its early detection may
improve the prognosis. However, it is difficult to monitor the immunological state of these patients depending on
the traditional markers of infection or inflammatory mediators. Accelerated lymphocyte death may reflect good
idea about the prognosis especially when combined with 20S proteasome determinations, a recently discovered
marker for muscle degradation in patients with sepsis. The hypothesis of the present study is to evaluate the role
of serum 20S proteasome at early diag nosis of sepsis and its correlation with lymphocyte apoptosis to predict
prognosis and consequently the early interference in critically ill patients suffering from a broad range of diseases
in the intensive care unit.
Methods: Sixty-seven critically ill adult intensive care patients were divided into two groups, 32 septic critically ill
patients (sepsis group) and 35 non-septic critically ill patients (non-sepsis group), in addition to 33 apparently
healthy subjects from the out patient clinic (control group). Patients were tested for serum values of 20S
proteasome using ELISA and for percentage of lymphocyte death using annexin V and 7-aminoactinomycin D dye
by flow cytometry.
Results: Measured median value of serum 20S proteasome was significantly higher in septic patients compared
with both the non-septic and control groups. A significant increase in the percentage of apoptotic lymphocytes
was detected in septic patients when compa red with the non-sepsis and con trol groups. The correlation of both
20S prot easome and percentage of apoptotic lymphocytes was found to be significantly positive in both septic
and non-septic patients.
Conclusions: The correlation of median va lues of 20S proteasome and the percentage of apoptotic
lymphocyte median values could be a good indicator of patient prognosis and survival in critically ill
patients.
Introduction
Sepsis in critically ill patients correlates with bad prog-
nosis. Previous studies have tried to monitor biomarkers
for the detection of sepsis, however none of these mar-
kers provided a good idea about the immunologic state
of the patients, thus, the need for immunologic markers
for early detection of an immunocompromised state in
critically ill patients is essential [1].
Increased lymphocyte apoptosis is one of the suggested
causes of immunosuppression in critically ill patients.
In the presence of a hyperinflammatory s tate, apoptosis
may be ben eficial to the host by eliminating lymphocytes
that produce excessive pro-inflamma tory cytokines. Con-
ver sely, lymphocyte apoptosis could be harmful in sepsis
by causing depletion of lymphocytes that are essential for
defense against invading microorganisms [2].
* Correspondence:
1
Department of Anesthesia, Tanta University Hospitals, El-Geish Street, Tanta
31527, Egypt
Full list of author information is available at the end of the article
Yousef et al. Critical Care 2010, 14:R215
/>© 2010 Yousef et al.; licensee BioMed Central Ltd. This is an open access article distributed under the terms of the Creative Commons
Attribu tion License ( es/by/2.0), which permits unrestrict ed use, distribution, and reproduction in
any medium, provided the original work is properly cited.
Muscle cachexia and degradation of myofibrillar pro-
teins is another common important clinical feature in
critically ill septic patients [3]. Recently, a study in
patients with sepsis confirmed that muscle catabolism in
patients with sepsis is associated with upregulated
energy-ubiquitin-dependent protein breakdown [4]. In
this proteolytic pathway, proteins are conjugated to ubi-
quitin, then they are degraded by the 26S proteolytic
complex [5], which is composed of a core known as 20S
proteasome which is composed of seven different a and
b subunits arranged in four heptameric rings [6].
Increased level of circulating 20S proteasome was pro-
posed as a marker of cell damage and protein break-
down in critically ill septic patients. The study
hypothesis is to determine the role of serum 20S protea-
some at early diagnosis of sepsis and its correlation with
lymphocyte apoptosis to predict prognosis and early
interference in critically ill patients suffering from a
broad range of diseases in the intensive care unit (ICU).
Materials and met hods
After the study approval by an Investigational Review
Board of t he Faculty of Medicine, Tanta University, an
informed consent was obtained from all patients who
were able to grant such consent prospectively; otherwise,
consent was obtained retrospectively or from the
patient’s next-of-kin. The study was conducted over one
year in the ICU of the Emergency Hospital of Tanta Uni-
versity, Tanta, Egypt. It is 25-bed medical/surgical ICU.
Sixty-seven critically ill adult intensive care patients
divided into two groups, 32 septic patients (sepsis group)
and 35 nonseptic critically ill patients (nonsepsis group),
and 33 apparently healthy subjects from the outpatient
clinic (control group) were observed regarding 20S protea-
some and the percentage of lymphocyte apoptosis.
Patients who received corticosteroids or anti-inflammatory
drugs before admission, who had immunosuppressive ill-
ness, who had chronic organ failure, who received massive
blood transfusion, who received radiation therapy or who
had previous organ tr ansplantati on were excluded from
the study. At admission, the patient’s age, sex, height and
weight were measured. Patients’ data include clinical sta-
tus, Sequential Organ Failure Assessment (SOFA) score,
blood pressure, heart rate, respiratory rate, temperature,
central venous pressure, l aboratory analysis (complete
blood count, serum sodium, pot assium, calcium, blood
urea nitrogen, blood sugar, prothrombin time, aspartate
aminotransferase, alanin e amino transferase, albumin and
C-reactive protein, and arterial blood gas analysis were
recorded. Routine cultures of urine, blood and suspecte d
areas were obtained to determine the presence of infec-
tion. We attempted to maintain the patient central venous
pressure at 8 to 12 cmH
2
O and the hemoglobin level
at 10 to 12 g/dl. Whenever needed, intravascular fluid
replacement, blood products, vasopressor and/or inotropic
agents were administered. The physician in the ICU evalu-
ated all of the study patients daily for sepsis, severe sepsis,
or septic shock.
The signs of sepsis were body temperature <33.6°C
or >38.3 °C, tachycardia (>90 beats/minute), ventilatory
frequency >20 breath/minute or pressure of carbon
dioxide <32 mmHg (unless the patient was mechanically
ventilated), a white cell count ≥12 × 10
9
/l or <4 × 10
9
/l,
or >10% immature neutrophils, in addition to the pre-
sence of infection [7]. S evere sepsis was considered as
sepsis with evidence of organ dysfunction and hypoper-
fusion, acute alteration of mental status, elevated plasma
lactate, unexplained metabolic acidosis (arterial pH
<7.3), hypoxemia, a decrease in platelet count >50% or
≤100 × 10
9
l/l or prolonged prothrombin time, oliguria
and hypotension defined as systolic arterial pressure <90
mmHg or a decrease >40 mmHg. Septic shock was con-
sidered as hypotension (<90/60 mmHg) in addition to
sepsis syndrome persisting despite adequate fluid resus-
citation and requiring intropic support. SOFA score
consists of scor es from six organ systems (respiratory,
car diov ascular, hepatic, coagulation, renal, and neurolo-
gical) graded from 0 to 4 according to the degree of dys-
function/failure. The aggregate score (total maximum
SOFA score) is calculated summing the worst scores for
each of the organ systems during the ICU stay [8].
Estimation of 20S proteasome
Microtitration plates coated with monoclonal antibody
to 20S proteasome were used. Human s era samples
diluted 1:20 were applied to each well for 3 hours at
room temperature. A standard curve was established
using 20S proteasome standard preparation having con-
centrations of 5,000 ng/ml to 78 ng/ml (six linear dilu-
tion steps). After a washing step, a polyclonal antibody
to 20S proteasome a and b subunits was added for
2 hours, followed by another washing step. Peroxidase-
conjugated anti-rabbit IgG was used for detection of the
antigen, incubated for 1 hour, substrate was added (tet-
ramethyl benzidine) and finally the reaction was stopped
with sulfuric acid. Optical density values were deter-
mined at 450 nm.
A negative control in the form of bovine serum albu-
min was used to exclude nonspecific reaction to pro-
teins and no reaction was detected. A positive control in
the form of human placental proteasome preparation
was also used (AFFINTI Research Products Ltd, Mam
Head, Exeter, UK).
Estimation of the percentage of apoptotic lymphocytes
by flow cytometry
Whole bl ood on ethylenediamine tetraacetic acid vacu-
tainer samples were used. Red blood cells were lysed
Yousef et al. Critical Care 2010, 14:R215
/>Page 2 of 13
with ammonium chloride 1.0 mM and white blood cells
were washed three times with PBS. Cells were incubated
for 30 minutes in the dark with the monoclonal anti-
body for the target CD cells or with the dyes used
(annexin V and 7-aminoactinomycin D (7-AAD); Becton
Dickinson a nd Pharmingen (St. Jose, California, USA)).
Forward and side scatter properties for lymphocytes
were used with the use of a pan-lymphocyte, B-lympho-
cyte and T-lymphocyte panel including C D19 labeled
with cy 5 dye for B cells and CD3 labeled with PerCP
dye for T cells. With the use of annexin V labeled with
fluorescein isothiocyanate (FITC) and 7-AAD labeled
with phycoerythrin staining for apoptotic lymphocytes,
the percentage of these cells was detected. Detection of
apoptosis using annexin V was accompanied with the
use of 7-AAD detection kits. The final combination
used for all patients was (CD19/annexin V/CD3/7-
AAD).
FITC annexin V staining precedes the loss of mem-
brane integrity that accompanies the latest stages of cell
death either due to apoptotic or necrotic pro cesses.
Staining with FITC annexin V is therefore typically used
withavitaldyesuchas7-AADtoidentifytheearly
apoptotic cells (phycoerythrin 7-AAD-negative/FITC
annexin V-positive) and to d ifferentiate the late apop to-
tic or dead cells (p ositive for both 7-AAD and annexin
V) from viable cells that are negative f or both 7-AAD
and annexin V [9-11].
Results
A total of 100 patients (59 men and 41 women) were
included in the study. Thirty-two patients developed
septic complications during the ICU stay (sepsis group),
10 patients developed septic shock, 15 patients developed
severe sepsis, and 7 patients developed sepsis without any
organ dysfunction. Thirty-five patients were critically ill
without evidence of infectious organism (non-sepsis
group), 10 patie nts developing non-sep tic complications
in the form of disturbed hepatic or renal functions, elec-
trolyte imbalance or acid-base disorders, in addition to
thirty three non-critically ill non- septic patients (control
group). No significant difference was detected among the
groups except for SOFA score at ICU admission and the
duration of the stay in the ICU, which were higher in
septic patients (Table 1).
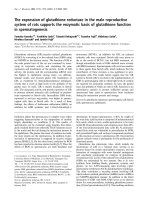
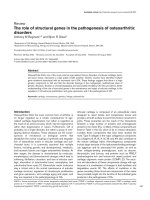
There was a significant variation among median values
of 20S proteasome in the studied groups: a median value
of 25,125 ng/ml in the sepsis group, a median value of
4,560 ng/ml in the nonsepsis group, and a median value
of 2,740 ng/ml in the control group. The mean rank
was 83.69, 42.66 and 26.64 for the studied group,
respectively. The sepsis group showed the highest
values, followed by the nonsepsis group and lastly the
control group (P < 0.001) (Table 2 and Figure 1).
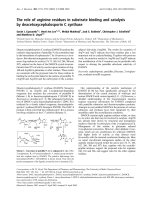
Ther e was a significant variation of the median values
among the studied groups regarding the percentage of
apoptotic lymphocytes: the median value for the sepsis
group was 11.75%, the median value for the non-sepsis
group was 3.6%, while the median value for the control
group was 2.2%. The median rank for the studied
groups was 84.34, 41.9 and 26.8, respectively. The sepsis
group showed the highest values, followed by the non-
sepsis group and lastly the control group (Table 3 and
Figure 2).
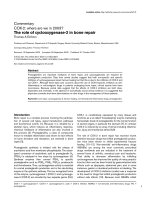
A significant variation of the percentage of apoptotic B
lymphocytes was observed in the studied groups: in the
Table 1 Patient characteristics
Sepsis group (n = 32) Non-sepsis group (n = 35) Control group (n = 33)
Age (years) 44 ± 9.5 45 ± 8.7 44 ± 10.2
Sex ratio (male/female) 19/13 21/14 19/14
SOFA score 12 (7-14)* 6 (3-10)
Duration of ICU stay (days) 16.9 ± 4.6* 5.8 ± 2.7
Diagnosis
Respiratory insufficiency due to:
Bacterial infection 6
ARDS 4
COPD 2
Bronchial asthma 4
Pulmonary edema 3
Polytrauma 7 8
Orthopedic surgery 9 11
Thoracic surgery 6 7
Data presented as mean and standard deviation or (interquartile range for SOFA). *Significant change, P < 0.05. ARDS, adult respiratory distress syndrome; COPD,
chronic obstructive pu lmonary disease; ICU, intensive care unit; SOFA, Sequential Organ Failure Assessment.
Yousef et al. Critical Care 2010, 14:R215
/>Page 3 of 13
sepsis group the median value was 5.9% and the median
rank 84.15, while this was 1.8% with a median rank of
41.1 in the non-septic group, and the median value in
the control group was 1.09% with a median rank of 28.2
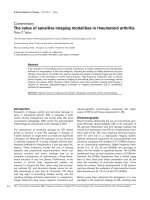
(P = 0.008). Similarly, a significant variation of the per-
centage of apoptotic T lymphocytes was ob served in the
studied groups: in the sepsis group the median value
was 5.9% an d the median rank 83.1, while this was 1.7%
with a median rank of 43.4 in the non-septic group, and
the median value in the control group was 2.2% with a
median rank of 27.1 (P = 0.001) (Tables 4 and 5, and
Figures 3 and 4).
Concerning the survival rate for the sepsis and non-
sepsis groups, in the sepsis group 21 patients recov-
ered and 11 patients died during the ICU stay
compared with 22 patients recovering and 13 patients
dying during the ICU stay in the nonsepsis group.
There was no significant variation betw een the two
Table 2 Comparison of the concentration of 20 S proteasome in the studied groups
Group 20 S proteasome
Range Median Mean rank
Sepsis group 13,700 to 38450 25,125.00 83.69
Non-sepsis group 1,170 to 21710 4,590.00 42.66
Control group 1,130 to 4970 2,470.00 26.64
Kruskal-Wallis test c
2
= 66.764 P = 0.000*
Mann-Whitney test Sepsis and nonsepsis groups Sepsis and control groups Nonsepsis and control groups
P value <0.001* <0.001* 0.001*
*Significant change, P < 0.05.
333532N =
Grou
p
s
Control
Non-sepsisSepsis
Con. 20S
proteasome
5
0000
40000
30000
20000
10000
0
-10000
67
65
Figure 1 Comparison between concentrations of 20 S proteasome in the studied groups.
Yousef et al. Critical Care 2010, 14:R215
/>Page 4 of 13
groups concerning the survival rate (Table 6 and
Figure 5).
Concerning the relat ion of survival to the concentra-
tion of 20S proteasome in the sepsis g roup, survived
patients had a median value of 26,150 ng/ml compared
with 19,200 ng/ml in patients who did not survive.
The relation of survival to the percentage of apoptotic
lymphocytes in the sepsis group, the median value of
survived patients was 12.2% compared to 10.5% in
non-survived patients. Regarding non-sepsis group, the
median value for serum 20S proteasome for s urvived
patients was 4,910 ng/ml while for non-survived
patients it was 4,170 ng/ml. Regarding the relation of
survival and percentage of apoptotic lymphocytes, the
median value of for those who survived was 3.8%,
while for non-survived patients it was 3.3%. There was
no significant correlation for 20S proteasome and the
percentage of apoptotic lymphocytes to the survival
rate in both groups separately. A significant positive
correlation between the two measured factors 20S
proteasome and apoptotic total lymphocytes, B lym-
phocytes and T lymphocytes in both the sepsis and
non-sepsis groups was detected (Tables 7 to 9, and
Figures 6 to 11).
Table 3 Percentage of total apoptotic lymphocytes among the studied groups
Group Range Median Mean rank
Sepsis group 8.200 to 18.400 11.750 84.344
Non-sepsis group 1.500 to 9.600 3.600 41.971
Control group 1.300 to 6.400 2.200 27.176
Kruskal-Wallis test c
2
= 68.506 P = 0.000*
Mann-Whitney test Sepsis and non-sepsis groups Sepsis and control groups Non-sepsis and control groups
Z -6.917 -6.982 -3.057
P value 0.000* 0.000* 0.002*
*Significant change, P < 0.05.
0
10
20
30
40
50
60
70
80
90
Sepsis group Non-sepsis
g
roup
Control
Mean rank
Figure 2 Comparison of percentage of apoptotic lymphocytes in the studied groups.
Yousef et al. Critical Care 2010, 14:R215
/>Page 5 of 13
Table 4 Percentage of apoptotic B lymphocytes among the studied groups
Group Range Median Mean rank
Sepsis group 3.762 to 9.384 5.942 84.156
Non-sepsis group 0.525 to 4.800 1.836 41.118
Control group 0.663 to 4.425 1.097 28.206
Kruskal-Wallis test c
2
= 66.721 P = 0.000*
Mann-Whitney test Sepsis and non-sepsis groups Sepsis and control groups Non-sepsis and control groups
Z -6.878 -6.942 -2.663
P value 0.000* 0.000* 0.008*
*Significant change, P < 0.05.
Table 5 Percentage of apoptotic T lymphocytes among the studied groups
Group Range Median Mean rank
Sepsis group 2.375 to 9.016 5.914 83.156
Non-sepsis group 0.735 to 5.785 1.738 43.412
Control group 0.637 to 3.190 1.054 26.853
Kruskal-Wallis test c
2
= 65.184 P = 0.000*
Mann-Whitney test Sepsis and non-sepsis groups Sepsis and control groups Non-sepsis and control groups
Z -6.480 -6.929 -3.240
P value 0.000* 0.000* 0.001*
*Significant change, P < 0.05.
0
10
20
30
40
50
60
70
80
90
Sepsis group Non-sepsis
g
roup
Control
Mean ran
k
Figure 3 Percentage of apoptotic B lymphocytes among the studied groups.
Yousef et al. Critical Care 2010, 14:R215
/>Page 6 of 13
Discussion
Critically ill patients, whether suffering from sepsis or
not are cl assified as high-risk patients as regard morbid-
ity and mortality. Previous studies have beco me growing
up to evaluate the immunological state in different dis-
eases, in addition different immunologic markers were
previously measured separately to evaluate these
patients. In the present study, we tried to evaluate two
immunological factors as diagnostic and prognostic mar-
kers separately and as both of them together to deter-
mine their correlation.
The present study monitored serum levels of 20S pro-
teasome, it was increased in both septic and non-septic
critically ill patients compared to healthy controls, with
a statistical ly significant increase in septic patients com-
pared with non-septic patients. The median level in the
septic group was 11-fold higher than the control group,
while i n the non-septic group it was 2 fold higher than
in the control group. In their studies, Roth and collea-
gues and Dutaud and colleagues demonstrated elevated
serum 20S proteasome in both septic and control
groups, which was 2,157 ± 273 ng/ml and 2,319 ± 237
ng/ml, respectively [12,13]. Other studies revealed that
elevated 20S proteasome usually occurs in variable con-
ditions demonstrating cellular damage and catabolic
activity, such as sepsis, traum a and mus cle proteolysis,
this is explained by the rapidity of the cellular degrada-
tion occurring in these conditions [14]. Elevated 20S
proteasome was also noticed in variable autoimmune
disorders such as systemic lupus and rheumatoid arthri-
tis,andthiselevationwascloselyrelatedtotheperiods
of disease activity. [15]
The activation of both B lymphocytes and T lympho-
cytes occurring in sepsis usually leads to formation of
aberrantly reactive B lymphocytes and T lymphocytes
causing an immunodeficient state in those septic
patients [16,17]. Hotchkiss et al., [1] and Bourboulis
et al., [18] demonstrated a statistically significant increase
in the percentage of dead lymphocytes in septic patients
infected with Gram-negative bacteria in comparison to
0
10
20
30
40
50
60
70
80
90
Sepsis group Non-sepsis
g
rou
p
Control
Mean rank
Figure 4 Percentage of apoptotic T lymphocytes among the studied groups.
Table 6 Survival rates among the sepsis and non-sepsis
groups
Group Survival
Alive Died Total
Sepsis group n 21 11 32
% 65.63 34.38 100.00
Non-sepsis group n 22 13 35
% 62.86 37.14 100.00
Total n 43 24 67
% 64.18 35.82 100.00
Chi-square test c
2
0.056
P value 0.813
Yousef et al. Critical Care 2010, 14:R215
/>Page 7 of 13
Groups
Alive Died Total
Sepsis 65.63 34.38 100.00
N
on-sepsi
s
62.86 37.14 100.00
0
10
20
30
40
50
60
70
Ali
ve
Di
ed
%
Sepsis
Non-sepsi
s
Figure 5 Survival rate between the sepsis and non-sepsis groups.
Table 7 Correlation of survival and 20 S proteasome in the sepsis and non-sepsis groups
20 S proteasome Alive Died Mann-Whitney test
Range Median Mean rank Range Median Mean rank ZPvalue
Sepsis group 14,200.00 - 38,450.00 26,150.00 17.69 13,700.00 - 38,200.00 19200.00 14.23 0.992 0.327
Non-sepsis group 1,170.00 - 21,710.00 4,910.00 18.64 12,20.00 - 13,590.00 4170.00 16.92 0.478 0.649
Table 8 Correlation of survival and percentage of total apoptotic lymphocytes in the sepsis and non-sepsis groups
Percentage of apoptotic lymphocytes Alive Died Mann-Whitney test
Range Median Mean rank Range Median Mean rank ZPvalue
Sepsis group 9.40 to 18.40 12.20 18.12 8.20 to 15.90 10.50 13.41 1.350 0.180
Nonsepsis group 1.50 to 9.60 3.80 18.80 1.80 to 7.40 3.30 16.65 0.598 0.555
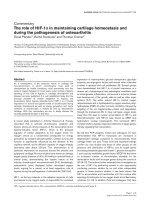
Table 9 Correlation between 20 S proteasome and percentage of apoptotic lymphocytes in the studied groups
R value P value
Sepsis group Apoptotic (total) 0.746 0.000*
Apoptotic (B lymphocytes) 0.642 0.000*
Apoptotic (T lymphocytes) 0.636 0.000*
Nonsepsis group Apoptotic (total) 0.768 0.000*
Apoptotic (B lymphocytes) 0.636 0.000*
Apoptotic (T lymphocytes) 0.766 0.000*
*Significant change, P < 0.05.
Yousef et al. Critical Care 2010, 14:R215
/>Page 8 of 13
Figure 6 Correlation between 20 S proteasome and the percentage of apoptotic total lymphocytes in the sepsis group.
Figure 7 Correlation between 20 S proteasome and the percentage of apoptotic B lymphocytes in the sepsis group.
Yousef et al. Critical Care 2010, 14:R215
/>Page 9 of 13
Figure 8 Correlation between 20 S proteasome and the percentage of apoptotic T lymphocytes in the sepsis group.
Figure 9 Correlation between 20 S proteasome and the percentage of apoptotic total lymphocytes in the non-sepsis group.
Yousef et al. Critical Care 2010, 14:R215
/>Page 10 of 13
Figure 10 Correlation between 20 S proteasome and the percentage of apoptotic B lymphocytes in the non-sepsis group.
Figure 11 Correlation between 20 S proteasome and the percentage of apoptotic T lymphocytes in the non-sepsis group.
Yousef et al. Critical Care 2010, 14:R215
/>Page 11 of 13
the control group. Baize et al., [19] demonstrated similar
increase in t he percentage of dead lymphocytes in
patients suffering from sepsis.
The present study revealed that either 20S proteasome
or the percentage of dead lymphocytes had not any sig-
nificant correlation separately to the prognosis in both
septic and non-septic critically ill patients, while correla-
tion of both 20S proteasome or the percentage of dead
lymphocytes was found to have moderate positive corre-
lation in both sepsis and non-sepsis groups.
Previous studies reported increased lymphocyte death
(apoptosis) as an evident finding in critically ill septic
patients, which was related to the status of humoral
immunity and the prognosis of these patients [14,20].
The present study demonstrated that both 20S protea-
some and the percentage of lymphocyte death values in
critically ill patients could be a good predictor for the
prognosis in these patients. This study thus hypothe-
sized that the combined monitoring of both 20S protea-
some and the percentage of lymphocyte death could be
a potent prognostic predictor in critically ill patients.
Conclusions
Elevated serum 20S proteasome in cr itically ill patients is
related to an increased rate of muscle breakdown during
their critical illness. Increased lymphocyte apoptosis is a
sensitive marker in severe inflammatory states. The corre-
lation between 20S proteasome and the percentage of
apoptotic lymphocyte in critically ill patients could be a
good predictor of patient outcome, prognosis and survival.
Key messages
• Critically ill patients, whether septic or non-septic,
usually have reduced humoral immunity.
• Immunologic markers in critically ill septic and
non-septic patients are more valuable in predicting
prognosis than other biologic markers.
• The 20S proteasome as a part of proteasome complex
is elevated in critically ill patients, whether septic or
non-septic, and this elevation is partially due to
enhanced and increased cellular damage and partly due
to reduced immunity and altered immune response.
• Increased lymphocyte death is another immunolo-
gic prognostic marker occurring in critically ill
patients, both septic and non-septic.
• Joining 20S proteasome and increased lymphocyte
death together could have a more prognostic value
in predicting survival in these patients than each of
them when measured separately.
Abbreviations
7-AAD: 7-aminoactinomycin D; ELISA: enzyme-linked immunosorbent assay;
FITC: fluorescein isothiocyanate; ICU: intensive care unit; PBS: phosphate-
buffered saline; SOFA: Sequential Organ Failure Assessment.
Acknowledgements
The authors would like to thank the nursing staff of the ICU of the
Emergency Hospital, Tanta University. The authors declare that they did not
receive any funds during preparation of this manuscript.
Author details
1
Department of Anesthesia, Tanta University Hospitals, El-Geish Street, Tanta
31527, Egypt.
2
Department of Clinical Pathology, Tanta University Hospitals,
El-Geish Street, Tanta 31527, Egypt.
Authors’ contributions
AAY prepared the manuscript, and followed up the patients. GAS
participated in the design of the study, prepared the laboratory results and
wrote the related parts. MMM participated in the laboratory results, writing
the related parts and interpretation of the results. All authors read and
approved the final manuscript.
Competing interests
The authors declare that they have no competing interests.
Received: 10 January 2010 Revised: 30 March 2010
Accepted: 25 November 2010 Published: 25 November 2010
References
1. Hotchkiss RS, Osmon SB, Chang KC, Wagner TH, Coopersmith CM, Karl IE:
Accelerated lymphocyte death in sepsis occurs by both the death
receptor and mitochondrial pathways. J Immunol 2005, 174:5110-5118.
2. Hotchkiss RS, Swanson PE, Cobb JP, Jacobson A, Buchman TG, Karl IE:
Apoptosis in lymphoid and parenchymal cells during sepsis: findings in
normal and T- and B-cell-deficient mice. Crit Care Med 1997, 25:1298-1307.
3. Hasselgren PO, Fischer JE: Muscle cachexia: current concepts of
intracellular mechanisms and molecular regulation. Ann Surg 2001,
233:9-17.
4. Tiao G, Hobler S, Wang JJ, Meyer TA, Luchette FA, Fischer JE,
Hasselgren PO: Sepsis is associated with increased mRNAs of ubiquitin-
proteasome proteolytic pathway in human skeletal muscle. J Clin Invest
1997, 99:163-168.
5. Hershko A, Ciechanover A: The ubiquitin system for protein degradation.
Annu Rev Biochem 1992, 61:761-807.
6. Baumeister W, Walz J, Zuhl F, Seemuller E: The proteasome paradigm of a
self-compartmentalizing protease. Cell 1998, 92:367-380.
7. Bone RC, Balk RA, Cerra FB, Dellinger RP, Fein AM, Knaus WA, Schein RMH,
Sibbald WJ: Definitions for sepsis and organ failure and guidelines for
the use of innovative therapies in sepsis. The ACCP/SCCM Consensus
Conference Committee. American College of Chest Physicians/Society of
Critical Care Medicine. Chest 1992, 101:1644-1655.
8. Janssens U, Dujardin R, Graf J, Lepper W, Ortlepp J, Merx M, Zarse M,
Reffelmann T, Hanrath P: Value of SOFA (Sequential Organ Failure
Assessment) score and total maximum SOFA score in 812 patients with
acute cardiovascular disorders. Crit Care 2001, 5:P225.
9. O’Brien MC, Bolton WE: Comparison of cell viability probes compatible
with fixation and permeabilization for combined surface and
intracellular staining in flow cytometry. Cytometry 1995, 19:243-255.
10. Schmid I, Krall WJ, Uittenbogaart CH, Braun J, Giorgi JV: Dead cell
discrimination with 7-amino-actinomycin D in combination with dual
color immunoflurescence in single laser flow cytometry. Cytometry 1992,
13:204-208.
11. Vermes I, Haanen C, Steffens-Nakken H, Reutelingsperger C: A novel assay
for apoptosis. Flow cytometry detection of phosphatidylserine
expression on early apoptotic cells using fluorescein labeled Annexin V.
J Immunol Methods 1995, 184:39-51.
12. Roth GA, Moser B, Krenn C, Roth-Walter F, Hetz H, Richter S, Brunner M,
Jensen-Jarolim E, Wolner E, Hoetzenecker K, Boltz-Nitulescu G, Ankersmit HJ:
Heightened levels of circulating 20 S proteosome in critically ill patients.
Eur J Clin Invest 2005, 35:399-403.
13. Dutaud D, Aubry L, Henry L, Levieux D, Hendil KB, Kuehn L, Bureau JP,
Ouali A: Development and evaluation of a sandwich ELIZA for
quantification of the 20 S proteosome in human plasma. J Immunol
Methods 2002, 260:183-193.
14. Siegel RM, Muppidi J, Roberts M, Porter M, Wu Z: Death receptor signaling
and autoimmunity. Immunol Res 2003, 27
:499-512.
Yousef et al. Critical Care 2010, 14:R215
/>Page 12 of 13
15. Majetscha KM, Perez M, Scorell LT, Lam J, Maldonado ME, Hoffman RW:
Circulating 20 S proteosome levels in patients with mixed connective
tissue disease and systemic lupus erythematosus. Clin Vaccine Immunol
2008, 15:1489-1493.
16. Wada M, Kosaka M, Saito S, Sano T, Tanaka K, Ichihara A: Serum
concentration and localization in tumor cells of proteasomes in patients
with hematologic malignancy and their pathophysiologic significance.
J Lab Clin Med 1993, 121:215-223.
17. Bone RC, Newton SI: Sepsis, SIRS, and CARS. Crit Care Med 1996,
24:1125-1128.
18. Giamarellos-Bourboulis EJ, Tsaganos T, Spyridaki E, Mouktaroudi M,
Plachouras D, Vaki I, Karagianni V, Antonopoulou A, Veloni V, Giamarellou H:
Early changes of CD4-positive lymphocytes and NK cells in patients with
severe gram-negative sepsis. Crit Care 2006, 10:R166.
19. Baize S, Leroy EM, Georges-Courbot MC, Capron M, Lansoud-Soukate J,
Debré P, Fisher-Hoch SP, McCormick JB, Georges AJ: Defective humoral
responses and extensive intravascular apoptosis are associated with
fatal outcome in Ebola-virus infected patients. Nat Med 1999, 5 :423-426.
20. Hotchkiss RS, Tinsley KW, Swanson PE, Chang KC, Cobb JP, Buchman TG,
Korsmeyer SJ, Karl IE: Prevention of lymphocyte cell death in sepsis
improves survival in mice. Proc Natl Acad Sci USA 1999, 96:14541-14546.
doi:10.1186/cc9340
Cite this article as: Yousef et al.: The value of correlation of serum 20S
proteasome concentration and percentage of lymphocytic apoptosis in
critically ill patients: a prospective observational study. Critical Care 2010
14:R215.
Submit your next manuscript to BioMed Central
and take full advantage of:
• Convenient online submission
• Thorough peer review
• No space constraints or color figure charges
• Immediate publication on acceptance
• Inclusion in PubMed, CAS, Scopus and Google Scholar
• Research which is freely available for redistribution
Submit your manuscript at
www.biomedcentral.com/submit
Yousef et al. Critical Care 2010, 14:R215
/>Page 13 of 13