Báo cáo y học: "Pathophysiological aspects of hyperglycemia in children with meningococcal sepsis and septic shock: a prospective, observational cohort study" docx
Bạn đang xem bản rút gọn của tài liệu. Xem và tải ngay bản đầy đủ của tài liệu tại đây (415.85 KB, 10 trang )
RESEARCH Open Access
Pathophysiological aspects of hyperglycemia in
children with meningococcal sepsis and septic
shock: a prospective, observational cohort study
Jennifer J Verhoeven
1*
, Marieke den Brinker
2
, Anita CS Hokken-Koelega
3
, Jan A Hazelzet
1
, Koen FM Joosten
1
Abstract
Introduction: The objective of this study was to investigate the occurrence of hyperglycemia and insulin response
in critically ill children with meningococcal disease in the intensive care unit of an academic children’s hospital.
Methods: Seventy-eight children with meningococcal disease were included. The group was classified into shock
non-survivors, shock survivors and sepsis survivors. There were no sepsis-only non-survivors. The course of
laboratory parameters during 48 hours was assessed. Insulin sensitivity and b-cell function on admission were
investigated by relating blood glucose level to insulin level and C-peptide level and by homeostasis model
assessment (HOMA) [b-cell function (HOMA-%B) and insulin sensitivity (HOMA-%S)].
Results: On admission, hyperglycemia (glucose >8.3 mmol/l) was present in 33% of the children. Shock and sepsis
survivors had higher blood glucose levels compared with shock non-survivors. Blood glucos e level on admission
correlated positively with plasma insulin, C-peptide, cortisol, age and glucose intak e. Multiple regression analysis
revealed that both age and plasma insulin on admission were significantly related to blood glucose. On admission,
62% of the hyperglycemic children had overt insulin resistance (glucose >8.3 mmol/l and HOMA-%S <50%); 17%
had b-cell dysfunction (glucose >8.3 mmol/l and HOMA-%B <50%) and 21% had both insulin resistance and b-cell
dysfunction. Hyperglycemia was present in 11% and 8% of the children at 24 and 48 hours after admission,
respectively.
Conclusions: Children with meningococcal disease often show hyperglycemia on admission. Both insulin
resistance and b-cell dysfunction play a role in the occurrence of hyperglycemia. Normalization of blood glucose
levels occurs within 48 hours, typically with normal glucose intake and without insulin treatment.
Introduction
Critical illness is associated with many endocrine and
metabolic changes, including changes in the glucose
homeostasis [1-7]. Both hypoglycemia and hyperglyce-
mia may lead to adverse outcome as expressed in length
of pediatric intensive care unit (PICU) stay and mortal-
ity rates [6-16].
A follow-up study in patients who survived meningo-
coccal septic shock in childhood showed that severe
mental retardation was associated with hypoglycemia
during admission [17]. Children who died from menin-
gococcal septic shock appeared to have significantly
low er levels of blood glucose on admission to the PICU
in comparison with those who survived, in whom levels
were moderately increased [4,5]. The most severely ill
children had signs of (relative) adrenal insufficiency on
admission. Deficiency of substrate, reduced activity of
adrenal enzymes because of endotoxins, cytokines, or
medication, and shock with disseminated intravascular
thrombosis can cause necrosis of the adrenal glands and
result in (relati ve) adrenal insufficiency in children with
meningococcal disease [5].
Many children with meningococcal septic shock suffer
from hyperglycemia [12,18,19]. The pathophysiological
mechanism leading to hyperglycemia in critically ill chil-
dren with meningococcal disease may be different from
that in adults. Recently, it was shown that the acute
phase of sepsis in children is quite different from that in
* Correspondence:
1
Department of Intensive Care, Erasmus MC - Sophia Children’s Hospital, Dr.
Molewaterplein 60, Rotterdam, 3015 GJ, The Netherlands
Full list of author information is available at the end of the article
Verhoeven et al. Critical Care 2011, 15:R44
/>© 2011 Verhoeven et al.; licensee BioMed Central Ltd. This is an open access article distributed under the terms of the Cre ative
Commons Attribution License ( s/by/2.0), which pe rmits unrestricted use, distribution, and
reproduction in any me dium, provided the original work is properly cited.
adults [18]. It was suggested that hyperglycemia asso-
ciated with b-cell dysfunction rather than insulin resis-
tance may be the normal pathophysiological response in
children with meningococcal septic shock. It was also
suggested that treatment of hyperglycemia with exogen-
ousinsulinmaynotbesupportiveandmayevenbe
potentially detrimental in critically ill children [18].
Better insight into pathophysiological mechanisms
leading to hyperglycemia is crucial to improve treatment
strategies. The gold standard for quantifying insulin sen-
sitivity in vivo is the hyperinsulinemic euglycemic clamp
technique [20]. This is a complex and invasive technique
and therefore is not easily applied in studies with criti-
cally ill children. The search for uncomplicated and
inexpensive quantitative tools to eval uate insulin sensi-
tivity has led t o the development of other assessments.
The fasting glucose-to-insulin ratio and homeostasis
model assessment (HOMA) of insulin resistance have
been proven to be useful estimates of insulin sensitivi ty,
also in critical illness [21-24]. There is a good correla-
tion between estimates of insulin resistance derived
from HOMA and from the hyperinsulinemic euglycemic
clamp [24]. The assessment of b-cell function i s difficult
because the b-cell response to the secretory stimuli is
complex. There is no gold standard for b-cell function.
The HOMA method for assessing b-cell function
(HO MA-%B) is ba sed on measurements of fasting insu-
lin or C-peptide concentratio n to calculate pre-hepatic
insulin secretion in relation to blood glucose levels [24].
The objective of the present study was to investigate the
occurrence of hypergly cemia in relation to the insulin
response and exogenous factors, such as glucose intake
and drug use, in a homogenous group of critically ill
children with meningococcal sepsis or meningococcal
septic shock or both.
Materials and methods
Patients
The study population consisted of previously healthy
children who were admitted to the PICU of the Erasmus
MC-Sophia Children’s Hospital between October 1997
and May 2004 and who were suffering from meningo-
coccal sepsis (that is, sepsis with petechiae/purpura).
Sepsis was defined as a body temperature of less than
36.0°C or more than 38.5°C with tachycardia and
tachypnea [5]. Children were determined to have septic
shock if they had persistent hypotension or evidence of
poor end-organ perfusion, defined as at least two of the
following: (a) un explained metabolic acidosis (pH of less
than 7.3 or base excess o f not more than 5 mmol/L or
plasma lactate levels of greater than 2.0 mmol/L),
(b) art erial hypoxia (partial pressure of oxygen [PO
2
]of
less than 75 mm Hg, a PO
2
/fraction of inspire d oxygen
[FiO
2
] ratio of less than 250 or transcutaneous oxygen
saturation of less than 96%) in patients without overt
cardiopulmonary disease, (c) acute renal failure (diuresis
of less than 0.5 mL/kg per hour for at least 1 hour
despite acute volume loading or evidence of adequate
intravascular volume without pre-exi sting renal disease),
or (d) sudden deterioration of the baseline mental status
[5]. Sepsis or septic shock was diagnosed in the children
within the first hours after admission to the PICU.
Children were not eligible for the study if they had
pre-existing diabetes mellitus or had received radiation
or chemotherapy within the previous 6 months. Thirty-
five of the included 78 chil dren participated in a rando-
mized, double-blinded, placebo-controlled study. They
received either placebo or activated protein C concen-
trate (APC) starting after admission, every 6 hours for
the first days of admission, and then every 12 hours to a
maximum of 7 days [19]. APC is assumed not to influ-
ence the endocrine and metabolic assays [5]. The Eras-
mus MC Medical Ethics Review Board approved the
study, and written informed consent was obtained from
the parents or legal representatives.
Clinical parameters
Disease severity was assessed by the pediatric risk of mor-
tality (PRISM II) score on the day of admission. In those
who died within 24 hours after PICU admission, a PRISM
score of the first 6 hours was calculated [25]. Glucocorti-
coid administration, inotropic medication, and use of
mechanical ventilation were recorded. Equivalent doses of
prednisolone, e xpressed per body weight (milligrams per
kilogram), were calculated, using the glucocorticoid
equivalents of 20, 5, and 0.75 mg for hydrocortisone, pre-
dnisolone, and dexamethasone, respectively. Inotropic
support was quantified by the vasopressor score developed
by Hatherill and colleagues [26].
Nutrition
The children were fed enterally or parenterally (or both)
according to a standard feeding protocol as previously
described [27]. If enteral feeding could not be started on
the second day, p arenteral f eeding was started. On
admission at the PICU, glucose was administered at a
rate of 2 to 6 mg/kg per minute, depending on weight.
The initial dose of proteins was 1.0 g/kg per day and
that of lipids was 1.0 g/kg per day. If clinically possible,
nutrition was adjusted to the normal needs according to
dietary referen ce intakes for healthy children on days 3
and 4.
Collection of blood and assays
Arterial blood samples for the determination of blood
glucose levels and plasma levels of insulin, C-peptide,
cortisol, cytokines, C-reactive protein (CRP), lactate, and
free fatty acids (FFAs) were collected on admission and
Verhoeven et al. Critical Care 2011, 15:R44
/>Page 2 of 10
at 24 and 48 hours thereafter. Assays were used in
accordance with the instructions of the manufacturer.
Arterial glucose and lactate were determined on a blood
gas analyzer (ABL 625; Radiometer A/S, Copenhagen,
Denmark). Hypoglycemia was defined as a blood glucose
level of not more than 2.2 mmol/L, and hyperglycemia
was defined as a blood glucose level of greater than
8.3 mmol/L [28]. To convert millimoles per liter of glu-
cose to milligrams per deciliter, multiply by 18. The
reference level for lactate was l ess than 2.0 mmol/L.
Serum insulin was measured by a two-site chemilumi-
nescent immunometric assay (Immulite 2000; Diagnos-
tics Product Corporation, now part of Siemens, Los
Angeles, CA, USA) with a minimum detection level of
35 pmol/L and a maximum fasting reference value of
180 pmol/L. Serum C-peptide was measured by a che-
miluminescent immu nometric method (Immulite 2000).
For children under the age of 13 years, the reference
interval ranged between 0.2 and 2.6 nmol/L (0.6 to 7.8
ng/mL) and for children older than 13 years between
0.4 and 2.6 nmol/L (1.3 to 7.9 ng/mL) [29]. Serum corti-
sol concentrations were determined with a competitive
luminescence immunoassay (Immulite 2000). The detec-
tion limits of this assay range from 3 to 1,380 nmol/L.
Adrenal insufficiency in case of catecholamine-resistant
septic shock is assumed at a random total cortisol level
of less than 496 nmol/L (less than 18 μg/dL) [30]. FFA
was determined b y the enzymatic method (Nefac-kit,
Wako; Instruchemie BV, Delfzijl, The Netherlands).
CRP was determined by immunoturbidimetric assay
(normal of less than 2 mg/L) and examined on a 912
analyzer (Roche Diagnostics GmbH, Mannheim, Ger-
many). Cytokine levels were analyzed with an enzyme-
linked immunosorbent assay (Sanquin, Amsterdam, The
Nethe rlands). The detection limit o f interleukin-6 (IL-6)
(lowest posit ive standard) was 10 pg/mL. The detection
limit of tumor necrosis factor-alpha was 5 pg/mL [31].
Outcome measurements
The total sample was divided into three groups: shock
non-survivors, shock survivors, and sepsis survivors, as
we have previously reported striking differences in endo-
crinological and metabolic responses between survivors
and non-survivors [5]. The courses of the main endocri-
nological, metabolic, and immunological laboratory
parameters during the first 48 hours of PICU stay were
assessed.
The insulin response to hyperglycemia was assessed by
investigating insulin response to glucose and by HOMA
modeling [24]. The updated HOMA2 computer model
was used to determine insulin sensiti vity (%S) and b-cell
function (%B) from paired plasma glucose and insulin
and C-peptide concentrations on admission. C hildren
were considered to be fasting until admission with
subsequently only a continuous glucose infusion without
enteral intake for more than 6 hours. Determi nations of
insulin sensitivity and b-cell function were made on
admission only.
Statistical analysis
Analysis was performed with the SPSS statistical soft-
ware package for Windows (version 16.0; SPSS, Inc.,
Chicago, IL, USA). Results are expressed as medians
and interquartile ranges, unless specified otherwise.
Between-group comparisons were made with the Ma nn-
Whitney U test for continuous data. The chi-square test
was used for comparison of nominal data. The Spear-
man’s correlation coefficient was used to evaluate the
relationship between different parameters. Multiple lin-
ear regression analysis was applied to evaluate the rela-
tionship between admission hyperglycemia and various
var iables. Data were log -transformed for multiple linear
regression analysis when necessary. P values of less than
0.05 are considered statistically significant.
Results
Patient characteristics
Seventy-ei ght children (32 females) admitted to our
PICU with meningococcal disease were included
(Table 1). Their median age was 3.5 years (1.6 to 9.4
years) . Blood cultures revealed Neisseria meningitidis in
65 children, and meningococcal disease was diagnosed
in 13 children on the basis of their typical clinical pic-
ture. S ixty-seven children were classi fied as having
meningococcal septic s hock, and 11 were classified as
having meningococcal sepsis. Nine children with shock
died within 24 hours a fter PICU admission, and 1 child
with shock died within 48 hours.
The total sample was classified into three groups:
shock non-survivors (n =10),shocksurvivors(n =57),
and sepsis survivors (n = 11). All children with sepsis
survived. Shock non-survivors were significantly younger
than shock survivors and sepsis survivors (P < 0.01).
Shock survivors stayed a median of 4.1 days (2.7 to 8.9
days) in the PICU; sepsis survivors stayed a median of
1.1 days (1.0 to 1.9 days) (P < 0.001).
Clinical parameters
Clinical parameters are depicted in Table 1. Median
PRISM score was 20 (14 to 29). PRISM scores and IL-6
levels for shock non-survivors were significantly higher
than those for both groups of survivors (P < 0.001), and
those for shock survivors were significantly higher than
those for sepsis survivors (P < 0.001). APC administra-
tion did not influence cortisol levels or coagulation pro-
file (data not shown). Concomitant therapy included
antibiotics and administrat ion of fluids in all children.
Forty-nine children were mechanically ventilated, and
Verhoeven et al. Critical Care 2011, 15:R44
/>Page 3 of 10
69 children received inotropic support. Thirty-five chil-
dren were intubated with a single dose of etomidate.
Indications for steroid use were catecholamine-resistant
septic shock, with or without hypoglycemia, and menin-
gitis. Nine children received glucocorticoids (hydrocorti-
sone or dexamethasone) just before admission to the
PICU; eight of them had catecholamine-resistant septic
shock and one had sepsis with meningitis. During
admission, another six children with septic shock
rec eived ster oids (hydrocortisone) because of catechola-
mine-resistant septic shock. One child experienced
severe hyperglycemia (glucose of greater than 20 mmol/L)
after PICU admission, was treated with insulin, and was
excluded from further analysis after admission. The other
children did not receive insulin treatment.
Nutrition and glucose intake
On admission, median glucose intake was 2.8 mg/kg per
minute (1.0 to 5.0 mg/kg per minute), which was not
significantly different between shock non-survivors,
shock survivors, and sepsis survivors (Table 1). Twenty-
four hours after admission, median glucose intake in
shock survivors was 5.2 mg/kg per minute (4.3 to
6.4 mg/kg per minute); 48 hours after admission, it was
4.4 mg/kg per minute (3.7 to 6.3 mg/kg per minute).
Most sepsis survivors were on a partial oral diet at 24
hours after admissio n, and this made it difficult to cal-
culate the exact glucose intake.
Blood analysis
Time course
The time course of laboratory parameters is depicted in
Table 2. On admission, 26 of the c hildren (33%) were
hyperglycemic: 1 shock non-survivor, 19 shock survi-
vors, and 6 sepsis survivors. One child (a shock survi-
vor) was hyp oglycemic. In general, shock survivors and
sepsis survivors h ad significantly higher blood glucose
levels on admission compared with shock non-survivors.
Hyperglycemia was present in 5 shock survivors and 1
shock non-survivor after 24 hours (11%) and in 3 shock
survivors after 48 hours (8%). Cortisol and cytokine
levels decreased to normal levels within 24 hours.
Insulinemic response
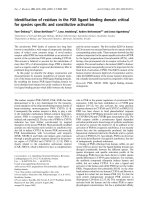
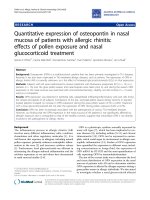
Association between glucose and insulin In Figure 1,
the association between glucose and insulin levels is
shown for the three groups. Hyperglycemic children had
significantly higher insulin levels (214 pmol/L, 128 to
375 pmol/L) and C-peptide levels (1.9 nmol/L, 0.8 to
3.7 nmol/L) in comparison with normoglycemic children
(insulin 57 pmol/L, 18 to 101 pmol/L; C-peptide
0.7 nmol/L, 0.3 to 1.6 nmol/L; P < 0.001 and P = 0.02,
respectively).
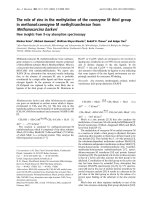
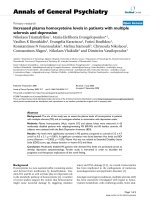
Influence of glucose infusion on insulinemic response
Because blood glucose levels and endogenous insulin
production are related to exogenous glucose administra-
tion, we assessed intravenous glucose i nfusion rates at
the times when blood glucose and insulin levels were
drawn (Figure 2). All children received parenteral glucose
infusions without enteral intake on admission. Glucose
intake rates were not significantly different between chil-
dren with normoglycemia and those with hyperglycemia
(2.4 mg/kg per minute, 0.8 to 5.0 mg/kg per minute ver-
sus 4.0 mg/kg per minute, 1.5 to 6.1 mg/kg per minute,
respectively; P = 0.14) or between shock non-survivors,
shock survivors, and sepsis survivors (Table 1).
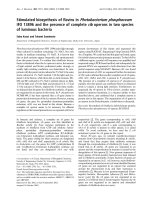
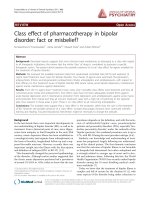
Homeostasis model assessment To determine the
occurrence of insulin resistance and decreased b-cell
function in hyperglycemic children, HOMA-%S and
HOMA-%B were calculated. Paired insulin and glucose
levels were used to calculate HOMA-%S. Paired C-
peptide (n = 35) or insulin (n = 43) levels and glucose
levels were used to calculate HOMA-%B. In Figure 3,
glucose and HOMA are plotted for the three groups.
Figure 3a shows the plot of glucose levels and insulin
sensitivity (HOMA-%S); Figure 3b shows the plot of glu-
cose levels and b-cell function (HOMA-%B). The scatter
Table 1 Patient characteristics on admission
Shock non-survivors Shock survivors Sepsis survivors
Number 10 57 11
Females/Males 2/8 24/33 6/5
Age, years 1.1 (0.6-2.2)
a,b
4.1 (1.8-9.3)
c
6.1 (2.8-11.4)
c
PRISM score 31 (25-35)
d,e
21 (16-28)
e,f
9 (8-11)
d,f
Inotropic medication, number (percentage) 10 (100%) 57 (100%) 2 (18%)
Vasopressor score 3 (3-3) 2 (1-3) 0 (0-1)
Mechanical ventilation, number (percentage) 10 (100%) 37 (65%) 2 (18%)
Steroid treatment, number (percentage) 2 (20%) 6 (11%) 1 (9%)
Prednisolone equivalents, mg/kg 0.9 (0.2-1.6) 2.4 (0.6-4.5) 1.0
Glucose intake, mg/kg per minute 3.3 (0-5.8) 3.9 (1.4-5.0) 1.1 (0.6-3.1)
Data are expressed as median (25th-75th percentile) unless indicated otherwise. The vasopressor score was developed by Hatherill and colleagues [26].
a
compared with shock survivors, P < 0.05;
b
compared with sepsis survivors, P < 0.05;
c
compared with shock non-survivors, P < 0.05;
d
compared with shock
survivors, P < 0.001;
e
compared with sepsis survivors, P < 0.001;
f
compared with shock non-survivors, P < 0.001. PRISM, pediatric risk of mortality.
Verhoeven et al. Critical Care 2011, 15:R44
/>Page 4 of 10
plots are divided into four zones by the x-axis reference
line r epresenting the maximum reference level for nor-
moglycemia (glucose of 8.3 mmol/L, 150 mg/dL) and a
y-axis refer ence line at 50% of normal insulin sensitivit y
(Figure 3a) or at 50% of normal b-cell f unction (Figure
3b). Zone D represents children with hyperglycemia and
Table 2 Laboratory parameters on admission and at 24 and 48 hours
Shock non-survivors Shock survivors Sepsis survivors
T
0
T
0
T
24
g
T
48
g
T
0
T
24
(n = 10) (n = 57) (n = 48) (n = 36) (n = 11) (n =6)
Glucose, mmol/L 4.9
a,b
7.2
,b,c
6.7 5.9 8.8
a,c
6.6
(2.7-7.0) (5.3-9.0) (5.9-7.8) (5.3-6.6) (7.5-10.5) (4.7-7.1)
Insulin, pmol/L <35
a,b
101
c
111 89 104
c
136
(<35-57) (35-197) (71-169) (61-157) (52-226) (51-236)
C-peptide, nmol/L - 1.1 2.0 1.5 1.0 1.7
(0.6-2.7) (1.0-3.0) (1.0-1.9) (0.5-1.8) (1.0-2.6)
Cortisol but not glucocorticoids, nmol/L 615
a,b
954
c
603 554 1,140
c
447
(510-930) (713-1,241) (430-1,409) (501-927) (1,066-1,409) (263-657)
FFAs, mmol/L 0.3 0.8 0.6 0.3 0.6 0.5
(0.2-0.5) (0.5-1.1) (0.4-0.8) (0.3-0.6) (0.5-0.7) (0.4-0.7)
Lactate, mmol/L 6.8
d,e
3.7
e,f
2.0 1.6 2.1
d,f
0.8
(5.1-8.0) (2.6-5.4) (1.5-2.8) (1.2-2.3) (1.6-2.7) (0.7-0.9)
CRP, mg/L 34
a,e
89
c
229 223 75
f
236
(23-41) (59-131) (181-274) (159-301) (36-191) (195-273)
IL-6, pg/mL 120 × 10
4d,f
3.5 × 10
4e,f
0.02 × 10
4b
0.01 × 10
4
0.04 × 10
4d,f
17
a
(70-160 × 10
4
) (1-16 × 10
4
) (0.01-0.2 × 10
4
) (0.003-0.03 × 10
4
) (82-1 × 10
4
) (<10-0.02 × 10
4
)
TNF-a, pg/mL 42
d
6
f
4 3
(20-127) (<5-10.5) (1-12) (1-10)
Children who received steroids before or on admission were excluded from determination of median cortisol levels. Data are expressed as median (25th-75th
percentile).
a
Compared with shock survivors, P < 0.05;
b
compared with sepsis survivors, P < 0.05;
c
compared with shock non-survivors, P < 0.05;
d
compared with
shock survivors, P < 0.001;
e
compared with sepsis survivors, P < 0.001;
f
compared with shock non-survivors, P < 0.001;
g
one patient with insulin therapy was
excluded. CRP, C-reactive protein; FFA, free fatty acid; IL-6, interleukin-6; T
0
, on admission; T
24
, at 24 hours after admission; T
48
, at 48 hours after admission; TNF-
a, tumor necrosis factor-alpha.
Figure 1 Relationship between plasma insulin levels and blood
glucose levels on admission in shock non-survivors, shock
survivors, and sepsis survivors (r = 0.67, P < 0.001).
Figure 2 Mean glucose intake rates and insulin levels on
admission in shock non-survivors, shock survivors, and sepsis
survivors. Bars represent mean insulin levels, and dots represent
glucose intake rates. Insulin levels in shock survivors and sepsis
survivors were significantly higher than in shock non-survivors (*P <
0.05). There were no differences in glucose intake between the
patient categories.
Verhoeven et al. Critical Care 2011, 15:R44
/>Page 5 of 10
insulin resistance; zone H represents children wit h
hyperglycemia and b-cell dysfunction. Figure 3a (zone
C) shows that insulin resistance also occurred in the
children with blood glucose levels of below 8 .3 mmol/L
but less frequently than in the hyperglycemic children.
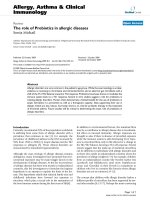
Sixty-two percent of hyperglycemic children were insu-
lin-resistant, 17% had b-cell dysfunction, and 21% had
both insulin resistance and b-cell dysfunction (Figure 4).
Influence of exogenous factors on glucose homeostasis
Influence of glucocorticoids Nine chi ldren were treated
with glucocorticoids just before admission. They tended
to have higher blood glucose (8.4 mmol/L, 5.4 to 12.4
mmol/L) and cortisol (1,308 nmol/L, 615 to 2,094 nmol/L)
levels on admission in comparison with the other chil-
dren (glucose 7.2 mmol/L, 5.3 to 8.9 mmol/L and cor-
tisol 955 nmol/L, 666 to 1,201 nmol/L), but these
differences were not significant (P =0.18andP = 0.22,
respectively). After admission, an additional six chil-
dren were treated with hydrocortisone (prednisolone
equivalent dose of 1.6 mg/kg, 0.5 to 3.1 mg/kg) within
24 hours. At 24 hours after admission, cortisol levels
(1,824 nmol/L, 270 to 8,490 nmol/L) in the children
with glucocorticoid treatment were significantly higher
than in those without glucocorticoid treatment (560
nmol/L,41to8,069nmol/L;P < 0.01); blood glucose
levels did not differ.
Influence of etomidate Thirty-five of the children were
intubated and had received a single dose of etomidate.
As we have previously shown that use of etomidate
negatively influenced blood glucose levels, we assessed
the influence of etomidate. The children who had
received etomidate showed significantly lower glucose
and cortisol levels (6.2 mmol/L, 4.7 to 8.5 mmol/L and
713 nmol/L, 555 to 958 nmol/L, respectively) on admi s-
sion in comparison with the other children (7.7 mmol/
L, 5.6 to 1 0.0 mmol/L and 1,133 nmol/L, 953 to 1,342
nmol/L, respectively; P < 0.01). At 24 hours aft er admis-
sion, blood glucose levels in etomidate-treated children
were significantly higher than in the others (7.2 mmol/L
Figure 3 Homeostasis model assessment and blood glucose
levels on admission in shock non-survivors, shock survivors,
and sepsis survivors. (a) Homeostatis model assessment of insulin
sensitivity (HOMA-%S). The vertical, x-axis reference line represents
the limit for normoglycemia (8.3 mmol/L). The horizontal, y-axis
reference line represents 50% of maximum insulin sensitivity.
(b) Homeostatis model assessment of b-cell function (HOMA-%B).
The vertical, x-axis reference line represents the limit for
normoglycemia (8.3 mmol/L). The horizontal, y-axis reference line
represents 50% of maximum b-cell function.
Figure 4 HOMA-%B plotted against HOMA-%S for
hyperglycemic shock non-survivors, shock survivors, and sepsis
survivors on admission. HOMA-%B, homeostatis model assessment
of b-cell function; HOMA-%S, homeostatis model assessment of
insulin sensitivity.
Verhoeven et al. Critical Care 2011, 15:R44
/>Page 6 of 10
versus 6.6 mmol/L; P = 0.03), presumably because of a
rebound effect. Multiple regression analysis showed that
the insulin and age effect on blood glucose levels as
described in section “Cor relations” was not influenced
by etomidate administration.
Correlations
Blood glucose levels correlated positively with plasma
insulin levels ( Figure 1; r = 0.67, P < 0.001), C-peptide
levels (r =0.46,P < 0.01), cortisol levels ( r =0.27,P <
0.05), and age (r =0.43,P < 0.001). Multiple regression
analysis revealed that both age and plasma i nsulin levels
on admission were factors positively related to b lood
glucose level (P = 0.035 and P < 0.001, respectively).
These two variables together explained 41% of the var-
iance in blood glucose level o n admission. The other
variables (glucose intake, cortisol level, [nor]-adrenaline
therapy, and steroid use) were not significantly related
to blood glucose level on admission. The two outcome
parameters, HOMA-%S and insulin-to-glucose ratio,
were significantly correlated (r =0.87,P <0.001).
C-peptide levels were strongly correlated with insulin
levels (r = 0.82, P < 0.001).
Discussion
Thi rty-three percent of all children in the present study
were hyperglycemic on admission, and one child was
hypoglycemic. Blood glucose levels in shock and sepsis
survivors were higher than in shock non-survivors.
Hyperglycemic children had significantly higher insulin
and C-peptide levels in comparison with normoglycemic
children. HOMA showed a predominance of insulin
resistance in hyperglycemic children, although b-cell
insufficiency or a combination of insulin resistance and
b-cell insufficiency was also seen. Multiple regression
analysis revealed that both age and plasma i nsulin levels
on admission were significantly related to blood glucose
level.
Hyperglycemia is a common finding in critically ill
children, and our results are in line with those of pre-
vious studies [8,11,14]. Whereas others have reported an
association between hyperglycemia and mortality [8-14],
we showed, in the present study, that shock non-
survivors had the lowest blood glucose levels. This study
concerns children with meningococcal sepsis and septic
shock, whereas the other studies included children with
mixed diagnoses. Only Branco and colleagues [12] stu-
died children with septic shock (various causes) and
showed that a peak glucose level of greater than 9.8
mmol/L was independently associated with an increased
risk of death (relative risk of 2.59).
In our study, insulin levels on admission were the low-
est in children who did not survive and were closely
related to the low blood glucose levels. The association
between a lower blood glucose level on admission and
mortality in the present study might be explained by th e
specific features of meningococcal disease, like the high
risk for relative adrenal insufficiency [5]. This could also
explain the positive correlation between blood glucose
levels and age, as the youngest children showed the
highest mortality rate in combinat ion with the lowest
blood glucose levels on admission. Previously, we
showed that the concomitant use of therapeutic drugs
such as etomidate, which was used i n almost half of the
studied children, influenced blood glucose levels as well
[5]. In accordance with previous findings, children intu-
bated with etomidate showed lower glucose and cortisol
levels on admission in compari son with those wi thout
etomidate. Hyperglycemia was associated with elevated
insulin levels in half of the children. HOMA showed
that insulin resistance as well as b-cell dysfunction
resulting in a hypoinsulinemicresponseresultedin
hyperglycemia. Insulin resistance, caused by h igh levels
of counter-regulatory hormones and cytokines, oxidative
stress, and therapeutic interventions (such as glucocorti-
coid and catecholamine administration), is the main
pathophysiological mechanism of hyperglycemia in criti-
cally ill patients [32].
Concerning therapeutic interventions, glucocorticoid
and catecholamine use in insulin-resistant hyperglyce-
mic children was more frequent than in those without
insulin resistance. However, the numbers were too small
to detect significant differences. Cortisol level on admis-
sion was positively correlated with plasma glucose level
in children without previous glucocorticoid treatment,
indicating that endogenous cortisol release is a causative
factor for hyperglycemia. Sepsis guidelines recommend
glucocorticoids for the treatment of vasopressor-depen-
dent septic shock [15]. Glucocorticoids stimulate hepatic
glucose p roduction, mainly by mobilizing substrate for
hepatic gluconeogenesis and activation of key hepatic
gluconeogenic enzymes. Furthermore, glucocorticoid
excess reduces glucose uptake and utilization by periph-
eral tissues, owing i n part to direct inhibition of glucose
transport into the cells [33]. Hyperglycemic episodes
were more common in adult septic shock patients who
received hydrocortisone in bolus therapy as compared
with those who received a cont inuous infusion wi th an
equivalent dose [34]. This important side effect of gluco-
corticoid treatment has not yet been addressed in stu-
dies in critically ill children.
Another important causative factor of hyperglycemia
might be the amount of glucose intake. In the present
study, children were considered to be fasting on admis-
sion, because the y received only a continuous glucose
infusion without enteral intake. Glucose intake did not
differ between normoglycemic and hyperglycemic chil-
dren. In critically ill adults, an association between
Verhoeven et al. Critical Care 2011, 15:R44
/>Page 7 of 10
hyperglycemia and a high glucose infusion rate (greater
than 5 mg/kg per minute) was shown [35]. On the other
hand, low-caloric parenteral nutrition in adult surgical
trauma patients re sulted in fewer hyperglycemic events
and lower insulin requirements [36]. Maximum glucose
oxidation rate s in severely burned children approximate
5 mg/kg per minute [37]. Exogen ous glucose in excess
of this amount ente rs non-oxidative pathways and is
unlikely to improve energy balance and lipogenesis and
may result in hyperglycemia [38,39].
Two studies have suggested that a hypoinsulinemic
response in critically ill children might result in hyper-
glycemia [18,40]. First, van Waardenburg and colleagues
[18] studied 16 children with meningococcal disease on
the third day of admission (10 shock survivors and 6
sepsis survivors). W hereas most children were normo-
glycemic, shock survivors had lower insulin levels
(50 pmol/L) and insulin-to-glucose ratios (8 pmol i nsu-
lin per mmol glucose) in comparison with sepsis survi-
vors (130 pm ol/L and 24 pmol insulin per mmol
glucose, respectively), suggesting normal or enhanced
insulin sensitivity in shock survivors. Second, Preissig
and Rigby [40] showed relatively low C-peptide levels
(1.5 nmol/L, 4.4 ng/mL) within 48 hours after admission
in hyperglycemic critically ill children with respiratory
and cardiovascular failure. Accordingly, the present
study also showed relatively low C-peptide levels for
shock survivors and sepsis survivors during admission
(1.0 to 1.7 nmol/L, 3.0 to 5.1 ng/mL). HOMA-%B based
on paired C-peptide, insulin, and glucose levels showed
b-cell dysfuncti on of the pancreas in 38% of hyperglyce-
mic children who were either shock or sepsis survivors.
The cause of pancreatic dysfunction could have many
factors, including elevations in pro-inflammatory cyto-
kines, catecholamines, and glucocorticoids. It was
hypothesized that b-cells become dysfunctional if phy-
siological changes occur acutely. When the same
changes occur more gradually, t his might allow b-cells
to adapt and function at supraphysiological levels over
time, resulting in insulin resistance. Also, b-cell exhaus-
tion is a known phenomenon characterized by an ability
to increase secretio n up to a certain level and thereafter
fail in response to further demand.
Finally, proinflammatory cytokines are important med-
iators of the hyperglycemic stress response. We did not
find correlations between cytokines and insulin levels or
HOMA-%S in hyperglycemic children, presumably
because of the relatively small sample size.
Forty-eight hours after admission, the percentage of
children with hyperglycemia had decreased from 33% to
8% without insulin therapy. In contrast, in critically ill
adult patients, hyperglycemia may persist for days to
weeks with or without insulin therapy [41]. This differ-
ence might be due to the rapid resolution of the acute
stress response that is seen in severely ill children with
meningococcal disease [5]. The present data also show
that the elevated cortisol and cytokine levels on admis-
sion decrease to normal values within 24 hours.
There are several limitat ions to this study. The hyper-
insulinemic euglycemic clamp technique is the ‘gold
standard’ for quantifying insulin sensitivity in vivo
because it directly measures the effects of insulin to pro-
mote glucose utilization under steady-state conditions. It
is not easily implemented, however, in large studies with
critically ill children. In the present study, therefore,
insulin sensitivity was indirectly assessed by investigating
the insulin response to glucose and by HOMA. Diabetes
studies and epidemiological studies on glucose tolerance
have frequently used HOMA, and recent reports have
shown its value for assessment of insulin sensitivity in
the critically ill [22,23]. Nevertheless, as we are the first
to use HOMA analysis to describe insulin resistance and
b-cell dysfunction in critically ill children, there are no
control data for HOMA for sick children and we have
to be careful in our conclusions. Under basal conditions,
the product of b-cell responsivity and insulin sensitivity
is assumed to be a constant, and different values of tol-
erance are represented by diffe rent hyperbo las [42]. We
have shown that, in critically ill children with impaired
glucose tolerance, b-cells can be dysfunctional, resulting
in an inadequate compensatory increase in insulin
release to the decreased insulin sensitivity.
Conclusions
Hyperglycemia with a blood glucose level of greater than
8.3 mmol/L on admission is frequently seen in children
with meningococcal sepsis and septic shock; hypoglycemia
is also seen but less frequently. Blood glucose levels in
most children spontaneously normalize within 48 hours,
at normal glucose intake and without insulin treatment.
Both insulin resist ance as well as b-cell dysfunction may
contribute to the occurrence of hyperglycemia in critically
ill children with meningococcal sepsis and septic shock.
Key messages
• Hyperglycemia with a b lood glucose level of
greater than 8.3 mmol/L (greater than 150 mg/dL)
on admission is seen in 33% of critically ill children
with meningococcal disease.
• Pathophysiologically, both a hyperinsulinemic and
a hypoinsulinemic response play a role in the occur-
rence of hyperglycemia in critically ill children with
meningococcal disease.
• Critically ill children with hyperglycemia can be
classified, on the basis of blood glucose level and
HOMA-%S and HOMA-%B, into those with overt
insulin resistance and those with decreased b-cell
function.
Verhoeven et al. Critical Care 2011, 15:R44
/>Page 8 of 10
• Children with meningococcal septic shock who do
not survive have the lowest levels of blood glucose
and insulin levels compared with those who survive.
• In children with meningococcal disease, normaliza-
tion of blood glucose levels occurs within 48 hours,
typically with normal glucose intake and without
insulin treatment.
Abbreviations
APC: activated protein C concentrate; CRP: C-reactive protein; FFA: free fatty
acid; HOMA: homeostasis model assessment; HOMA-%B: homeostasis model
assessment of β-cell function; HOMA-%S: homeostasis model assessment of
insulin sensitivity; IL-6: interleukin-6; PICU: pediatric intensive care unit; PO
2
:
partial pressure of oxygen; PRISM: pediatric risk of mortality.
Acknowledgements
The authors would like to acknowledge research nurse Marianne Maliepaard
for her assistance in data collection, Yolanda B de Rijke for the C-peptide
measurements, and Jacobus Hagoort for his careful editing. We are grateful
to Dick Tibboel for critically reviewing the manuscript.
Author details
1
Department of Intensive Care, Erasmus MC - Sophia Children’s Hospital, Dr.
Molewaterplein 60, Rotterdam, 3015 GJ, The Netherlands.
2
Department of
Pediatrics, Ghent University Hospital, De Pintelaan 185, Ghent, 9000, Belgium.
3
Department of Pediatric Endocrinology, Erasmus MC - Sophia Children’s
Hospital, Dr. Molewaterplein 60, Rotterdam, 3015 GJ, The Netherlands.
Authors’ contributions
JV performed literature searches and statistical analysis and wrote this paper
under the direct supervision of KJ. MdB participated in the coordination of
the study and carried out the data collection. AH-K participated in the
design of the study and helped to edit and revise the paper critically. JH
participated in the design and coordination of the study and helped to draft
the manuscript. KJ conceived of the study, participated in its design and
coordination, and helped to draft the manuscript. All authors read and
approved the final manuscript.
Competing interests
The authors declare that they have no competing interests.
Received: 14 June 2010 Revised: 29 September 2010
Accepted: 31 January 2011 Published: 31 January 2011
References
1. de Groof F, Joosten KF, Janssen JA, de Kleijn ED, Hazelzet JA, Hop WC,
Uitterlinden P, van Doorn J, Hokken-Koelega AC: Acute stress response in
children with meningococcal sepsis: important differences in the growth
hormone/insulin-like growth factor I axis between nonsurvivors and
survivors. J Clin Endocrinol Metab 2002, 87:3118-3124.
2. den Brinker M, Joosten KF, Visser TJ, Hop WC, de Rijke YB, Hazelzet JA,
Boonstra VH, Hokken-Koelega AC: Euthyroid sick syndrome in
meningococcal sepsis: the impact of peripheral thyroid hormone
metabolism and binding proteins. J Clin Endocrinol Metab 2005,
90:5613-5620.
3. Van den Berghe G: Endocrine changes in critically ill patients. Growth
Horm IGF Res 1999, 9(Suppl A):77-81.
4. den Brinker M, Joosten KF, Liem O, de Jong FH, Hop WC, Hazelzet JA, van
Dijk M, Hokken-Koelega AC: Adrenal insufficiency in meningococcal
sepsis: bioavailable cortisol levels and impact of interleukin-6 levels and
intubation with etomidate on adrenal function and mortality. J Clin
Endocrinol Metab 2005, 90:5110-5117.
5. Joosten KF, de Kleijn ED, Westerterp M, de Hoog M, Eijck FC, Hop WCJ,
Voort EV, Hazelzet JA, Hokken-Koelega AC: Endocrine and metabolic
responses in children with meningoccocal sepsis: striking differences
between survivors and nonsurvivors. J Clin Endocrinol Metab 2000,
85:3746-3753.
6. Hirshberg E, Larsen G, Van Duker H: Alterations in glucose homeostasis in
the pediatric intensive care unit: hyperglycemia and glucose variability
are associated with increased mortality and morbidity. Pediatr Crit Care
Med 2008, 9:361-366.
7. Yung M, Wilkins B, Norton L, Slater A: Glucose control, organ failure, and
mortality in pediatric intensive care. Pediatr Crit Care Med 2008,
9:147-152.
8. Srinivasan V, Spinella PC, Drott HR, Roth CL, Helfaer MA, Nadkarni V:
Association of timing, duration, and intensity of hyperglycemia with
intensive care unit mortality in critically ill children. Pediatr Crit Care Med
2004, 5:329-336.
9. Cochran A, Scaife ER, Hansen KW, Downey EC: Hyperglycemia and
outcomes from pediatric traumatic brain injury. J Trauma 2003,
55:1035-1038.
10. Wintergerst KA, Buckingham B, Gandrud L, Wong BJ, Kache S, Wilson DM:
Association of hypoglycemia, hyperglycemia, and glucose variability
with morbidity and death in the pediatric intensive care unit. Pediatrics
2006, 118:173-179.
11. Gore DC, Chinkes D, Heggers J, Herndon DN, Wolf SE, Desai M: Association
of hyperglycemia with increased mortality after severe burn injury. J
Trauma 2001, 51:540-544.
12. Branco RG, Garcia PC, Piva JP, Casartelli CH, Seibel V, Tasker RC: Glucose
level and risk of mortality in pediatric septic shock. Pediatr Crit Care Med
2005, 6:470-472.
13. Yates AR, Dyke PC, Taeed R, Hoffman TM, Hayes J, Feltes TF, Cua CL:
Hyperglycemia is a marker for poor outcome in the postoperative
pediatric cardiac patient. Pediatr Crit Care Med 2006, 7:351-355.
14. Faustino EV, Apkon M: Persistent hyperglycemia in critically ill children. J
Pediatr
2005, 146:30-34.
15.
Dellinger RP, Carlet JM, Masur H, Gerlach H, Calandra T, Cohen J, Gea-
Banacloche J, Keh D, Marshall JC, Parker MM, Ramsay G, Zimmerman JL,
Vincent JL, Levy MM: Surviving Sepsis Campaign guidelines for
management of severe sepsis and septic shock. Intensive Care Med 2004,
30:536-555.
16. Falcao G, Ulate K, Kouzekanani K, Bielefeld MR, Morales JM, Rotta AT:
Impact of postoperative hyperglycemia following surgical repair of
congenital cardiac defects. Pediatr Cardiol 2008, 29:628-636.
17. Buysse CM, Raat H, Hazelzet JA, Hulst JM, Cransberg K, Hop WC,
Vermunt LC, Utens EM, Maliepaard M, Joosten KF: Long-term health status
in childhood survivors of meningococcal septic shock. Arch Pediatr
Adolesc Med 2008, 162:1036-1041.
18. van Waardenburg DA, Jansen TC, Vos GD, Buurman WA: Hyperglycemia in
children with meningococcal sepsis and septic shock: the relation
between plasma levels of insulin and inflammatory mediators. J Clin
Endocrinol Metab 2006, 91:3916-3921.
19. Day KM, Haub N, Betts H, Inwald DP: Hyperglycemia is associated with
morbidity in critically ill children with meningococcal sepsis. Pediatr Crit
Care Med 2008, 9:636-640.
20. DeFronzo RA, Tobin JD, Andres R: Glucose clamp technique: a method for
quantifying insulin secretion and resistance. Am J Physiol 1979, 237:
E214-223.
21. Legro RS, Finegood D, Dunaif A: A fasting glucose to insulin ratio is a
useful measure of insulin sensitivity in women with polycystic ovary
syndrome. J Clin Endocrinol Metab 1998, 83:2694-2698.
22. Saberi F, Heyland D, Lam M, Rapson D, Jeejeebhoy K: Prevalence,
incidence, and clinical resolution of insulin resistance in critically ill
patients: an observational study. JPEN J Parenter Enteral Nutr 2008,
32:227-235.
23. Basi S, Pupim LB, Simmons EM, Sezer MT, Shyr Y, Freedman S, Chertow GM,
Mehta RL, Paganini E, Himmelfarb J, Ikizler TA: Insulin resistance in
critically ill patients with acute renal failure. Am J Physiol Renal Physiol
2005, 289:F259-264.
24. Wallace TM, Levy JC, Matthews DR: Use and abuse of HOMA modeling.
Diabetes Care 2004, 27:1487-1495.
25. Pollack MM, Ruttimann UE, Getson PR: Pediatric risk of mortality (PRISM)
score. Crit Care Med 1988, 16:1110-1116.
26. Hatherill M, Tibby SM, Hilliard T, Turner C, Murdoch IA: Adrenal
insufficiency in septic shock. Arch Dis Child 1999, 80:51-55.
27. Hulst JM, van Goudoever JB, Zimmermann LJ, Hop WC, Buller HA,
Tibboel D, Joosten KF: Adequate feeding and the usefulness of the
respiratory quotient in critically ill children. Nutrition 2005,
21:192-198.
Verhoeven et al. Critical Care 2011, 15:R44
/>Page 9 of 10
28. van den Berghe G, Wouters P, Weekers F, Verwaest C, Bruyninckx F,
Schetz M, Vlasselaers D, Ferdinande P, Lauwers P, Bouillon R: Intensive
insulin therapy in the critically ill patients. N Engl J Med 2001,
345:1359-1367.
29. Soldin OP, Dahlin JR, Gresham EG, King J, Soldin SJ: IMMULITE 2000 age
and sex-specific reference intervals for alpha fetoprotein, homocysteine,
insulin, insulin-like growth factor-1, insulin-like growth factor binding
protein-3, C-peptide, immunoglobulin E and intact parathyroid
hormone. Clin Biochem 2008, 41:937-942.
30. Parker MM, Hazelzet JA, Carcillo JA: Pediatric considerations. Crit Care Med
2004, 32:S591-594.
31. Hazelzet JA, van der Voort E, Lindemans J, ter Heerdt PG, Neijens HJ:
Relation between cytokines and routine laboratory data in children with
septic shock and purpura. Intensive Care Med 1994, 20:371-374.
32. Marik PE, Raghavan M: Stress-hyperglycemia, insulin and
immunomodulation in sepsis. Intensive Care Med 2004, 30:748-756.
33. Dimitriadis G, Leighton B, Parry-Billings M, Sasson S, Young M, Krause U,
Bevan S, Piva T, Wegener G, Newsholme EA: Effects of glucocorticoid
excess on the sensitivity of glucose transport and metabolism to insulin
in rat skeletal muscle. Biochem J 1997, 321(Pt 3):707-712.
34. Loisa P, Parviainen I, Tenhunen J, Hovilehto S, Ruokonen E: Effect of mode
of hydrocortisone administration on glycemic control in patients with
septic shock: a prospective randomized trial. Crit Care 2007, 11:R21.
35. Rosmarin DK, Wardlaw GM, Mirtallo J: Hyperglycemia associated with
high, continuous infusion rates of total parenteral nutrition dextrose.
Nutr Clin Pract 1996, 11:151-156.
36. Ahrens CL, Barletta JF, Kanji S, Tyburski JG, Wilson RF, Janisse JJ, Devlin JW:
Effect of low-calorie parenteral nutrition on the incidence and severity
of hyperglycemia in surgical patients: a randomized, controlled trial. Crit
Care Med 2005, 33:2507-2512.
37. Sheridan RL, Yu YM, Prelack K, Young VR, Burke JF, Tompkins RG: Maximal
parenteral glucose oxidation in hypermetabolic young children: a stable
isotope study. JPEN J Parenter Enteral Nutr 1998, 22:212-216.
38. Joosten KF, Verhoeven JJ, Hazelzet JA: Energy expenditure and substrate
utilization in mechanically ventilated children. Nutrition 1999, 15:444-448.
39. Verbruggen SC, Joosten KF, Castillo L, van Goudoever JB: Insulin therapy in
the pediatric intensive care unit. Clin Nutr 2007, 26:677-690.
40. Preissig CM, Rigby MR: Hyperglycaemia results from beta-cell dysfunction
in critically ill children with respiratory and cardiovascular failure: a
prospective observational study. Crit Care 2009, 13:R27.
41. Van den Berghe G, Wilmer A, Hermans G, Meersseman W, Wouters PJ,
Milants I, Van Wijngaerden E, Bobbaers H, Bouillon R: Intensive insulin
therapy in the medical ICU. N Engl J Med 2006, 354:449-461.
42. Cobelli C, Toffolo GM, Man CD, Campioni M, Denti P, Caumo A, Butler P,
Rizza R: Assessment of β-cell function in humans, simultaneously with
insulin sensitivity and hepatic extraction, from intravenous and oral
glucose tests. Am J Physiol Endocrinol Metab 2007, 293:E1-E15.
doi:10.1186/cc10006
Cite this article as: Verhoeven et al.: Pathophysiological aspects of
hyperglycemia in children with meningococcal sepsis and septic shock:
a prospective, observational cohort study. Critical Care 2011 15:R44.
Submit your next manuscript to BioMed Central
and take full advantage of:
• Convenient online submission
• Thorough peer review
• No space constraints or color figure charges
• Immediate publication on acceptance
• Inclusion in PubMed, CAS, Scopus and Google Scholar
• Research which is freely available for redistribution
Submit your manuscript at
www.biomedcentral.com/submit
Verhoeven et al. Critical Care 2011, 15:R44
/>Page 10 of 10