Báo cáo y học: " Administration of hydrogen sulfide via extracorporeal membrane lung ventilation in sheep with partial cardiopulmonary bypass perfusion: a proof of concept study on metabolic and vasomotor effects" ppt
Bạn đang xem bản rút gọn của tài liệu. Xem và tải ngay bản đầy đủ của tài liệu tại đây (900.04 KB, 10 trang )
RESEARCH Open Access
Administration of hydrogen sulfide via
extracorporeal membrane lung ventilation in
sheep with partial cardiopulmonary bypass
perfusion: a proof of concept study on metabolic
and vasomotor effects
Matthias Derwall
1,2*†
, Roland CE Francis
1†
, Kotaro Kida
1
, Masahiko Bougaki
1
, Ettore Crimi
1
, Christophe Adrie
1
,
Warren M Zapol
1
, Fumito Ichinose
1
Abstract
Introduction: Although inhalation of 80 parts per million (ppm) of hydrogen sulfide (H
2
S) reduces metabolism in
mice, doses higher than 200 ppm of H
2
S were required to depress metabolism in rats. We therefore hypothesized
that higher concentrations of H
2
S are required to reduce metabolism in larger mammals and humans. To avoid the
potential pulmonary toxicity of H
2
S inhalation at high concentrations, we investigated whether administering H
2
S
via ventilation of an extracorporeal membrane lung (ECML) would provide means to manipulate the metabolic rate
in sheep.
Methods: A partial venoarte rial cardiopulmonary bypass was established in anesthetized, ventilated (fraction of
inspired oxygen = 0.5) sheep. The ECML was alternately ventilated with air or air containing 100, 200, or 300 ppm
H
2
S for intervals of 1 hour. Metabolic rate was estimated on the basis of total CO
2
production (
VCO
2
) and O
2
consumption (
VO
2
). Continuous hemo dynamic monitoring was performed via indwelling femoral and pulmonary
artery catheters.
Results:
VCO
2
,
VO
2
, and cardiac output ranged within normal physiological limits when the ECML was
ventilated with air and did not change after administration of up to 300 ppm H
2
S. Administration of 100, 200 and
300 ppm H
2
S increased pulmonary vascular resistance by 46, 52 and 141 dyn·s/cm
5
, respectively (all P ≤ 0.05 for air
vs. 100, 200 and 300 ppm H
2
S, respectively), and mean pulmonary artery pressure by 4 mmHg ( P ≤ 0.05), 3 mmHg
(n.s.) and 11 mmHg (P ≤ 0.05), respectively, without cha nging pulmonary capillary wedge pressure or cardiac
output. Exposure to 300 ppm H
2
S decreased systemic vascular resistance from 1,561 ± 553 to 870 ± 138 dyn·s/cm
5
(P ≤ 0.05) and m ean arterial pressure from 121 ± 15 mmHg to 66 ± 11 mmHg (P ≤ 0.05). In addition, exposure to
300 ppm H
2
S impaired arterial oxygenation (P
a
O
2
114 ± 36 mmHg with air vs. 83 ± 23 mmHg with H
2
S; P ≤ 0.05).
Conclusions: Administration of up to 300 ppm H
2
S via ventilation of an extracorporeal membrane lung does not
reduce
VCO
2
and
VO
2
, but causes dose-dependent pulmonary vasoconstrictio n and systemic vasodilation. These
results suggest that administration of high concentrations of H
2
S in venoarterial cardiopulmonary bypass circulation
does not reduce metabolism in anesthetized sheep but confers systemic and pulmonary vasomotor effects.
* Correspondence:
† Contributed equally
1
Anesthesia Center for Critical Care Research, Department of Anesthesia,
Critical Care and Pain Medicine, Massachusetts General Hospital and Harvard
Medical School, 55 Fruit Street, Boston, MA 02114, USA
Full list of author information is available at the end of the article
Derwall et al. Critical Care 2011, 15:R51
/>© 2011 Derwall et al.; licensee BioMed Central Ltd. This is an open ac cess article distributed under the terms of the Creative Commons
Attribution License (http://cre ativecom mons.org/licenses/by/2.0), which permits unrestrict ed use, distribution, and reproduction in
any medium, provided the original work is properly cited.
Introduction
Balancing cellular oxygen supply and demand is a key
therapeutic approach to protecting organs such as the
brain, kidneys and heart from ischemic injury. Permis-
sive hypothermia and active cooling have been shown to
reduce oxygen demands in patients experiencing stroke,
cardiac arrest, cardiac surgery, severe trauma and other
instances of ischemia and subsequent reperfusion [1-4].
However, hypothermic reduc tion of aerobic metabolism
has been associated with adverse effects, including
increased rates of infection and coagulopathy [5,6].
Developing other methods to acutely reduce metabolism
in patients could be clinically useful.
Hydrogen sulfide (H
2
S) is an inhibitor of cytochrome
C oxidase in the mitochondrial electron transport chain
[7] that reduces metabolism and body temperature in
mice and rats [8,9]. Inhalation of H
2
Sorintravenous
administration of H
2
S donor compounds (NaHS or
Na
2
S) can protect rodents from hypoxia [10] or hemor-
rhagic shock [11], improve survival rates after cardiac
arrest and cardiopulmonary resuscitation in mice [12],
and attenuate myocardial ischemia-reperfusion injury in
both rodents [13] and pigs [14].
Although inhaling H
2
S at 60 to 80 ppm reduces meta-
bolism in mice, it has been reported that i nhaled H
2
S
does not depress total CO
2
production (
VCO
2
)and
total O
2
consumption (
VO
2
) in sedated, spontaneously
breathing sheep (60 ppm H
2
S) [15] or anesthetized, ven-
tilated piglets (20 to 80 ppm H
2
S) [16]. On the other
hand, Struve et al . [8] reported that inhalation of H
2
Sat
200 to 400 ppm, but not at 30 to 80 ppm, decreased
body temperature in rats. Similarly, Morrison et al. [11]
showed that inhaling H
2
S at 300 ppm was required to
decrease
VCO
2
in rats, in contrast to 80 ppm in mice.
While these observations suggest that higher levels of
H
2
S are likely to be required to alter metabolic rates in
larger animals [11], the effects of higher concentrations
of H
2
S on metabolism in larger mammals have not been
examined.
It is well documented, however, that inhalation of high
concentrations of H
2
S may i njure the b ronchial mucosa,
cause pulmonary edema, and impair gas exchange
[17,18]. To examine the impact of delivering higher con-
centrations of H
2
S to the body without incurring the
pulmonary toxicity of H
2
S inhalation, we administered
H
2
S gas via an extracorporeal membrane lung (ECML).
We hypothesized that high concentrations of H
2
S deliv-
ered via ECML in a partial venoarterial bypass system
delivering blood to the aortic root might reduce the
metabolic rate in sheep at rest. If ECML ventilation with
H
2
S was found to reduce the metabolic rate in sheep,
this method might provide a novel approach to balance
the supply and demand of oxygen in a variety of
situations, including in those patients who are supported
by extracorporeal circulation during cardiac surgery or
severe acute respiratory distress.
Materials and methods
All procedures described here were approved by the
Subcommittee on Research Animal Care of the Massa-
chusetts General Hospital, Boston, MA, USA, and
adhered to the principles of the Declaration of Helsinki
and the Recommendations for the Care and Use of
Animals.
Animal housing and maintenance
Five female purebred Polypay sheep (body weight: 30.6
± 2.5 kg, mean ± SD) were obtained from a single-
source breeder (New England Ovis LLC, Rollinsford,
NH, USA) and were housed under standard environ-
mental conditions (air-conditioned room at 22°C, 50%
relative humidity, 12-hour light-dark cycle) for at least 5
days prior to each study. Animals were fed standard
chow (Rumilab diet 5508; PMI Feeds Inc., St. Louis,
MO, USA) twice daily and were fasted for 24 hours
with free access to water before each experiment.
Instrumentation
After intramuscular premedication with 5 mg/kg keta-
mine (ketamine hydrochloride; Hospira Inc., Lake For-
est, IL, USA) and 0.1 mg/kg xylazine (Anased; Lloyd
Laboratories, Shenandoah, IA, USA), a venous cannula
(SurfloIVcatheter18G;Terumo,Elkton,MD,USA)
was inserted into an ear vein and a bolus of 0.1 to 0.2
mg/kg diazepam (Diazepam USP; Hospira, Lake Forest,
IL, USA) administered intravenously (iv). Subsequently,
the animals were placed in a supine position and were
intubated and mechanically ventilated with a volume-
controlled mode (fractionofinspiredoxygen(F
i
O
2
)
50%, tidal volume 10 ml/kg) (7200 Series Ventilator Sys-
tem; Puritan Bennett, Boulder, CO, USA). Anesthesia
was maintained by a constant rate infusion of ketamine
at 3 mg∙kg
-1
∙h
-1
anddiazepamat0.5mg∙kg
-1
∙h
-1
.
Respiratory rate was adjusted to maintain the end-tidal
CO
2
between 35 and 40 mmHg. An arterial catheter
(18G, FA-04018; Arrow Inc., Reading, PA, U SA) was
placed into the right femoral artery via percutaneous
puncture to monit or mean arterial pressure (MAP) and
to sample blood. Subsequently, an 8-Fr heptalumen pul-
monary artery catheter (746HF8; Edwards Lifesciences,
Irvine, CA, USA) was introduced through a percuta-
neous sheath (9 Fr, PB-09903; Arrow Inc., Reading, PA,
USA) into the left external jugular vein for blood sam-
pling and monitoring of mean pulmonary artery pres-
sure (MPAP), central venous pressure (CVP), pulmonary
capillary wedge pressure (PCWP), continuous cardiac
Derwall et al. Critical Care 2011, 15:R51
/>Page 2 of 10
output (CO) and blood temperature. Finally, a transure-
thral bladder catheter and a transesophageal gastric tube
were inserted to drain urine and gastric secretions. Dur-
ing the first hour after induction, animals received an
infusion of 500 ml of 6% hetastarch (Hextend; Hospira,
Lake Forest, IL, USA) and 500 ml of lactated Ringer’s
solution (Baxter, Deerfield, IL, USA); thereafter, 16
ml∙kg
-1
∙h
-1
of lactated Ringer’s solution and 9 ml∙kg
-1
∙h
-1
of 0.9% saline were infused to match fluid losses from
diuresis and gastric secretions.
Extracorporeal circulation
A 20-Fr single-stage venous cannula (DLP; Medtronic,
Minneapolis, MN, USA) and a 14-Fr arterial cannula
(Fem-Flex II; Medtronic) were surgically inserted and
advanced through the right external jugular vein and
right common carotid artery, respectively, thereby
enabling blood withdrawa l from the s uperior vena cava
and arterial blood return to the aortic root from the
extracorporeal cardiopulmonary bypass circuit. The
bypass circuit comprised a three-eighths-inch polyethy-
lene tubing line (3506; Medtronic), an occlusive roller
pump (Cardiovascular Instruments Corp., Wakefield,
MA, USA) and an ECML (Trillium 541TT Affinity;
Medtronic) with an integral heat exchanger, and it was
primed with a total extracorporeal priming volume of
500 ml of 0.9% saline. A bolus injection of unfractio-
nated heparin (200 IU/kg heparin sodium; APP Pharma-
ceuticals, LLC, Schaumburg, IL, USA) prio r to
cannulation, followed by a continuous infusion of 200
IU/kg unfractionated heparin per hour was used for
anticoagulation. A thermostat-controlled water bath
(Haake DC10-P5; Thermo Scientific, Waltham, MA,
USA) supplying the heat exchanger with circulating
water was maintained at 38°C. The gas compartment of
the oxygenator w as ventilated at a constant flow o f 5 l/
min with oxygen, air and H
2
S (10,000 ppm hydrogen
sulfide balanced with nitrogen; Airgas Specialty Gases,
Port Allen, LA, USA) blended to achieve an oxygen con-
centration of 21% with 0, 100, 200, or 300 ppm H
2
S.
A handheld iTX Multi-Gas detector (1 ppm detection
threshold; Industrial Scientific, Oakdale, PA, USA) was
used to monitor the H
2
S concentrations at the inlet and
outlet of the gas compartment.
Experimental procedures
Once partial venoarterial bypass perfusion was started,
the transmembrane blood flow was gra dually increased
to 1 l/min. Then the respiratory rate wa s reduced to
maintain an end-tidal partial pressure of CO
2
of 35 to
40 mmHg, and sheep were paralyzed (0.1 mg∙kg
-1
∙h
-1
of
pancuronium br omide iv; Sicor Pharmaceuticals, Irvine,
CA, USA) to prevent spontane ous respiratory activity,
asynchronous ventilation and excessive skeletal muscle
O
2
consumption. A 1-hour equilibration period was
allowed to achieve hemodynamic stability before base-
line measurements were taken.
During the following 6 hours, the ECML gas compart-
ment was alternately ventilated with either air or air
plus H
2
S for 1-hour intervals, thereby administering
0ppmH
2
S during the f irst hour, 100 ppm H
2
Sduring
the second hour, followed by 0 and 200 ppm during the
third and fourth hours and finally 0 and 300 ppm H
2
S
during the fifth and sixth hours. This procedure was
chosen to detect the hemodynamic and metabolic effects
of exposure to increasing H
2
S concentrations through
the membrane lung, as well as their reversibility.
Measurements and monitoring
A digital data acquisition system (PowerLab and Chart
softwar e version 5.0; ADInstruments, Colorado Springs,
CO, USA) was used to continuously record MAP,
CVP and MPAP. A Vigilance II Monitor (Edwards Life-
sciences) was used to continuously measure CO and cen-
tral blood temperature. End-tidal CO
2
,aswellasthe
total amount of CO
2
exhaled from the biological lungs
per unit of tim e (
VCO
L2
), was measured by an in-
stream, noninvasive, continuous monitoring device
(NICO Cardiopulmonary Management System; Philips
Respironics, Murrysville, PA, USA). Blood gas tensions,
hemoglobin concentrations, and acid-base balances were
determined in arteria l and mixed venous blood samples
using a standard blood gas analyzer (ABL 800 Flex;
Radiometer, Copenhagen, Denmark).
Plasma concentrations of H
2
S were measured in dupli-
cate as total sulfide concentrations using the methylene
blue formation method with modifications [19]. Briefly,
arterial and ECML-efferent blood was sampled and
immediately centrifuged at 4°C to obtain plasma. An ali-
quot of plasma (100 μl) was added with 2% zinc acetate
(200 μl) to trap the H
2
S, and 10 % trichloroacetic acid
(200 μl) was added to precipitate plasma proteins,
immediatel y followed by 20 mM N,N-di methyl- 1,4-phe-
nylenediamine sulfate in 7.2 M HCl (100 μl) and 30
mM FeCl
3
in 1.2 M HCl (100 μl). The reaction mixture
was incubated for 20 minutes at room temperature and
centrifuged at 14,000 rpm for 10 minutes. T he absor-
bance of the supernatant was measured at 670 nm using
a spectrophotometer. Total sulfide concentration was
calculated against a standard curve made with known
concentrations of Na
2
S solutions in phosphate-buffered
saline. The lower detection limit of this assay was
approximately 1 μM sulfide in plasma.
Calculation of carbon dioxide production
Total
VCO
2
was monitored continuously and was
calculated as the sum of CO
2
exhaled from the lungs
per unit of time (
VCO
L2
) and the amount of CO
2
Derwall et al. Critical Care 2011, 15:R51
/>Page 3 of 10
removed from the circulation via the membrane oxyge-
nator (
VCO
M2
), according to the following equations:
VCO V CO
L2 EE2
F ,
(1)
where
V
E
is the expiratory minute volume and F
E
CO
2
is the mean fraction of CO
2
in expired air. Quantifica-
tion of
V
E
and F
E
CO
2
and the calculation of
VCO
L2
were accomplished by a continuous noninvasive NICO
device (see ‘Measurements and monitoring’ section):
VCO Q CO
M2 gasM2
F ,
(2)
where Q
gas
is the total gas flow exhausted from the
membrane oxygenator and F
E
CO
2
is the fraction of CO
2
in the exhaust gas. Q
gas
was continuously monitored by
a m icroturbine flow meter (S-113 Flo-Meter; McMillan
Co.,Georgetown,TX,USA),andF
E
CO
2
was measured
by a sidestream infrared CO
2
analyzer (WMA-4; PP-Sys-
tems, Amesbury, MA, USA).
Calculation of oxygen consumption
Total
VO
2
was calculated on the basis of blood samples
drawn 10 minutes before the end of each period of
exposure to air or H
2
S as follows:
VO (c O -c O ) Q -(c O -c O ) Q
2a2v2Le2a2M
,
(3)
where c
a
O
2
is the oxygen content of arterial blood,
c
v
O
2
is the oxygen content of mixed venous blood, Q
L
is transpulmonary blood flow (here meaning continuous
CO measured via pulmonary artery catheter), c
e
O
2
is
the oxygen c ontent of ECML-efferent blood and Q
M
is
extrapulmonary blood flow (here meaning transmem-
brane blood flow). Blood oxygen content (cO
2
)wascal-
culated according to the following general equation:
cO [Hb] O Hb 1.34 pO 0.003
22 2
F ,
(4)
where [Hb] is the hemoglobin concentration, FO
2
Hb
is the fraction of oxyhemoglobin, 1.34 is Hüfner’scon-
stant and pO
2
is the oxygen tension.
Statistical analysis
Statistical analysis was performed using the SPSS 14.0
data package for Windows (SPSS, Chicago, IL, USA)
and GraphPad Prism version 5.02 software (GraphPad
Software, La Jolla, CA, USA). All data are reported as
means ± SD unless indicated otherwise. Hemodynamic
parameters,
VCO
2
and body temperature were mea-
sured continuously and are reported as the mean v alue
derived from the last 10 minutes of each period of expo-
suretoairorH
2
S. In addition, hemodynamic para-
meter s were averaged every 5 minutes for a time course
analysis, and these data are displayed in Figures 1 and 2.
Blood gas tensi on analysis, determination of blood
hemoglobin concentrations and quantification of H
2
S
plasma concentrations required blood sampling. Samples
were obtained during the last 5 minutes of each period
of exposure. Depending on the distribution of the data
as determined using the Shapiro-Wilk test for normal
distribution, either Student’s t-test or the Wilcoxon
signed-rank test was performed to compare each H
2
S
ventilation period with the respective baseline period (0
ppm H
2
S). Statistical significance was assumed at P ≤
0.05. On the basis of data derived from pilot experi-
ments, power and sample size calculations were per-
formed using PS: Power and Sample Size Calculation
version 2.1.31 software by Dupont and Plummer [20].
Results
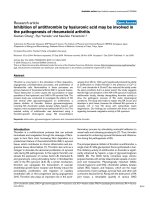
Metabolic effects of H
2
S administration
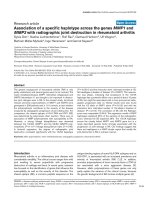
The baseline
VCO
2
value was stably near approximately
3.4 ml∙kg
-1
∙min
-1
when the ECML was ventilated with
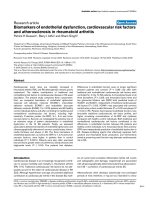
air. Direct diffusion of H
2
S into blood via the ECML at
100, 200 or 300 ppm did not alter
VCO
2
(Figure 3) or
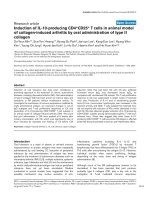
VO
2
(Figure 4). The temperature of the ECML heat
exchanger water bath was kept at 38°C and resulted in a
constant central blood temperature of 37.4 ± 0.4°C
throughout the experiment (Table 1).
Hemodynamic effects of H
2
S administration
Aft er 1 hour o f exposure to either 100 or 200 ppm H
2
S
via ECML ventilation and partial venoarterial perfusion,
MAP was not different from baseline. However, expo-
sure to 300 ppm H
2
S for 1 hour decreased MAP from
121 ± 15 mmHg to 66 ± 11 mmHg and reduced
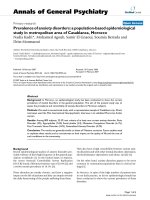
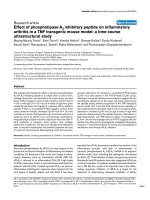
Figure 1 Systemi c vascular h emodynamics. Systemic vascular
hemodynamics in five sheep challenged with alternate exposure to
hydrogen sulfide (H
2
S) (gray bars) by ventilation of an
extracorporeal membrane lung with 0 or 100 ppm H
2
S in air, 200
ppm H
2
S in air and 300 ppm H
2
S in air for 1-hour intervals each.
Data are presented as means ± standard error of the mean. MAP,
mean arterial pressure; CO, cardiac output; SVR, systemic vascular
resistance; ppm, parts per million.
Derwall et al. Critical Care 2011, 15:R51
/>Page 4 of 10
systemic vascular resistance (SVR) from 1561 ± 553
dyn·s/cm
5
to 870 ± 138 dyn·s/cm
5
(Table 1). We noted
that MAP increased transiently during exposure to 100
and 200 ppm H
2
S (Figure 1) and that this increase was
rapidly reversed u pon application of air without added
H
2
S. Subsequently, exposure to 300 ppm H
2
S induced a
biphasic systemic pressor response characterized by
increased MAP and SVR during the first 20 minutes of
H
2
S exposure followed by a rapid decrease of MAP and
pronounced irreversible hypotension (Figure 1).
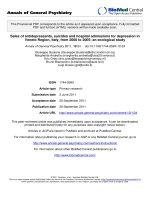
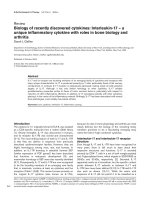
MPAP and pulmonary vascular resistance (PVR)
increased in response to H
2
S exposure, with the greatest
increase (ΔMPAP, approximately 10 mmHg; ΔPVR,
+51%) observed in response to 300 ppm H
2
S(Table1).
Time course analysis (Figure 2) suggested that PVR
increased after exposure to 100, 200 and 300 ppm H
2
S
in a reversible, dose-dependent manner. Heart rate and
CO did not change in response to H
2
S exposure.
Pulmonary gas exchange and acid-base status
Arterial CO
2
tension levels were within physiological lim-
its throughout the experiment and did not change in
response to H
2
S. Mixed venous CO
2
tension (P
v
CO
2
)
ranged between 35 and 41 mmHg and did not change in
response to H
2
S. While arterial oxygenation (P
a
O
2
)was
not significantly affected by 100 or 200 ppm H
2
S, P
a
O
2
decreased from 114 ± 36 to 83 ± 23 mmHg (P ≤ 0.05)
upon administration of 300 ppm H
2
S. Arterial oxygen
tension did not recover during the subsequent interval of
air exposure without H
2
S. Mixed venous O
2
tension ran-
ged between 50 and 56 mmHg, and there was no relevant
change upon H
2
S administration. While arterial pH (pH
a
)
was within physiological limits throughout the experi-
ment, significant metabolic acidosis was observed during
exposure to 300 ppm H
2
S, with concomitant changes in
mixed venous pH. Arterial hemoglobin concentrations
were near 9 g/dl throughout the experiment. Exposure to
200 ppm H
2
S transiently increased hemoglobin concen-
trations by 2 ± 0 g/dl (Table 1).
Total plasma sulfide concentrations
Plasma sulfide concentrations were determined in dupli-
cate from arterial and ECML-efferent blood. The base-
line plasma concentration of sulfide was 1.9 ± 0.3 μM,
and this value was only slightly higher than the lower
detection limit (approximately 1 μM) for this assay.
Ventilation of ECML with air did not affect plasma
Figure 2 Pulmonary vascular hemodynamics. Pulmonary vascular
hemodynamics in five sheep challenged with alternate exposure to
hydrogen sulfide (H
2
S) (gray bars) by ventilation of an
extracorporeal membrane lung with 0 or 100 ppm H
2
S in air, 200
ppm H
2
S in air and 300 ppm H
2
S in air for 1-hour intervals each.
Data are presented as means ± standard error of the mean. MPAP,
mean pulmonary artery pressure; CO, cardiac output; PVR,
pulmonary vascular resistance; ppm, parts per million.
Figure 3 Carbon dioxid e production during administration of
hydrogen sulfide (H
2
S). Total carbon dioxide production (
VCO
2
)
in five sheep challenged with alternate exposure to H
2
Sby
ventilation of an extracorporeal membrane lung with 0 or 100 ppm
H
2
Sinair,200ppmH
2
S in air and 300 ppm H
2
S in air for 1-hour
intervals each. Values are derived from the last 10 minutes of each
period of exposure to air or H
2
S and are presented as means ±
standard error of the mean. ppm, parts per million; n.s. = P > 0.05.
Figure 4 Oxygen consumption d uring administration of
hydrogen sulfide (H
2
S). Total carbon dioxide production (
VO
2
)
in five sheep challenged with alternate exposure to H
2
Sby
ventilation of an extracorporeal membrane lung with 0 or 100 ppm
H
2
S in air, 200 ppm H
2
S in air and 300 ppm H
2
S in air for 1-hour
intervals each. Values are derived from blood samples taken during
the last 10 minutes of each period of exposure to air or H
2
S and are
presented as means ± standard error of the mean. ppm, parts per
million; n.s. = P > 0.05.
Derwall et al. Critical Care 2011, 15:R51
/>Page 5 of 10
sulfide concentrations in the efferent blood of the
ECML. In E CML-efferent blood, plasma sulfide concen -
tration increased to 7 ± 6, 27 ± 6 and 62 ± 12 μM/l
during ECML ventilation with 100, 200 and 300 ppm
H
2
S, respectively. However, no sulfide was det ected in
plasma samples of blood collected from the femoral
artery during exposure to 100, 200 or 300 ppm H
2
S.
Discussion
The results of the present study reveal that ven tilating
an ECML with up to 300 ppm H
2
S in venoarterial car-
diac bypass circulation does not reduce whole body CO
2
production or O
2
consumption in anesthetized sheep. In
addition, we have demonstrated that administration of
300 ppm H
2
S via EC ML ventilation causes significant
adverse effects, including pulmonary vasoconstriction,
systemic vasodilation and hypox emia. The current
results do not support the hypothesis that high concen-
trations of H
2
S delivered via an ECML can reduce the
metabolic rate in large mammals at rest.
In an attempt to bypass the direct pulmonary toxicity of
inhaled H
2
S, we used an ECML to directly diffuse high
concentrations of H
2
S gas into the bl ood. The absence of
H
2
S (lower limit of detection 1 ppm) in the gas outlet of
the artificial lung during ventilation with up to 300 ppm
H
2
S indicates that H
2
S is highly diffusible into blood
through the membrane and that a single pass age is suffi-
cient for complete uptake of the gas. Thus, assuming com-
plete uptake of H
2
S during ventilation of the ECML at a
gas flow of 5 l/min with 300 ppm H
2
S (at standard condi-
tions for temperature and pressure), a total amount of 1.5
ml of H
2
S (that is, approximately 67 μM) are administered
via the membrane every minute. This sums to about 134
μMH
2
S/kg per hour delivered to a 30-kg sheep in the cur-
rent study. In contrast, the total amount of H
2
S adminis-
tered in previous studies in sheep [15] and pigs [16] wer e
approximately 13 μM/kg/h and approximately 42 μM/kg/
h, respectively, assuming complete uptake of H
2
Sfromthe
alveolar space and an alveolar ventilation of 6 l/min in a
74-kg sheep, and 1.2 l/min in a 6-kg pig. Therefore, the
systemic dose of H
2
S supplied in the present study was
about three times greater than that applied in pigs and 10
times greater than the dose applied in sheep. If any of the
alveolar H
2
S were exhaled, the ratio of the uptake via the
membrane artificial lung in the present study and the
uptake via the natural lungs in previous reports would be
even greater. Nonetheless, our measurements suggest that
administration of H
2
Supto134μM/kg/h does not reduce
VCO
2
or
VO
2
in sheep.
Table 1 Hemodynamics and blood gas data
a
Parameter 0 ppm 100 ppm 0 ppm 200 ppm 0 ppm 300 ppm
Hemodynamics, means ± SD
HR, beats/min 139 ± 24 148 ± 29 154 ± 5 172 ± 28 165 ± 28 150 ± 31
MAP, mmHg 110 ± 13 117 ± 14 115 ± 11 128 ± 16 121 ± 15 66 ± 11
b
MPAP, mmHg 15 ± 3 19 ± 3* 19 ± 3 22 ± 4 20 ± 4.0 31 ± 7
b
CO, l/min 4.6 ± 1.4 4.9 ± 2.0 5.1 ± 1.5 5.2 ± 1.7 5.8 ± 2.3 5.5 ± 1.2
CVP, mmHg 9 ± 2 9 ± 1.0 10 ± 1 11 ± 2 11 ± 1 11 ± 2
PCWP, mmHg 7 ± 2 7 ± 2 7 ± 8 8 ± 2 9 ± 2 10 ± 2
SVR, dyn·s/cm
5
1,843 ± 435 1,948 ± 525 1,734 ± 412 2,009 ± 703
b
1,561 ± 553 870 ± 138
b
PVR, dyn·s/cm
5
145 ± 32 191 ± 52
b
203 ± 36 255 ± 70
b
138 ± 27 279 ± 138
b
Hb, pH, blood gas tensions, and temperature, means ±
SD
Hb
a
, g/dl 8.6 ± 1.3 9.0 ± 1.3 9.1 ± 1.0 11.1 ± 1.4
b
9.5 ± 0.6 9.6 ± 1.2
pH
a
7.401 ±
0.072
7.369 ±
0.079
7.375 ±
0.051
7.346 ±
0.063
7.312 ±
0.089
7.217 ±
0.064
b
P
a
O
2
, mmHg 161 ± 28 150 ± 40 150 ± 37 107 ± 39 114 ± 36 83 ± 23
b
P
a
CO
2
, mmHg 38 ± 13 38 ± 11 35 ± 7 34 ± 5 36 ± 7.0 38 ± 4
pH
v
7.383 ±
0.074
7.360 ±
0.080
7.360 ±
0.056
7.346 ±
0.066
7.302 ±
0.087
7.210 ±
0.068
b
P
v
O
2
, mmHg 50 ± 5 52 ± 6
b
52 ± 4 54 ± 4 56 ± 4 52 ± 7
P
v
CO
2
, mmHg 41 ± 14 41 ± 11 38 ± 8 35 ± 5 38 ± 6 40 ± 4
Temperature,°C 37.5 ± 0.6 37.5 ± 0.4 37.5 ± 0.3 37.3 ± 0.4 37.3 ± 0.4 37.1 ± 0.5
a
Hemodynamics and blood gas data in five sheep challenged with alternate exposure to H
2
S by ventilation of an extracorporeal membrane lung with 0 or 100
ppm H
2
S, 200 ppm H
2
S or 300 ppm H
2
S in air for 1-hour intervals each. ppm, parts per million; HR, heart rate; MAP, mean arterial pressure; MPAP, mean
pulmonary artery pressure; CO, cardiac output; CVP, central venous pressure; PCWP, pulmonary capillary wedge pressure; SVR, systemic vascular resistance; PVR,
pulmonary vascular resistance; Hb
a
, arterial hemoglobin concentration; pH
a
, arterial pH; P
a
O
2
, arterial oxygen tension; P
a
CO
2
, arterial carbon dioxide tension; pH
v
,
mixed venous pH; P
v
O
2
, mixed venous oxygen tension; P
v
CO
2
, mixed venous carbon dioxide tension. All values are means ± SD and reflect the last 10 minutes of
each 1-hour period. n = 5. Values during H
2
S exposure were compared using Student’s t-test or the Wilcoxon signed-rank test with the preceding 0 ppm
baseline period, that is, first vs. second hour, third vs. fourth hour and fifth vs. sixth hour;
b
P ≤ 0.05.
Derwall et al. Critical Care 2011, 15:R51
/>Page 6 of 10
While H
2
S did not reduce
VCO
2
or
VO
2
in sheep in
the present study, Simon et al. [21] reported that con-
tinuous iv infusion of N a
2
S for 8 hours decreased the
core body temperature and
VCO
2
and
VO
2
levels in
pigs, suggesting that it is possible to reduce metabolic
rates in large mammals using a sulfide-based approach.
However, it is important to note that hypothermia itself
reduces the metabolic rate (Q
10
effect). Therefore, in the
current study, body t emperature was kept at 37°C
throughout the experiment to exclude any effects of
hypothermia on metabolism. Whether systemic adminis-
tration of Na
2
S reduces metabolic rates in large mam-
mals when normothermia is maintained remains to be
determined.
While our findings support the inability of H
2
Sto
reduce metabolism in large mammals, these results dif-
fer from observations in mice in which H
2
Sinhalation
markedly reduced metabolism [9,10,22]. Hydrogen sul-
fidemaybeone,butnottheonly,triggerformurine
metabolic depression. Indeed, hypoxia, anemia and
exposure to carbon monoxide have been reported to
reduce aerobic metabolism in mice [23-25], but not in
large mammals [26-28]. Of note is that mice are known
to have a much higher specific metabolic rate (approxi-
mately 168 kcal kg
-1
∙d
-1
in a 30-g mouse) than sheep
(approximately 30 kcal kg
-1
∙d
-1
in a 30-kg sheep) [29]. In
a previous study, we reported that H
2
S inhalation
reduced metabolism in awake, spontaneously breathing
mice by abou t 40% during normothermia, resulting in a
specific metabolic rate of no more than approximately
100 kcal∙kg
-1
∙d
-1
[9]. In contrast, it has been reported
that H
2
S inhalation at 100 ppm faile d to reduce CO
2
production in normothermic mice that were anesthe-
tized and mechanically ventilated [30]. Interestingly, in
anesthetized mice studied by Baumgart et a l.[30],the
baseline CO
2
production rate before H
2
Sinhalationwas
appr oximately 50% less than that in awake mice studied
by Volpato et al. [9] in our laboratory. It is tempting to
speculate that the ability of H
2
S to reduce metabolism
depends on the specific metabolic rate of animals. H
2
S
may reduce metabolism when the baseline rate of meta-
bolism is high (for example, in awake mice), but not
when the metabolic rate is already depressed (for exam-
ple, in anesthetized mice or sheep).
Along these lines, it may be possible to reduce the
metabolic rate in larger mammals using H
2
Swhen
metabolism is increased. It has been reported that inha-
lation of 10 ppm H
2
S reduced oxygen consumption in
exercising healthy volunteers, presumably due to i nhibi-
tion of aerobiosis in exercising muscle [31]. Inhibitory
effects of H
2
S in the presence of increased metabolism
in larger mammals warrants further study.
Our results show that administration of H
2
S via a cardi-
opulmonary bypass circulation can cause significant dose-
dependent pulmonary vasoconstriction. These observa-
tions are consistent with the pulmonary vasoconstrictor
effects of H
2
S in mammalian pulmonary vessels reported
by Olson et al.[32].AlthoughapotentialroleofH
2
Sin
hypoxia sensing (hence hypoxic pulmonary vasoconstric-
tion) has been suggested [33], the mechanisms responsible
for the pulmonary vasoconstrictor effects of H
2
S remain
to be further elucidated.
Administration of H
2
S also tended to increase sys-
temic vascular resistance, but resulted in systemic vaso-
dilation after 30 minutes of ECML ventilation with 300
ppm H
2
S. This is consistent with previous reports
demonstrating that H
2
S can produce both vasoconstric-
tion and vasorelaxation in isolated rat aortic ring seg-
mentsinanO
2
concentration-dependent manner.
Koenitzer et al.[34]reportedthatH
2
S(5to80μM
Na
2
S solution) causes vasorelaxation at O
2
concentra-
tions r eflecting the physiological oxygen tension in the
peripheral vasculature (O
2
concentration, 40 μM). In
contrast, at high O
2
concentrations (O
2
,200μM) under
which H
2
S is rapidly oxidized to sulfite, sulfate or thio-
sulfate, the administration of 5 to 100 μMNa
2
S causes
rat aortic vasoconstric tion, and more than 200 μMNa
2
S
are required to cause vasorelaxation [34]. Along these
lines, the high oxygen tension observed in sheep on
ECML when ventilated with 100 and 200 ppm of H
2
S
may have contributed to the systemic vasoconstrictor
effects of H
2
S in the present study, whereas vasodilation
was only observed at the highest H
2
S concentration
(300 ppm). In addition, the O
2
dependency of H
2
S-
mediated vasoconstriction may also explain why H
2
S
caused vasoconstriction in the pulmonary vasculature,
where O
2
availability is consistently high.
While the toxicity of inhaling h igh levels of H
2
Sis
well documented, the reported toxicity of H
2
Sconcen-
trations up to 500 ppm is almost exclusively limited to
mucosal membranes and the central nervous system
[35-37]. However, the cardiovascular toxicity of high
levels of inhaled H
2
S has not been reported. The
observed pulmonar y hypertension and apparent changes
in systemic vascular tone in the current study may
therefore represent previously unrecognized toxic effects
of high levels of H
2
S in the circulation.
Despite the availability of various methods used to
quantify sulfide in biological fluids, it remains challen-
ging to measure circulating plasma concentr ations of
H
2
S [38]. The methylene blue formation method
employed here measures “labile” total sulfide liberated
from sulfur compounds, but not free H
2
S in blood and
tissue. In the current study, considerable sulfide concen-
trations were dete cted in pla sma obtained from blood
Derwall et al. Critical Care 2011, 15:R51
/>Page 7 of 10
efferent from the ECML, but not in the blood samples
from the femoral artery (sampled less than approxi-
mately 10 seconds after the blood left the ECML).
These observations suggest a rapid uptake of H
2
Sintoa
varietyofsulfidepoolsonceH
2
S has entered the blood
stream. Of note is that the measured plasma sulfide
level of 62 μM/l in the ECML efferent blood diffused
with 300 ppm H
2
S was only about 3% of the expected
sulfide level of approximately 2,000 μM/l assuming a
blood volume of 70 ml/kg. These results are consistent
with a recent report that circulating free sulfide levels
are almost undetectably low at baseline and that exo-
genous sulfide is also rapidly removed from the circulat-
ing plasma [39]. Nonetheless, the pronounced
vasoreactivity induced by H
2
S administration observed
in the current study suggests that H
2
S (and/or its active
metabolites) is transported to the periphery and exerts
biological effects. The fate of exogenously administered
H
2
S remains to be determined in future studies using
more sensitive methods.
Although the results of the current study do not sug-
gest that H
2
S can be used to reduce metabolic rate in
larger mammals, these results do not refute the potential
organ protective effects of H
2
S reported elsewhere. The
dose of 134 μM/kg/h that was applied here is almost 20
times higher than the effective dose of Na
2
S reported to
improvesurvivalinmiceaftercardiacarrest(0.55μg/g,
that is, approximately 7 μM/kg) [12]. Studies by others
have also shown that administration of H
2
Sdonorsina
similarlylowdoserangewereabletoprotectorgans
from ischemi c insults in rodents and pigs without redu-
cing metabolic rate or body temperature [14,40]. Taken
together, it is conceivable that organ-protective effects
and metabolic effects of H
2
S may be mediated via two
different mechanisms and/or at different concentrations.
Limitations
Measuring oxygen consumption is a valuable tool to
assess metabolic rate. However, quantification of oxygen
consumption in the setting of ECML requires serial
simultaneous deter minations of oxygen content in arter-
ial and mixed venous blood as well as blood afferent
and efferent to the ECML [41]. Small measuring inac-
curacies in the parameters needed to calculate oxygen
content (hemoglobin, oxygen saturation and tension)
result in an exponential increase in the overall inaccu-
racy of the calculated
VO
2
value. In contrast, measuring
CO
2
production requires only CO
2
quantification in the
exhaled gas of both the natural and the artificial lung
because virtually no CO
2
is present in the inhaled gas
mixture, which is a major advantage to simplifying the
setup and avo iding exponential error. Therefore,
VCO
2
may be the more reliable index for estimating the meta-
bolic rate in this study.
The present study was designed to detect a reduction
in metabolic rate of about 30% in sheep. On the basis of
the variance of metabolic rates determined in pilot
experiments in sheep, a sample size of 12 sheep was cal-
culated to find a 30% reduction in metabolic rate (80%
power and 5% probability of error). An interim analysis
of this study (n = 5) did not substantia te a signif icant
change or trend in
VCO
2
(Figure 3) and precluded
additional experiments.
Conclusions
The results of the present study demonstrate that venti-
lating an ECML with up to 300 ppm H
2
S in partial car-
diopulmonary bypass circulation does not reduce CO
2
production or O
2
consumption in anesthetized sheep.
Our results show that diffusion of up to 300 ppm H
2
S
into blood via a membrane lung can cause dose-depen-
dent pulmonary vasoconstriction, hypoxemia and cata-
strophic systemic vasodilation. These observations do
not support the hypothesis that administra tion of a high
concentration of H
2
S reduces metabolism in anesthe-
tized large mammals. Whether the administration of
H
2
S inhibits metabolism in large mammals when meta-
bolic rate is increased (for example, systemic inflamma-
tion or exercise) remains to be determined.
Key messages
• High concentrations of H
2
S administered via ECML
ventilation do not alter CO
2
production in sheep on
partial cardiopulmonary bypass perfusion.
• In this setting, H
2
S poses the risk of pulmonary vaso-
constriction, hypoxemia and systemic vasodilation.
• Therefore, administration of high concentrations of
H
2
S via membrane lung may not be useful for redu-
cing oxidative metabolism in large mammals.
Abbreviations
c
a
O
2
: arterial oxygen content; c
e
O
2
: efferent oxygen content; CO: cardiac
output; CO
2
: carbon dioxide; c
v
O
2
: mixed venous oxygen content; CVP:
central venous pressure; ECML: extracorporeal membrane lung; FeCl
3
: iron(III)
chloride; F
E
CO
2
: mean fraction of CO
2
in expired air; F
i
O
2
: fraction of inspired
oxygen; Hb: hemoglobin concentration; HCl: hydrogen chloride; HR: heart
rate; H
2
S: hydrogen sulfide; iv: intravenously; MAP: mean arterial pressure;
mmHg: millimeters of mercury; MPAP: mean pulmonary artery pressure;
NaHS: sodium hydrosulfide; Na
2
S: sodium sulfide; O
2
: oxygen; p
a
CO
2
, PCWP:
pulmonary capillary wedge pressure; arterial carbon dioxide tension; pH
a
:
arterial pH; ppm: parts per million; pO
2
: oxygen tension; V
˙
CO
2
: carbon
dioxide production; V
˙
O
2
: oxygen consumption; V
˙
E
: expiratory minute
volume; V
˙
L
CO
2
: amount of CO
2
exhaled from the lungs per unit of time;
V
˙
M
CO
2
: amount of CO
2
removed from the circulation via membrane
oxygenator per unit of time.
Acknowledgements
This work was supported by fellowship grants from the German Research
Foundation (Deutsche Forschungsgemeinschaft) to MD (DE 1685/1-1) and
RCF (FR 2555/3-1), by laboratory funds of WMZ and National Institutes of
Health grant R01 HL101930 to FI. CA was supported by the Arthur Sachs
Scholarship Fund. We are indebted to Dr. Kenneth D. Bloch from the
Derwall et al. Critical Care 2011, 15:R51
/>Page 8 of 10
Department of Anesthesia, Critical Care and Pain Medicine, Massachusetts
General Hospital, for advice and assistance in the design of the study and in
the editing of the manuscript.
Author details
1
Anesthesia Center for Critical Care Research, Department of Anesthesia,
Critical Care and Pain Medicine, Massachusetts General Hospital and Harvard
Medical School, 55 Fruit Street, Boston, MA 02114, USA.
2
Department of
Anesthesia, Medical Faculty, RWTH Aachen University, Pauwelsstrasse 30, D-
52074 Aachen, Germany.
Authors’ contributions
MD and RCF performed the experiments and data analysis, contributed to
the design and interpretation of the study and wrote the manuscript. KK
performed plasma H
2
S measurements and helped perform the experiments.
MB, EC and CA contributed to the study setup. WMZ and FI contributed to
the conceptual design of the study, to the interpretation of data, and to
manuscript writing and editing. WMZ and FI contributed equally to this
study. All authors have read and approved the final manuscript.
Competing interests
The authors declare that they have no competing interests.
Received: 22 September 2010 Revised: 15 December 2010
Accepted: 7 February 2011 Published: 7 February 2011
References
1. Arrich J, Holzer M, Herkner H, Mullner M: Hypothermia for neuroprotection
in adults after cardiopulmonary resuscitation. Cochrane Database Syst Rev
2009, CD004128.
2. Fukudome EY, Alam HB: Hypothermia in multisystem trauma. Crit Care
Med 2009, 37:S265-272.
3. Grigore AM, Murray CF, Ramakrishna H, Djaiani G: A core review of
temperature regimens and neuroprotection during cardiopulmonary
bypass: does rewarming rate matter? Anesth Analg 2009, 109:1741-1751.
4. Polderman KH: Mechanisms of action, physiological effects, and
complications of hypothermia. Crit Care Med 2009, 37:S186-202.
5. Mild therapeutic hypothermia to improve the neurologic outcome after
cardiac arrest. N Engl J Med 2002, 346:549-556.
6. Fries M, Stoppe C, Brücken D, Rossaint R, Kuhlen R: Influence of mild
therapeutic hypothermia on the inflammatory response after successful
resuscitation from cardiac arrest. J Crit Care 2009, 24:453-457.
7. Dorman DC, Moulin FJ, McManus BE, Mahle KC, James RA, Struve MF:
Cytochrome oxidase inhibition induced by acute hydrogen sulfide
inhalation: correlation with tissue sulfide concentrations in the rat brain,
liver, lung, and nasal epithelium. Toxicol Sci 2002, 65:18-25.
8. Struve MF, Brisbois JN, James RA, Marshall MW, Dorman DC:
Neurotoxicological effects associated with short-term exposure of
Sprague-Dawley rats to hydrogen sulfide. Neurotoxicology 2001,
22:375-385.
9. Volpato GP, Searles R, Yu B, Scherrer-Crosbie M, Bloch KD, Ichinose F,
Zapol WM: Inhaled hydrogen sulfide: a rapidly reversible inhibitor of
cardiac and metabolic function in the mouse. Anesthesiology 2008,
108:659-668.
10. Blackstone E, Roth MB: Suspended animation-like state protects mice
from lethal hypoxia. Shock 2007, 27:370-372.
11. Morrison ML, Blackwood JE, Lockett SL, Iwata A, Winn RK, Roth MB:
Surviving blood loss using hydrogen sulfide. J Trauma 2008, 65:183-188.
12. Minamishima S, Bougaki M, Sips PY, Yu JD, Minamishima YA, Elrod JW,
Lefer DJ, Bloch KD, Ichinose F: Hydrogen sulfide improves survival after
cardiac arrest and cardiopulmonary resuscitation via a nitric oxide
synthase 3-dependent mechanism in mice. Circulation 2009, 120:888-896.
13. Elrod JW, Calvert JW, Morrison J, Doeller JE, Kraus DW, Tao L, Jiao X,
Scalia R, Kiss L, Szabo C, Kimura H, Chow CW, Lefer DJ: Hydrogen sulfide
attenuates myocardial ischemia-reperfusion injury by preservation of
mitochondrial function. Proc Natl Acad Sci USA 2007, 104:15560-15565.
14. Sodha NR, Clements RT, Feng J, Liu Y, Bianchi C, Horvath EM, Szabo C,
Sellke FW: The effects of therapeutic sulfide on myocardial apoptosis in
response to ischemia-reperfusion injury. Eur J Cardiothorac Surg 2008,
33:906-913.
15. Haouzi P, Notet V, Chenuel B, Chalon B, Sponne I, Ogier V, Bihain B: H2S
induced hypometabolism in mice is missing in sedated sheep. Respir
Physiol
Neurobiol 2008, 160:109-115.
16. Li J, Zhang G, Cai S, Redington AN: Effect of inhaled hydrogen sulfide on
metabolic responses in anesthetized, paralyzed, and mechanically
ventilated piglets. Pediatr Crit Care Med 2008, 9:110-112.
17. Beauchamp RO Jr, Bus JS, Popp JA, Boreiko CJ, Andjelkovich DA: A critical
review of the literature on hydrogen sulfide toxicity. Crit Rev Toxicol 1984,
13:25-97.
18. Reiffenstein RJ, Hulbert WC, Roth SH: Toxicology of hydrogen sulfide.
Annu Rev Pharmacol Toxicol 1992, 32:109-134.
19. Siegel LM: A Direct Microdetermination for Sulfide. Anal Biochem 1965,
11:126-132.
20. Dupont WD, Plummer WD Jr: Power and sample size calculations for
studies involving linear regression. Control Clin Trials 1998, 19:589-601.
21. Simon F, Giudici R, Duy CN, Schelzig H, Oter S, Groger M, Wachter U,
Vogt J, Speit G, Szabo C, Radermacher P, Calzia E: Hemodynamic and
metabolic effects of hydrogen sulfide during porcine ischemia/
reperfusion injury. Shock 2008, 30:359-364.
22. Blackstone E, Morrison M, Roth MB: H2S induces a suspended animation-
like state in mice. Science 2005, 308:518.
23. Gautier H, Bonora M: Ventilatory and metabolic responses to cold and
CO-induced hypoxia in awake rats. Respir Physiol 1994, 97:79-91.
24. Matsuoka M, Igisu H, Tanaka I, Hori H, Koga M: Effects of hypo- and
hyperglycemia on brain energy metabolites in mice exposed to carbon
monoxide. Toxicol Lett 1994, 73:135-143.
25. Singer D: Metabolic adaptation to hypoxia: cost and benefit of being
small. Respir Physiol Neurobiol 2004, 141:215-228.
26. Forster HV, Bisgard GE, Klein JP: Effect of peripheral chemoreceptor
denervation on acclimatization of goats during hypoxia. J Appl Physiol
1981, 50:392-398.
27. Frappell P, Lanthier C, Baudinette RV, Mortola JP: Metabolism and
ventilation in acute hypoxia: a comparative analysis in small mammalian
species. Am J Physiol 1992, 262:R1040-1046.
28. Korducki MJ, Forster HV, Lowry TF, Forster MM: Effect of hypoxia on
metabolic rate in awake ponies. J Appl Physiol 1994, 76:2380-2385.
29. Schmidt-Nielsen K: Scaling: Why is Animal Size so Important? Cambridge, UK:
Cambridge University Press; 1984.
30. Baumgart K, Wagner F, Groger M, Weber S, Barth E, Vogt JA, Wachter U,
Huber-Lang M, Knoferl MW, Albuszies G, Georgieff M, Asfar P, Szabó C,
Calzia
E, Radermacher P, Simkova V: Cardiac and metabolic effects of
hypothermia and inhaled hydrogen sulfide in anesthetized and
ventilated mice. Crit Care Med 2010, 38:588-595.
31. Bhambhani Y, Burnham R, Snydmiller G, MacLean I: Effects of 10-ppm
hydrogen sulfide inhalation in exercising men and women.
Cardiovascular, metabolic, and biochemical responses. J Occup Environ
Med 1997, 39:122-129.
32. Olson KR, Dombkowski RA, Russell MJ, Doellman MM, Head SK,
Whitfield NL, Madden JA: Hydrogen sulfide as an oxygen sensor/
transducer in vertebrate hypoxic vasoconstriction and hypoxic
vasodilation. J Exp Biol 2006, 209:4011-4023.
33. Olson KR, Whitfield NL, Bearden SE, St Leger J, Nilson E, Gao Y, Madden JA:
Hypoxic pulmonary vasodilation: a paradigm shift with a hydrogen sulfide
mechanism. Am J Physiol Regul Integr Comp Physiol 2010, 298:R51-60.
34. Koenitzer JR, Isbell TS, Patel HD, Benavides GA, Dickinson DA, Patel RP,
Darley-Usmar VM, Lancaster JR Jr, Doeller JE, Kraus DW: Hydrogen sulfide
mediates vasoactivity in an O2-dependent manner. Am J Physiol Heart
Circ Physiol 2007, 292:H1953-1960.
35. OSHA/EPA Occupational Chemical Database. [ />dep/chemicaldata/].
36. WHO International Programme on Chemical Safety. [ />ipcs/en/].
37. Guidotti TL: Hydrogen Sulfide: Advances in Understanding Human
Toxicity. Int J Toxicol 2010.
38. Kajimura M, Fukuda R, Bateman RM, Yamamoto T, Suematsu M:
Interactions of multiple gas-transducing systems: hallmarks and
Derwall et al. Critical Care 2011, 15:R51
/>Page 9 of 10
uncertainties of CO, NO, and H2S gas biology. Antioxid Redox Signal 2010,
13:157-192.
39. Whitfield NL, Kreimier EL, Verdial FC, Skovgaard N, Olson KR: Reappraisal of
H2S/sulfide concentration in vertebrate blood and its potential
significance in ischemic preconditioning and vascular signaling. Am J
Physiol Regul Integr Comp Physiol 2008, 294:R1930-1937.
40. Henderson PW, Weinstein AL, Sung J, Singh SP, Nagineni V, Spector JA:
Hydrogen sulfide attenuates ischemia-reperfusion injury in in vitro and
in vivo models of intestine free tissue transfer. Plast Reconstr Surg 2010,
125:1670-1678.
41. Snider M, Zapol W: Assessment of pulmonary oxygenation during
venoarterial bypass with aortic root return. In Artificial Lungs and Acute
Respiratory Failure: Theory and Practice. Edited by: Zapol W, Qvist J.
Washington, D.C.: Hemisphere Publishing Corporation; 1976:257-273.
doi:10.1186/cc10016
Cite this article as: Derwall et al.: Administration of hydrogen sulfide via
extracorporeal membrane lung ventilation in sheep with partial
cardiopulmonary bypass perfusion: a proof of concept study on
metabolic and vasomotor effects. Critical Care 2011 15:R51.
Submit your next manuscript to BioMed Central
and take full advantage of:
• Convenient online submission
• Thorough peer review
• No space constraints or color figure charges
• Immediate publication on acceptance
• Inclusion in PubMed, CAS, Scopus and Google Scholar
• Research which is freely available for redistribution
Submit your manuscript at
www.biomedcentral.com/submit
Derwall et al. Critical Care 2011, 15:R51
/>Page 10 of 10