Báo cáo y học: "Influence of genetic variability at the surfactant proteins A and D in community-acquired pneumonia: a prospective, observational, genetic study" pot
Bạn đang xem bản rút gọn của tài liệu. Xem và tải ngay bản đầy đủ của tài liệu tại đây (1.08 MB, 12 trang )
RESEARCH Open Access
Influence of genetic variability at the surfactant
proteins A and D i n community-acquired pneumonia:
a prospective, observational, genetic study
M Isabel García-Laorden
1
, Felipe Rodríguez de Castro
2,3
, Jordi Solé-Violán
4
, Olga Rajas
5
, José Blanquer
6
,
Luis Borderías
7
, Javier Aspa
5
, M Luisa Briones
8
, Pedro Saavedra
9
, J Alberto Marcos-Ramos
10
,
Nereida González-Quevedo
1
, Ithaisa Sologuren
1
, Estefanía Herrera-Ramos
1
, José M Ferrer
4
, Jordi Rello
11
,
Carlos Rodríguez-Gallego
1,3*
Abstract
Introduction: Genetic variability of the pulmonary surfactant proteins A and D may affect clearance of microorganisms
and the extent of the inflammatory response. The genes of these collectins (SFTPA1, SFTPA2 and SFTPD) are located in a
cluster at 10q21-24. The objective of this study was to evaluate the existence of linkage disequilibrium (LD) among
these genes, and the association of variability at these genes with susceptibility and outcome of community-acquired
pneumonia (CAP). We also studied the effect of genetic variability on SP-D serum levels.
Methods: Seven non-synonymous polymorphisms of SFTPA1, SFTPA2 and SFTPD were analyzed. For susceptibility,
682 CAP patients and 769 controls were studied in a case-control study. Severity and outcome were evaluated in a
prospective study. Haplotypes were inferred and LD was characterized. SP-D serum levels were measured in
healthy controls.
Results: The SFTPD aa11-C all ele was significantly associated with lower SP-D serum levels, in a dose-dependent manner.
We observed the exi stence of LD among the st udied genes. Haplo types SFTPA1 6A
2
(P = 0.0009, odds ration (OR) = 0.78),
SFTPA2 1A
0
(P = 0.002, OR = 0.79), SFTPA1-SFTPA2 6A
2
-1A
0
(P = 0.0005, OR = 0.77), and SFTPD-SFTPA1-SFTPA2 C-6A
2
-1A
0
(P =
0.00001, OR = 0.62) were underrepresented in patients, whereas haplotypes SFTPA2 1A
10
(P=0.00007, OR = 6.58) and
SFTPA1-SFTPA2 6A
3
-1A (P = 0 .0007, OR = 3.92) were overrepresented. Similar results were observed in CAP due to
pneumococcus, though no significant differences were now observed after Bonferroni corrections. 1A
10
and 6A-1A were
associated with higher 28-day and 90-day mortality, and with multi-organ dysfunction syndrome (MODS) and acute
respiratory distress syndrome (ARDS) respectively. SFTPD aa11-C allele was associated with development of MODS and A RDS.
Conclusions: Our study indicates that missense single nucleotide polymorphisms and haplotypes of SFTPA1,
SFTPA2 and SFTPD are associated with susceptibility to CAP, and that several haplotypes also influence severity and
outcome of CAP.
Introduction
Community-acquired pneumonia (CAP) is t he most
common infectious disease requiring hospitalization in
developed countries. Several microorganisms may be
causative agents of CAP, and Streptococcus pneumoniae
is the most common cause [1]. Inherited genetic
variants of components of the human immune system
influence the susceptibility to and the severity of infec-
tious diseases. In humans, primary immunodeficiencies
(PID) affecting opsonizat ion of bacteria and NF-B-
mediated activation have been shown to predispose to
invasive infections by respirat ory bacteria, particularly S.
pneumoniae [2]. Conventional PID are mendelian disor-
ders, but genetic variants at other genes involved in
opsonophagocytosis, with a lowe r penetrance, may also
* Correspondence:
1
Department of Immunology, Hospital Universitario de Gran Canaria Dr.
Negrín, Barranco de la Ballena s/n, Las Palmas de Gran Canaria, 35010, Spain
Full list of author information is available at the end of the article
García-Laorden et al. Critical Care 2011, 15:R57
/>© 2011 G arcía-Laorden et al.; licensee BioMed Central Ltd. This is an open access article distributed under the terms of the Creative
Commons Attribution License (http://creativeco mmons.org/licenses/by/2.0), which permits unrestricted use, distribution, and
reproduction in any medium, provided the original work is properly cited.
influence susceptibility and severity of these infectious
diseases with a complex pattern of inheritance [3].
In the lung, un der normal conditions, microorganisms
at first encounter components of the innate immune
response, particularly alveolar macrophages, dendritic
cells and the lung collectins, the surfactant prote in (SP)-
A1, -A2 and -D. SP-A1, -A2 and -D belong to the col-
lectin subgroup of the C-type lectin superfamily, and
contain both collagen-like and carbohydrate-binding
recognition domains (CRDs) [4]. Upon binding to
pathogen-associated molecular patterns (PAMPs), SP-A
and SP-D enhance the opsonophagocytosis of common
respiratory pathogens by macrophages [5,6]. Mice ren-
dered SP-A or SP-D deficient exhibit increased suscept-
ibility to several bacteria and viruses after intratracheal
challenge [7-9]. SP-A1, -A2 and -D also play a pivotal
role in the regul ation of inflammatory responses
[4,10,11] and clearance of apoptotic cells [4,12,13]. In
mice, SP-A and SP-D have been shown to be non-
redundant in the immune defense in vivo [9].
The human SP-A locus consists of two similar genes,
SFTPA1 and SFTPA2, located on chromosome 10q21-
24, within a cluster that includes the SP-D gene
(SFTPD) [11]. The nucleotide sequences of human
SFTPA1 and SFTPA2 differ little (96.0 to 99.6%) [14].
Single nucleotide polymorphisms (SNP) at the SFTPA1
codons 19, 50, 62, 133 and 219, and at the SFTPA2
codons 9, 91, 140 and 223 have been used to define
the SP-A haplotypes, which are conventionally denoted
as 6A
n
for the SFTPA1 gene and 1A
n
for the SFTPA2
gene (see Table E1 in Additional File 1) [15]. Variabil-
ity at the SFTPD gene has been also reported. Particu-
larly, the presence of the variant amino acid (aa)-
11 (M11T) has been shown to lead to low SP-D
levels [16].
In the present study, we assessed the potential associa-
tion of missense polymorphisms of the SFTPA1,
SFTPA2 and SFTPD genesaswellastheresultinghap-
lotypes, with the susceptibility to and the severity and
outcome of CAP in adults. In addition, we evaluated the
existence of linkage disequilibrium (LD) among these
genes, and the effect of genetic variability on SP-D
serum levels.
Materials and methods
Patients and controls
We studied 682 patients and 769 controls, all of them
Caucasoid Spanish adult individuals from five hospitals
in Spain. Foreigners and individuals with ancestors
other than Spanish were previously excluded in the
selection process. The diagnosis of CAP was assumed in
the presence of acute onset of signs and symptoms sug-
gesting lower respiratory tract infection and radio-
graphic evidence of a new pulmonary infil trate that had
no other known cause. A detailed description of the
exclusion criteria a nd clinical definitions are shown in
Methods in Additional File 1 [17-19]. The control group
was composed of healthy unrelated blood d onors from
the same hospitals as patients.
For susceptibility, a case-control study was performed.
Severity and outcome were evaluated in a prospective
study of CAP patients. Demographic and clinical charac-
teristics of CAP patients included in the study ar e
shown in Table E2 in Additional File 1.
Measurement of SP-D serum levels
In order to analyze the effect of the SFTPD aa11 on SP-
D levels in our population, protein levels were measured
in serum samples from individuals in the control group
by means of a Surfactant Protein D ELISA kit (Antibo-
dyshop
®
, Gentofte, Denmark).
Genotyping
Four haplotypes of SP-A1 (6A, 6A
2
,6A
3
and 6A
4
)and
six of SP-A2 (1A, 1A
0
,1A
1
,1A
2
,1A
3
and 1A
5
) are found
frequently (>1%) in the general population [15]. On the
basis of the differences in non-synonymous SNPs
(SFTPA1-aa19, -aa50, -aa219, SFTPA2-aa9, -aa91,
-aa223) the most frequent conventional haplotypes of
these genes, except 1A and 1A
5
, c an be unambiguously
identified (see Table E1 in Additiona l File 1). However,
this method does not allow for the differentiation of
some of these haplotypes from those rare haplotypes
(frequency equal or lower than 1% ) identified w ith the
SNPs indicated in Table E1 in Additional File 1. For
comparative purposes, in our study each haplotype was
denoted by the name of the most frequent haplotype for
a given combination of non-synonymous SNPs. Geno-
mic DNA was isolated from whole blood according to
standard phenol-chloroform procedure or with the
Magnapure DNA Isolati on Kit (Roche Molecular Diag-
nostics, Pleasanton, CA, USA). Genotyping of poly-
morphisms in SFTPA1 (aa19, aa50, aa219), SFTPA2
(aa9, aa91, aa223) and SFTP D (aa11) genes was carried
out using minor modifi cations of previously reported
procedures [15,20]. The accurac y of genotyping was
confirmed by direct sequencing in an ABI Prism 310
(Applied Biosystems, Foster City, CA, USA) sequencer.
Haplotypes for each individual were inferred using
PHASE statistica l software (version 2.1) [21]. The haplo-
type of SFTPA1, SFTPA2 or the haplotype encompassing
SFTPA1, SFTPA2 and SFTPD was ambiguous or could not
be assigned in 12 individuals, who were excluded from the
study. The order used for the haplotypes nomenclature is
SFTPD-SFTPA1-SFTPA2. Linkage disequilibrium (LD)
was measured by means of Arlequin (version 3.11) [22]
and Haploview [23] softwares in the control group. In
addition, pairwise LD between haplotypes of SFTPA1 and
García-Laorden et al. Critical Care 2011, 15:R57
/>Page 2 of 12
SFTPA2 as well as with the SFTPD SNP was characterized
using Arlequin 3.11. The existence of LD was considered
if D’ >0.4.
Informed consent was obtained from the patients or
their relatives. The protocol was approved by the local
ethics committee of the five hospitals. All steps were
performed in complete accordance to the Helsinki
declaration.
Statistical analysis
Bivariate and multivariate statistical analyses were per-
formed using SPSS (version 15.0) (SPSS, Inc, Chicago,
Ill, USA) and R package [24]. A detailed description of
the statistical methods is shown in Methods in Addi-
tional File 1.
Results
Susceptibility to CAP related to SFTPA1, SFTPA2 and
SFTPD gene variants
Seven non-synonymous SNPs were genotyped across the
region containing the SFTPD, SFTPA1 and SFTPA2
genes (Table 1). None of the SNPs show ed a significant
deviation from Hardy-Weinberg equilibrium in controls.
Several major alleles were o verrepresented in controls
compared with patients, b ut only SFTPA1 aa50-G,
SFTPA2 aa9-A and aa91-G remained significant after
Bonferroni correction for multiple comparisons.
A dominant effect of SFTPA2 aa9-A, and a recessive
effect of SFTPA1 aa50-G and aa219-C as well as
SFTPA2 aa223-C were associated w ith a lower risk of
CAP (see Table 1).
Table 1 Comparison of SNPs from SFTPD, SFTPA1 and SFTPA2 between patients with CAP and controls
Alleles comparison Genotypes comparison
†
Controls (N = 769) CAP (N = 682) P
*
OR (95% CI) P
*
OR (95% CI)
SFTPD aa11 rs721917 TvsC Dominant
T/T 269 (35.0) 272 (39.9) 0.681 0.95 (0.73 to 1.1.23)
T/C 361 (46.9) 281 (41.2) 0.266 1.09 (0.94to 1.27) Recessive
C/C 139 (18.1) 129 (18.9) 0.054 1.23 (1.00 to 1.53)
SFTPA1 aa19 rs1059047 TvsC Dominant
T/T 680 (88.4) 582 (85.3) 0.193
‡
0.22 (0.00 to 2.24)
T/C 88 (11.4) 96 (14.1) 0.056 0.75 (0.56 to 1.02) Recessive
C/C 1 (0.001) 4 (0.006) 0.081 0.76 (0.56 to 1.04)
SFTPA1 aa50 rs1136450 GvsC Dominant
G/G 320 (41.6) 232 (34.0) 0.060 0.77 (0.59 to 1.01)
G/C 330 (42.9) 319 (46.8) 0.002 0.79 (0.68 to 0.92) Recessive
C/C 119 (15.5) 131 (19.2) 0.003 0.72 (0.58 to 0.90)
SFTPA1 aa219 rs4253527 CvsT Dominant
C/C 620 (80.6) 508 (74.5) 0.710 1.24 (0.39 to 3.94)
C/T 142 (18.5) 169 (24.8) 0.012 0.75 (0.59 to 0.95) Recessive
T/T 7 (0.9) 5 (0.7) 0.005 0.70 (0.55 to 0.90)
SFTPA2 aa9 rs1059046 AvsC Dominant
A/A 323 (42.0) 245 (35.9) 0.010 0.68 (0.51 to 0.91)
A/C 349 (45.4) 318 (46.6) 0.003 0.79 (0.68 to 0.92) Recessive
C/C 97 (12.6) 119 (17.4) 0.018 0.77 (0.63 to 0.96)
SFTPA2 aa91 rs17886395 GvsC Dominant
G/G 623 (81.0) 501 (73.5) 0.110 0.58 (0.29 to 1.14)
G/C 133 (17.3) 158 (23.2) 0.0002 0.66 (0.52 to 0.82) Recessive
C/C 13 (1.7) 23 (3.4) 0.001 0.65 (0.51 to 0.83)
SFTPA2 aa223 rs1965708 CvsA Dominant
C/C 503 (65.4) 419 (61.4) 0.151 0.66 (0.38 to 1.17)
C/A 244 (31.7) 234 (34.3) 0.071 0.85 (0.70 to 1.02) Recessive
A/A 22 (2.9) 29 (4.3) 0.117 0.84 (0.68 to 1.04)
Frequency values are the number of individuals (%). SNPs: Single nucleotide polymorphisms; CAP: Community-acquired pneumonia.
*Uncorrected P-value for the bivariate comparison of alleles.
†
Uncorrected P-value for the bivariate comparison of genopytes. For the dominant allele effect, individuals homozygous for the more frequent allele or those
heterozygous for both alleles were defined as 1, and individuals homozygous for the minor allele were defined as 0. For the recessive allele effect, individuals
homozygous for the more frequent allele were defined as 1, with all others defined as 0.
‡
P-value by Fischer exact test.
García-Laorden et al. Critical Care 2011, 15:R57
/>Page 3 of 12
When haplotypes were inferred, seven different haplo-
types were found for SFTPA1 and eight for SFTPA2 (see
Table 2). All haplotypes except 6A
5
,6A
15
,1A
10
and
1A
13
had frequencies higher than 1% in our population.
The most frequent haplotype for SFTPA1 and SFTPA2
were respectively TGC and AGC, which correspond
mainly with the 6A
2
and 1A
0
haplotypes respectively.
The frequencies of both haplotypes were significantly
lower in patients compared to controls (P =0.0009,OR
= 0.78; 95% confidence interval (CI) 0.67 to 0.91, for
SFTPA1 6A
2
. P = 0.002, OR = 0.79; 95% CI 0.68 to 0.92,
for SFTPA2 1A
0
), even when Bonferroni correction was
applied. Several haplotypes were overrepresented in
patients compared with controls, but only 1A
10
(P =
0.00007, OR = 6.58; 95% CI 2.24 to 26.22) remained sig-
nificant after Bonferroni corre ction. For the observed
odd-ratios, the power of the tests with a significance
level of 1% were 84.16%, 79.09% and 94.04% for the
haplotypes 6A
2
, 1A
0
and 1A
10
respectively. In addition,
dominant and recessive models showed a significant
Table 2 Comparison of haplotypes of SFTPA1 and SFTPA2 between patients with CAP and controls
Haplotype * Controls
N = 1,538
CAP
N = 1,364
P
†
OR (95% CI)
Haplotype effect P
‡
OR (95% CI)
SFTPA1
6A (CCC) 75 (4.9) 90 (6.6) 0.047 1.38 (0.99-1.92) Dominant 0.058 1.37 (0.99-1.91)
Recessive 0.347
§
3.39 (0.27-178.36)
6A
2
(TGC) 934 (60.7) 745 (54.0) 0.0009 0.78 (0.67-0.91) Dominant 0.172 0.83 (0.64-1.08)
Recessive 0.0002 0.66 (0.53-0.82)
6A
3
(TCC) 362 (23.5) 343 (25.1) n.s. Dominant 0.004 1.37 ( (1.11-1.69)
Recessive 0.146 1.35 (0.90-2.18)
6A
4
(TCT) 128 (8.3) 141 (10.3) 0.062 1.27 (0.98-1.65) Dominant 0.068 1.28 (0.98-1.68)
Recessive 0.726
§
1.66 (0.32-10.76)
6A
5
(CCT) 4 (0.3) 7 (0.5) n.s. Dominant 0.107 2.56 (0.78-8.34)
Recessive n.a.
6A
12
(TGT) 26 (1.7) 29 (2.1) n.s. Dominant 0.315 1.32 (0.77-2.28)
Recessive n.a.
6A
15
(CGC) 9 (0.6) 9 (0.7) n.s. Dominant 0.996 1.00 (0.39-2.61)
Recessive n.a.
SFTPA2
1A (CCC) 134 (8.7) 147 (10.8) n.s. Dominant 0.050 1.31 (1.00-1.71)
Recessive 0.80 1.13 (0.45-2.86)
1A
0
(AGC) 911 (59.2) 729 (53.4) 0.002 0.79 (0.68-0.92) Dominant 0.004 0.68 (0.52-0.88)
Recessive 0.025 0.78 (0.62-0.97)
1A
1
(CGA) 219 (14.2) 222 (16.3) n.s. Dominant 0.544 1.14 (0.91-1.44)
Recessive 0.076 1.91 (0.925-3.93)
1A
2
(CGC) 188 (12.2) 164 (12.0) n.s. Dominant 0.806 0.97 (0.76-1.24)
Recessive 0.863 1.06 (0.53-2.12)
1A
3
(AGA) 61 (4.0) 46 (3.4) n.s. Dominant 0.557 0.89 (0.59-1.33)
Recessive n.a.
1A
7
(ACC) 21 (1.4) 32 (2.3) 0.049 1.74 (0.96-3.18) Dominant 0.031 1.88 (1.05-3.36)
Recessive 1.00
§
0.56 (0.01-10.84)
1A
10
(CCA) 4 (0.3) 23 (1.7) 0.00007 6.58 (2.24-26.22) Dominant 0.00006 6.68 (2.30-19.40)
Recessive n.a.
1A
13
(ACA) 0 1 (0.1) n.s. Dominant n.a.
Recessive n.a.
Frequency values are the number of chromosomes (%). CAP, Community-acquired pneumonia; n.s., non-significant; n.a., not assessable.
*Haplotypes for SFTPA1 and SFTPA2, resulting from the different combinations of the three SNPs (Single nucleotide polymorphisms) studied at each gene, are
denoted using the conventional nomenclature [15].
†
Uncorrected P-value for the bivariate comparison of haplotypes.
‡
Uncorrected P-value for the bivariate comparison of genopytes. For the dominant haplotype effect, individuals homozygous or heterozygous for the allele of
interest were defined as 1, and individuals without the haplotype were defined as 0. For the recessive haplotype effect, individuals homozygous for the
haplotype of interest were defined as 1, with all others defined as 0.
§
P-value by Fischer exact test.
García-Laorden et al. Critical Care 2011, 15:R57
/>Page 4 of 12
dominant effect on CAP susceptibility for haplotypes
6A
3
, 1A
0
, 1A
7
and 1A
10
and a recessive effect for haplo-
type 6A
2
(see Table 2).
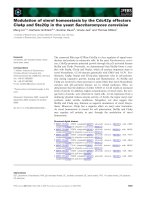
Linkage disequilibrium of SFTPA1, SFTPA2 and SFTPD
genes
Pairwise LD (D’) measured by means of Arlequin con-
firmed the existence of LD among several SNPs at
SFTPA1 and SFTPA2, whereas SFTPD aa11 was only
observed in LD with SFTPA1 aa19 (see Figure 1).
A similar pattern of LD was observed when D’ was mea-
sured by means of the Haploview software (data not
shown). SFTPA1 and SFTPA2 were previously found to
be in LD [25,26]. The value of LD measured as r
2
was
very low for every pair of SNPs (data not shown), and
none of the studied SNPs could be used as haplotype-
tagging SNP to infer the observed haplotypes.
When pairwise LD was measured among haplotypes
instead among SNPs, SFTPA1 was found to be in LD
with SFTPD aa11,butonlyamarginalLDwasfound
between SFTPA2 1A and SFTPD aa11 (see Table E3 in
Additional File 1).
Susceptibility to CAP related to haplotypes encompassing
SFTPA1, SFTPA2 and SFTPD
When haplotypes encompassing both SFTPA genes were
studied, we observed 39 of the 64 expected haplotypes,
and only 14 haplotypes had frequencies higher than 1%
(data not shown). The most common SFTPA1-SFTPA2
haplotype, 6A
2
-1A
0
, was underrepresented in patients
(P = 0.0005, OR = 0.7 7; 95% CI 0.66 to 0.90), whereas
6A
3
-1A was overrepresented (P = 0.0007, OR = 3.92;
95% CI 1.63 to 10.80) (see Table 3). Both differenc es
remained significant after Bonferroni correction. For the
observed odd-ratios, the powers of the tests with a sig-
nificance level of 1% were 87.76% and 84.04% for the
haplotypes 6A
2
-1A
0
and 6A
3
-1A respectively. On the
other hand, dominant and recessive logistic regression
models showed a significant dominant effect on CAP
susceptibility for haplotypes 6A
3
-1A an d 6A-1A
1
and a
recessive effect for haplotyp e 6A
2
-1A
0
(see Table 3). We
also intended to analyze whether phased variants
encompassing the three genes were involved in suscept-
ibility to CAP. Only 6 8 of the 128 expected haplotypes
were observed, and 16 of them had a frequency over
1%. Chromosomes containing C-6A
2
-1A
0
were decreased
in patients when compared with controls (P = 0.00001,
OR = 0.62; 95% CI 0.50 to 0.77), a difference that
remained significant after Bonferroni correction. C-6A
2
-
1A
0
was also significantly associated with protection
against CAP in a dominant model (see Table 3).
A similar pattern of haplotype distribution was
observed when individual as well as two- and three-gene
based haplotypes were compared between pneumococcal
CAP patients and healthy controls (see Table E4 in
Additional File 1), though no significant differences
were now observed after Bonferroni corrections.
Outcome and severity of CAP patients related to genetic
variants at SFTPA1, SFTPA2 and SFTPD genes
When fatal outcome was analyzed, patients who died
within the first 28 days showed a higher frequency of
haplotypes 6A
12
,1A
10
and 6A-1A, and a lower frequency
of the major SFTPA1aa19-T and aa219-C alleles and of
haplotypes 6A
3
and 6A
3
-1A
1
(see Table 4). Similar resul ts
were observed when 90-day mortality was analyzed (see
Table 4). For the observed odd-ratios, the power of the
tests with a significance level of 5% was 82.64% when the
protective effect of 6A
3
-1A
1
on 28-day mortality was eval-
uated, and 81.45% and 80.79% con cerning the effect of
6A
3
and 6A
3
-1A
1
on 90-day mortality respectively.
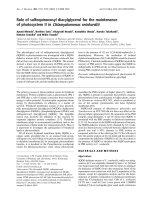
Kaplan-Meie r analysis (Figure 2) and log-rank test
(Table 4) also showed significantly different survival for
the above mentioned alleles and haplotypes. Cox Regres-
sion for 28-day survival, adjusted for age, gender, hospital
of origin and co-morbidities, was significant for haplotypes
6A
12
and 6A-1A, and it remained significant for haplotypes
6A
3
and 6A-1A when 90-day survival analysis was per-
formed (see Table 4). We also analyzed Cox Regression
adjusted for hospital of origin, PSI and pathogen causative
of the pneumonia, and we found similar results: for 28-day
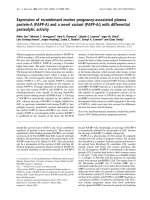
Figure 1 Genomic organization, location of SNPs, and linkage
disequilibrium (D’) map for SFTPD, SFTPA1 and SFTPA2 genes.
SNPs: Single-nucleotide polymorphisms. All the D’ values higher
than 0.3 were statistically significant (P < 0.05). Linkage
disequilibrium was measured in the control group.
García-Laorden et al. Critical Care 2011, 15:R57
/>Page 5 of 12
survival it remained signi ficant for haplotype 6A-1A (P =
0.029, OR = 2.45; 95% CI 1.10 to 5.46), although for 6A
12
haplotype it was not significant (P = 0.072); for 90-day sur-
vival it was significant for both 6A
3
(P = 0.038, OR = 0.52;
95% CI 0.28 to 0.96) and 6A-1A (P = 0.0 45, OR = 2.12;
95% CI 1.0 2 to 4.44) haploty pes. No effect of the SFTPD
aa11 SNP was observed. D ue to the high number of
observed haplotypes, and because of the limited sample
size in the patient groups when they were stratified on the
basis of severity and outcome, the haplotypes including
SFTPA1, A2 and D were not studied.
The relevance of these genetic variants in the severity of
CAP was also evalua ted by analyzing predisposition to
acute respiratory distress syndrome (ARDS) and to multi-
organ dysfunction syndrome (MODS) (see Tables 5 and
6). The SFTPD aa11-C allele was s ignificantly overrepre-
sented in patients with MODS or ARDS. Haplotypes 6A
and 6A-1A, were also ass ociated with the development of
ARDS, and SFTPA2 1A and 1A
10
were associated with the
development of MODS. For the observed odd-ratios, the
power of the association of 1A with predisposition to
MODS was 89.29%. However, the number of individuals
included in the analysis of outcome was relatively small
and the power of the tests with a significance level of 1%
was lower than 80%. These associations remained signifi-
cant in multivariate analysis adjusted for age, gender, hos-
pital of origin and co-morbidities, as well as for hospital of
origin, PSI and causative microorganism (see Tables 5 and
6). By contrast, 6A
3
-1A
1
was associated with protection
against MODS, although this difference was not significant
in the multivariate analysis.
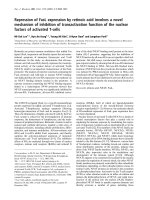
Association of genetic variants at SFTPD with serum
levels of SP-D
In order to study whether variants at the pulmonary col-
lectins were associated with differences of serum levels
of SP-D, this protein was measured in serum from
healthy controls with known genotypes. The SFTPD
aa11-C SNP associated with lower SP-D serum levels
(905. 10 ± 68.38 ng/ml for T/T genotype, 711.04 ± 52.02
ng/ml for T/C, and 577.91 ± 96.14 ng/ml for C/C;
ANOVA P = 0.017) (see Figure 3).
Table 3 Comparison of relevant haplotypes encompassing SFTPD, SFTPA1 and SFTPA2 between CAP patients and
controls
Haplotype
*
Controls CAP P
†
OR (95% CI)
Haplotype effect P
‡
OR (95% CI)
SFTPA1-SFTPA2
N = 1538 N = 1,364
6A
2
-1A
0
(TGCAGC) 802 (52.1) 623 (45.7) 0.0005 0.77 (0.66-0.90) Dominant 0.028 0.77 (0.61-0.97)
Recessive 0.0005 0.65 (0.51-0.83)
6A
3
-1A (TCCCCC) 7 (0.5) 24 (1.8) 0.0007 3.92 (1.63-10.80) Dominant 0.001 3.97 (1.70-9.27)
Recessive n.a.
6A-1A
1
(CCCCGA) 2 (0.1) 9 (0.7) 0.020 5.10 (1.05-48.57) Dominant 0.020 5.13 (1.10-23.82)
Recessive n.a.
SFTPD-SFTPA1-SFTPA2
N = 1,538 N = 1,364
C-6A
2
-1A
0
(CTGCAGC) 261 (17.0) 153 (11.2) 0.00001 0.62 (0.50-0.77) Dominant 0.0001 0.63 (0.49-0.80)
Recessive 0.003 0.38 (0.19-0.73)
C-6A
3
-1A (CTCCCCC ) 3 (0.2) 14 (1.0) 0.003 5.31 (1.48-28.84) Dominant 0.003 5.35 (1.53-18.70)
Recessive n.a.
C-6A
4
-1A
2
(CTCTTGC) 15 (1.0) 31 (2.3) 0.005 2.36 (1.23-4.73) Dominant 0.003 2.57 (1.35-4.87)
Recessive n.a.
T-6A
3
-1A
1
(TTCCCGA) 54 (3.5) 74 (5.4) 0.012 1.58 (1.09-2.30) Dominant 0.010 1.62 (1.12-2.34)
Recessive 1.00 1.13
§
(0.01-88.64)
T-6A
3
-1A
2
(TTCCTGC) 52 (3.4) 28 (2.1) 0.029 0.60 (0.36-0.97) Dominant 0.019 0.57 (0.35-0.92)
Recessive n.a.
Frequency values are the number of chromosomes (%). CAP, Community-acquired pneumonia; n.a., not assessable.
*Haplotypes for SFTPA1 and SFTPA2, resulting from the different combinations of the three SNPs studied at each gene, are denoted using the conventional
nomenclature [15].
†
Uncorrected P-value for the bivariate comparison of haplotypes.
‡
Uncorrected P-value for the bivariate comparison of genotypes. For the dominant haplotype effect, individuals homozygous or heterozygous for the haplotype
of interest were defined as 1, and individuals without the haplotype were defined as 0. For the recessive haplotype effect, individuals homozygous for the
haplotype of interest were defined as 1, with all others defined as 0.
§
P-value by Fischer exact test.
García-Laorden et al. Critical Care 2011, 15:R57
/>Page 6 of 12
Discussion
This study is unique in reporting a genetic association
between non-synonymous SNPs at SFTPD, SFTPA1 and
SFTPA2,aswellasofhaplotypesencompassingthese
genes, with the susceptibility, severity and outcome
of CAP.
The major alleles of SFTPA1 aa50-G, aa219-C as well as
SFTPA2 aa9-A and aa91-G or genotypes carrying these
alleles were associated w ith protection against CAP. The
frequencies of t he different SNPs and haplotypes of
SFTPA1, SFTPA2 and SFTPD observed in our study were
similar to those previously reported in European popula-
tions [25]. SFTPA1 and SFTPA2 were reported to be in
strong LD [26,27], and several haplotypes of these loci
tend to segregate together, being 6A
2
-1A
0
the maj or hap-
lotype [27]. A prote ctive role against CAP was associated
with 6A
2
, 1A
0
and 6A
2
-1A
0
in our survey but only the rare
1A
10
and 6A
3
-1A haplotypes were signi ficantly associated
with susceptibilit y to CAP. Similar results were observed
in susceptibility to pneumococcal CAP. Several SNPs and
Table 4 Outcome of CAP patients related to haplotypes of SFTPA1 and SFTPA2
28 days 90 days
Mortality Survival Mortality Survival
Variant
*
Yes No P
†
OR (95% CI)
P
‡
LR c
2
P
§
HR (95% CI)
Yes No P
†
OR (95% CI)
P
‡
LR c
2
P
§
HR (95% CI)
SNPs
SFTPA1
aa19-T
allele
58
(85.3)
1202
(92.7)
0.024 0.45
(0.22 to 1.03)
0.021
5.31
0.071 0.52
(0.25 to 1.06)
81
(88.0)
1179
(92.7)
0.105 0.58
(0.29 to 1.25)
0.091
2.85
0.256 0.68
(0.35 to 1.36)
SFTPA1
aa219-C
allele
52
(76.5)
1133
(87.4)
0.009 0.47
(0.26 to 0.90)
0.009
6.75
0.085 0.57
(0.30 to 1.08)
72
(78.3)
1113
(87.5)
0.011 0.51
(0.30 to 0.92)
0.011
6.49
0.230 0.70
(0.39 to 1.25)
Haplotypes
SFTPA1
6A
3
10
(14.7)
333
(25.7)
0.042 0.50
(0.22 to 1.00)
0.043
4.10
0.058 0.48
(0.23-1.02)
14
(15.2)
329
(25.9)
0.023 0.51
(0.27-0.93)
0.024
5.10
0.033 0.51
(0.28-0.95)
6A
12
5 (7.4) 24 (1.9) 0.012
||
4.21
(1.21-11.74)
0.002
9.45
0.017 4.17
(1.29-13.46)
5 (5.4) 24 (1.9) 0.041
||
2.99
(0.87-8.25)
0.019
5.48
0.053 3.14
(0.98-10.03)
SFTPA2
1A
10
4 (5.9) 19 (1.5) 0.024
||
4.20
(1.01-13.13)
0.005
7.92
0.401 1.85
(0.44-7.79)
5 (5.4) 18 (1.4) 0.016
||
4.00
(1.13-11.52)
0.003
8.93
0.275 1.92
(0.59-6.23)
SFTPA1-SFTPA2
6A
3
-1A
1
3 (4.4) 163
(12.6)
0.045 0.32
(0.06-1.00)
0.047
3.94
0.063 0.26
(0.06-1.08)
5 (5.4) 161
(12.7)
0.041 0.40
(0.12-0.98)
0.043
4.40
0.055 0.373
(0.14-1.02)
6A-1A 7
(10.3)
51 (3.9) 0.022
||
2.80
(1.03-6.55)
0.008
6.93
0.024 2.66 (1.14-
6.30)
8 (8.7) 50 (3.9) 0.053
||
2.33
(0.92-5.16)
0.021
5.31
0.045 2.23 (1.02-
4.89)
Frequency values are the number of chromosomes (%). Only relevant haplotypes are shown. SNPs: Single nucleotide polymorphisms; CAP: Community-acquired
pneumonia.
*Haplotypes for SFTPA1 and SFTPA2, resulting from the different combinations of the three SNPs studied at each gene, are denoted using the conventional
nomenclature [15].
†
P value for the bivariate comparison.
‡
P value for log-rank (LR) c
2
test for survival rates related to haplotypes.
§
P value for Cox proportional hazard ratio for multivariate analysis, including the variables age, gender, hospital of origin and co-morbidities.
||
P value by Fischer exact test.
Figure 2 Kaplan-Meier estimati on of survival at 28 and 90 days in the 682 CAP patients.CAP,community-acquired pneumonia. Solid
curves represent the haplotypes under study, being dotted curves the rest of haplotypes. The vertical dotted line is depicted at 28 days.
Significance levels for each comparison are shown in Table 4.
García-Laorden et al. Critical Care 2011, 15:R57
/>Page 7 of 12
Table 5 Predisposition to MODS related to SFTPD alleles and to SFTPD, SFTPA1 and SFTPA2 haplotypes in patients
with CAP
Allele or haplotype* MODS No MODS P
†
OR (95% CI)
P
‡
OR (95% CI)
P
§
OR (95% CI)
SFTPD N = 178 N = 1,186
C 85 (47.8) 454 (38.4) 0.016
1.47 (1.06-2.05)
0.002
1.68 (1.20-2.35)
0.043
1.46 (1.01-2.10)
SFTPA1 N = 178 N = 1,186
6A 14 (7.9) 76 (6.4) 0.465
1.25 (0.64-2.29)
SFTPA2 N = 178 N = 1,186
1A 32 (18.0) 115 (9.7) 0.0009
2.04 (1.28-3.17)
0.0004
2.29 (1.45-3.62)
0.002
2.21 (1.34-3.65)
1A
10
8 (4.5) 15 (1.3) 0.006
||
3.67 (1.33-9.38)
0.033
2.70 (1.08-6.76)
0.033
2.98 (1.09-8.10)
SFTPA1-SFTPA2 N = 178 N = 1,186
6A-1A 12 (6.7) 46 (3.9) 0.078 1.79 (0.85-3.52) - -
6A
3
-1A
1
13 (7.3) 153 (12.9) 0.033
0.53 (0.27-0.97)
0.115
0.62 (0.34-1.13)
0.097
0.58 (0.31-1.10)
For allelic and haplotypic frequencies values are the number of chromosomes (%). Only relevant haplotypes are shown. CAP: Community Acquired Pneumonia;
MODS: Multi-organ Dysfunction Syndrome.
*Haplotypes for SFTPA1 and SFTPA2, resulting from the different combinations of the three SNPs (Single nucleotide polymorphisms) studied at each gene, are
denoted using the conventional nomenclature [15].
†
P-value for the bivariate comparison.
‡
P-value for multivariate analysis, including the variables age, gender, hospital of origin and co-morbidities. For those bivariate comparisons that resulted in non-
significant differences, multivariate analysis were not calculated.
§
P-value for multivariate analysis, including the variables hospital of origin, PSI (Pneumonia Severity Index) and pathogen.
||
P-value by Fischer exact test.
Table 6 Predisposition to ARDS related to SFTPD alleles and to SFTPD, SFTPA1 and SFTPA2 haplotypes in patients with
CAP
Allele or haplotype * ARDS No ARDS P
†
OR (95% CI)
P
‡
OR (95% CI)
P
§
OR (95% CI)
SFTPD N = 52 N = 1,312
C 29 (55.8) 510 (38.9) 0.015
1.98 (1.09-3.63)
0.032
1.92 (1.06-3.48)
0.050
1.79 (1.00-3.20)
SFTPA1 N = 52 N = 1,312
6A 8 (15.4) 82 (6.3) 0.018
||
2.73 (1.07-6.11)
0.004
3.89 (1.56-9.72)
0.022
2.64 (1.15-6.08)
SFTPA2 N = 52 N = 1,312
1A 7 (13.5) 140 (10.7) 0.524 1.30 (0.49-2.98) - -
1A
10
1 (1.9) 22 (1.7) 0.594
||
1.15 (0.03-7.40)
SFTPA1-SFTPA2 N = 52 N = 1,312
6A-1A 7 (13.5) 51 (3.9) 0.005
§
3.85 (1.39-9.15)
0.0006
5.83(2.12-16.04)
0.012
3.16 (1.28-7.80)
6A
3
-1A
1
5 (9.6) 161 (12.3) 0.566
0.76 (0.23-1.94)
For allelic and haplotypic frequencies values are the number of chromosomes (%). Only relevant haplotypes are shown. CAP: Community Acquired Pneumonia;
ARDS: Acute Respiratory Distress Syndrome.
*Haplotypes for SFTPA1 and SFTPA2, resulting from the different combinations of the three SNPs (Single nucleotide polymorphisms) studied at each gene, are
denoted using the conventional nomenclature [15].
†
P value for the bivariate comparison.
‡
P value for multivariate analysis, including the variables age, gender, hospital of origin and co-morbidities. For those bivariate comparisons that resulted in non-
significant differences, multivariate analysis were not calculated.
§
P value for multivariate analysis, including the variables hospital of origin, PSI (Pneumonia Severity Index) and pathogen.
||
P
-
value by Fischer exact test.
García-Laorden et al. Critical Care 2011, 15:R57
/>Page 8 of 12
haplotypes were also associated with a higher severity and
poor outcome; MODS, ARDS, and mortality were selected
becausetheyrepresentthemoresevereclinicalpheno-
types. Particularly, 1A
10
and 6A-1A were overrepresented
among patients who die d at 28 or 90 day s, and they also
predisposed to MODS and ARDS respectively. Likewise,
6A was associated with ARDS, and 1A was associated with
MODS. By contrast, 6A
3
and 6A
3
-1A
1
were underrepre-
sented in patients who died. The SFTPD aa11-C allele was
associated with the development of MODS and ARDS, but
no signif icant effects on mortality were observed. In spite
that the power of the test for some associations with out-
come and severity were higher than 80% for the observed
OR with a significance level of 5%, the number of indivi-
duals included in the analysis of outcome was relatively
small. Consequently, associations with outcome should be
interpreted with caution.
Only a few studies have addressed the role of the genetic
variability at SFTPA1,andSFTPA2 in infectious diseases
[28-31]. In bacterial infections, homozygosity for the 1A
1
haplotype was reported to be associated with meningococ-
cal disease [30]. Noteworthy, 6A
2
-1A
0
was protective
against acute otitis media (AOM) in children [32]. Haplo-
types 6A
2
and 1A
0
may also be involved in protection
against respiratory syncytial virus (RSV) disease [29,33].
Considering the high difference in the frequencies with
the corresponding alternative alleles and haplotypes, it is
tempting to speculate that 6A
2
, 1A
0
and 6A
2
-1A
0
could
have been maintained at high frequencies partl y by their
protective effect against respiratory infections. The 6A and
6A-1A haplotypes were found to be associated with an
increased risk of wheeze and persistent cough, presumably
triggered b y respiratory infections or environmental
contaminants, among infants at risk for asthma [27].
Regarding SP -D, the SFTPD aa11-T allele was associated
with severe RSV bronchiolitis [34], whereas the SFTPD
aa11-C variant was associated with tuberculosis [30].
In sharp contrast to the potentially proinflammatory
effects after PAMP recognition by collectins, mice defi-
cient in SP-A or SP-D develop enhanced inflammatory
pulmonary responses [35-37]. SP-A and SP-D play a
dual role in the inflammatory response. They interact
with pathogens via their CRD, and are recognized by
calreticulin/CD91 on phagocytes through the N-terminal
collagen domain, promoting phagocytosis and proin-
flammatory responses [10,13]. By contrast, binding of
the CRD to signal inhibitory regulatory protein a
(SIRPa) on alveolar macrophages suppresses NF-B
activation and inflammation, allowing the lung to
remain in a quiescent state during periods of health
[10]. A similar dual effect is observed in the promotion
or inhibitio n of apoptosis [12]. SP-A and SP-D can also
inhibit inflammation by blocking, through the CRD,
Toll-like receptors 2 and 4 [38,39]. In agreement with
previous results [16], we have observed that the SFTPD
aa11-C allele associates with significantly lower SP-D
serum levels than the aa11-T allele, and this effect was
dose-dependent. The aa11-C/T SNP, located in the N-
terminal domain, influences oligomerization of SP-D
and explains a significant part of the heritability of
serum SP-D levels [16,40]. Serum from aa11-C homozy-
got es lack the highest molecular weight (m.w.) forms of
the protein, which binds preferentially to complex
microorganisms whereas the low m.w. SP-D preferen-
tially binds LPS [16].
As a consequence of intracellular oligomerization,
monomeric SP-A subunits fold into trimers, and supratri-
meric assembly leads to high-order oligomers [41,42].
The degree of supratrimeric oligomerization is important
for the host defense function [14,41,43-45]. SP-A1 an d
SP-A2 differ in only four amino acids (resid ues 66, 73, 81
and 85) located in the collagen domain [46]. In most
functions examined, recombinant human (rh) SP-A2
shows higher biological activity than SP-A1 [14,41,47-50].
The significance and the nature of functional differ-
ences between variants at SP-A1 and SP-A2 are poorly
understood [14,49,50]. Variants aa50 (SP-A1) and aa91
(SP-A2) are located in the collagen r egion. These
changes may affect the oligomerization pattern and
binding to receptors such as calreticulin/CD91 or the
functional activity of the protein. Likewise, the variants
aa219 (SP-A1) and aa223 (SP-A2) are located in the
CRD, and might directly influence the binding proper-
ties to microorganisms or to surface receptors such as
SIRPa or TLR4. Residue 9, and frequently residue 19, is
located in the signal peptide, and it is not know whether
these variants may affect the function of the protein
Figure 3 SP-D serum levels (ng/ml) regarding to SFTPD
genotypes in healthy controls. The comparison of the three
groups showed a significant difference (ANOVA P = 0.017).
Horizontal lines denote mean value for each genotype.
García-Laorden et al. Critical Care 2011, 15:R57
/>Page 9 of 12
[14,44]. Alternatively a ll the missense variants could be
in LD with SNPs in regulatory regions that might affect
translation and RNA stability [51,52].
Native SP-A is thought to consist of hetero-oligomers
of SP-A1 and SP-A2, and properties of co-expressed SP-
A1/SP-A2 are between those of SP-A1 and SP-A2
[41,46] . However, the extent of oligomerization of SP-A,
as well as the SP-A1/SP-A2 ratio, may be altered in var-
ious diseases and can vary among individuals [53,54].
The combination of both gene products may be impor-
tant for reaching a fully native conformation [41]. In
fact, it was recently shown that both SP-A1 and SP-A2
are necessary for the formation of pulmonar tubular
myelin [55]. Therefore, the effect of a given haplotype
may be largely influenced by haplotypes at the other
gene. Our results suggest that the 6A
2
to1A
0
haplotype
is more protective against CAP than both 6A
2
and 1A
0
.
It was previously reported that the SFTPD aa11 SNP
is in LD with SFTPA1 and SFTPA2 [25]. A protective
effect of the 6A
2
to 1A
0
haplotype was e ven higher
when this haplotype c o-segregates with the SFTPD
aa11-C allele. Likewise, one haplotype containing 6A
2
-
1A
0
and the G allele of the SFTPD aa160 SNP could be
protective against severe RSV disease [29]. Haplotypes at
SFTPA1 are in LD with SFTPD aa11 in our population,
but only a marginal LD between SFTPA2 and SFTPD
aa11 was observed. In addition, no LD between 6A
2
to
A
0
and SFTPD aa11 was found in controls (D’ =0.09)
or CAP patients (D’ = 0.024) in our study. These find-
ings suggest that the protective effect of the co-segrega-
tion of SFTPD aa11-C with 6A
2
to 1A
0
on CAP
susceptibility may rather reflect genetic interactions.
Alternatively, the SFTPD aa11 SNP may be a marker of
other SNPs in LD with SFTPA1 and SFTPA2.Thegene
of another collecting, the mannose-binding lectin
(MBL), is located at 10q11.2-q21. We have previously
observed that MBL deficiency predisposes to higher
severity and poor outcome in CAP [56], and LD of the
SP genes with MBL2 cannot be ruled out.
Despite modern antibiotics, CAP remains a common
cause of death, and the search for new therapeutic
approaches has been redirected into non-antibiotic
therapies [57]. SP-A levels are reduced in several pul-
monary diseases [58-60]. SP-D may also be reduced in
some patients with ARDS [59]. In Sftpa
-/-
and Sftpd
-/-
mice, intratracheally administered SP-A or SP-D can
restore microbial clearance and inflammation [8,35].
Exogenous surfactant preparation containi ng the hydro-
phobic SP-B and -C are nowadays widely used for repla-
cement therapies in infantile RDS. In addition,
intratracheal instillation of recombinant SP-C reduced
mortality in patients with severe ARDS due to pneumo-
nia or aspiration [61]. Some of the genetic variants ana-
lyzed in our survey, such as 1A
10
, although rare, may
have a high impact on susceptibility, severity and out-
come of CAP. Validation of our results in other popula-
tions, and a better knowledge of the functional and
clinical significance of the genetic variability at SFTPA1,
SFTPA2 and SFTPD could be relevant for future investi-
gations in the use of these collectins in the treatment of
respiratory infectious diseases.
Conclusions
The surfactant proteins A1, A2 and D are key compo-
nents of innate immune response and the anti-
inflammatory status in the lung. Genetic variability at
the genes of these collectins influences susceptibility and
outcome of community-acquired pneumonia. These
results could be relevant for future investi gations in the
use of these collectins in the treatment of respiratory
infectious diseases.
Key messages
• The SFTPA1 and SF TPA2 haplotypes 6A
2
, 1A
0
and
6A
2
to 1A
0
, and the SFTPD-SFTPA1-SFTPA2 haplo-
type C-6A
2
to 1A
0
are associated w ith a protective
role against the development of Community-
acquired pneumonia (CAP).
• 1A
10
and 6A
3
to 1A haplotypes are associated with
increased susceptibility to CAP.
• Haplotypes 6A and 6A to 1A are associated with
development of ARDS, while 1A and 1A
10
are asso-
ciated with MODS in patients with CAP.
• The variant SFTPD aa11-C leads to decr eased SP-
D serum levels, and predisposes to development of
MODS and ARDS in patients with CAP.
• Haplotypes 6A
12
, 1A
10
and 6A to 1A are overrepre-
sented among patients who died at 28 or 90 days. By
contrast, 6A
3
and 6A
3
to 1A
1
areprotectiveagainst
28-day and 90-day mortality.
Additional material
Additional file 1: Further description of methods, definitions and
statistical analysis, and Tables E1-E4. The file contains additional
information on exclusion criteria and definitions of PSI, ARDS and MODS.
The statistical tests used are described. The additional file also includes
four tables. Table E1 defines the resulting haplotypes from SNPs
combination in SFTPA1 and SFTPA2 genes. Table E2 presents
demographic and clinical characteristics of CAP patients. Table E3 shows
the pairwise linkage disequilibrium measure for surfactant proteins A1,
A2 and D alleles. Table E4 compares haplotypes of SFTPA1, SFTPA2 and
SFTPD between patients with pneumococcal CAP and controls.
Abbreviations
AOM: acute otitis media; ARDS: acute respiratory distress syndrome; CAP:
community-acquired pneumonia; CRD: carbohydrate-binding recognition
domain; LD: linkage disequilibrium; MBL: mannose-binding lectin; MODS:
multi-organ dysfunction syndrome; PAMP: pathogen-associated molecular
pattern; PID: primary immunodeficiency; RSV: respiratory syncitial virus; SIRP:
García-Laorden et al. Critical Care 2011, 15:R57
/>Page 10 of 12
signal inhibitory regulatory protein; SNP: single nucleotide polymorphism; SP:
surfactant protein; TLR: toll-like receptor.
Acknowledgements
We are grateful to the patients and their families for their trust, as well as to
the healthy volunteers. We also thank Ignacio Martin-Loeches, Ana
Dominguez, Yanira Florido and Consuelo Ivañez for their invaluable help,
and P. Mangiaracina for his assistance with the final editing of the English
manuscript. The present study was supported by grants from “Fondo de
Investigaciones Sanitarias”, Ministerio de Sanidad (FIS 02/1620, 04/1190 and
06/1031) with the funding of European Regional Development Fund-
European Social Fund (FEDER-FSE); “Sociedad Española de Neumología y
Cirugía Torácica” (SEPAR); RedRespira-ISCIII-RTIC-03/11; FUNCIS, Gobierno de
Canarias (04/09); NGQ was supported by FUNCIS (INREDCAN 5/06), MIGL by
FUNCIS (Proyecto Biorregion 2006) and EHR by a grant from Universidad de
Las Palmas de Gran Canaria.
Author details
1
Department of Immunology, Hospital Universitario de Gran Canaria Dr.
Negrín, Barranco de la Ballena s/n, Las Palmas de Gran Canaria, 35010, Spain.
2
Department of Respiratory Diseases, Hospital Universitario de Gran Canaria
Dr. Negrín, Barranco de la Ballena s/n, Las Palmas de Gran Canaria, 35010,
Spain.
3
Department of Medical and Surgical Sciences, School of Medicine,
University of Las Palmas de Gran Canaria, Avenida Marítima del Sur s/n, Las
Palmas de Gran Canaria, 35016, Spain.
4
Intensive Care Unit, Hospital
Universitario de Gran Canaria Dr. Negrín, Barranco de la Ballena s/n, Las
Palmas de Gran Canaria, 35010, Spain.
5
Department of Respiratory Diseases,
Hospital Universitario de la Princesa, Diego de León 62, Madrid, 28005, Spain.
6
Intensive Care Unit, Hospital Clínico y Universitario de Valencia, Avenida
Blasco Ibáñez 17, Valencia, 46010, Spain.
7
Department of Respiratory
Diseases, Hospital San Jorge, Avenida Martínez de Velasco 36, Huesca, 22004,
Spain.
8
Department of Respiratory Diseases, Hospital Clínico y Universitario
de Valencia, Avenida Blasco Ibáñez 17, Valencia, 46010, Spain.
9
Department
of Mathematics, University of Las Palmas de Gran Canaria, Campus
Universitario de Tafira, Las Palmas de Gran Canaria, 35017, Spain.
10
Intensive
Care Unit, Hospital Dr. José Molina Orosa, Carretera Arrecife-Tinajo km 1.300,
Lanzarote, 35550, Spain.
11
Hospital Vall D’Hebron - Universitat Autonoma de
Barcelona. CIBERES. Institut de Recerca Vall d’Hebron (VHIR), Passeig de la
Vall d’Hebron 119-129, Barcelona, 08035, Spain.
Authors’ contributions
MIGL did the genotyping and protein measurements, analyzed and
interpreted the data, and contributed to the writing of the manuscript. FRC
and JSV were responsible for the clinical evaluations of patients, samples
and data collection, collaborated in designing the study, as well as
contributed to the interpretation of data and the writing of the manuscript.
OR, JB, LB, JA, MLB, JAMR, JMF and JR were also responsible for clinical
evaluation of patients, samples and data collection. PS participated in the
statistical analysis. NGQ, IS and EHR did genotyping. CRG conceived the
study, analyzed and interpreted data, and wrote the manuscript.
Competing interests
The authors declare that they have no competing interests.
Received: 21 September 2010 Revised: 20 December 2010
Accepted: 10 February 2011 Published: 10 February 2011
References
1. Mandell LA, Bartlett JG, Campbell GD, Dean NC, Dowell SF, File TM Jr,
Musher DM, Niederman MS, Torres A, Whitney CG: Infectious Diseases
Society of America/American Thoracic Society consensus guidelines on
the management of community-acquired pneumonia in adults. Clin
Infect Dis 2007, 44:S27-72.
2. Bustamante J, Boisson-Dupuis S, Jouanguy E, Picard C, Puel A, Abel L,
Casanova JL: Novel primary immunodeficiencies revealed by the
investigation of paediatric infectious diseases. Curr Opin Immunol 2008,
20:39-48.
3. Alcaïs A, Abel L, Casanova JL: Human genetics of infectious diseases:
between proof of principle and paradigm. J Clin Invest 2009,
119:2506-2514.
4. Wright JR: Immunoregulatory functions of surfactant proteins. Nat Rev
Immunol 2005, 5:58-68.
5. Geertsma MF, Nibbering PH, Haagsman HP, Daha MR, van Furth R: Binding
of surfactant protein A to C1q receptors mediates phagocytosis of
Staphylococcus aureus by monocytes. Am J Physiol 1994, 267:L578-L584.
6. Haczku A: Protective role of the lung collectins surfactant protein A and
surfactant protein D in airway inflammation. J Allergy Clin Immunol 2008,
122:861-879.
7. LeVine AM, Whitsett JA: Pulmonary collectins and innate host defense of
the lung. Microbes Infect 2001, 3:161-166.
8. LeVine AM, Whitsett JA, Hartshorn KL, Crouch EC, Korfhagen TR: Surfactant
protein D enhances clearance of influenza A virus from the lung in vivo.
J Immunol 2001, 167:5868-5873.
9. Giannoni E, Sawa T, Allen L, Wiener-Kronish J, Hawgood S: Surfactant
proteins A and D enhance pulmonary clearance of Pseudomonas
aeruginosa. Am J Respir Cell Mol Biol 2006, 34:704-710.
10. Gardai SJ, Xiao YQ, Dickinson M, Nick JA, Voelker DR, Greene KE,
Henson PM: By binding SIRPα or calreticulin/CD91, lung collectins act as
dual function surveillance molecules to suppress or enhance
inflammation. Cell 2003, 155:13-23.
11. Sorensen GL, Husby S, Holmskov U: Surfactant protein A and surfactant
protein D variation in pulmonary disease. Immunobiology 2007,
212:381-416.
12. Janssen WJ, McPhillips KA, Dickinson MG, Linderman DJ, Morimoto K,
Xiao YQ, Oldham KM, Vandivier RW, Henson PM, Gardai SJ: Surfactant
proteins A and D suppress alveolar macrophage phagocytosis via
interaction with SIRPα. Am J Respir Crit Care Med 2008, 178:158-167.
13. Vandivier RW, Ogden CA, Fadok VA, Hoffmann PR, Brown KK, Botto M,
Henson PM, Greene KE: Role of surfactant proteins A, D, and C1q in the
clearance of apoptotic cells in vivo and
in vitro:
calreticulin and CD91 as
a common collectin receptor complex. J Immunol 2002, 169:3978-3986.
14. Wang G, Bates-Kenney SR, Tao JQ, Phelps DS, Floros J: Differences in
biochemical properties and in biological function between human SP-
A1 and SP-A2 variants, and the impact of ozone-induced oxidation.
Biochemistry 2004, 43:4227-4239.
15. DiAngelo S, Lin Z, Wang G, Phillips S, Ramet M, Luo J, Floros J: Novel, non-
radioactive, simple and multiplex PCR-cRFLP methods for genotyping
human SP-A and SP-D marker alleles. Dis Markers 1999, 15:269-281.
16. Leth-Larsen R, Garred P, Jensenius H, Meschi J, Hartshorn K, Madsen J,
Sørensen G, Crouch E, Holmskov U: A common polymorphism in the
SFTPD gene influences assembly, function, and concentration of
surfactant protein D. J Immunol 2005, 174:1532-1538.
17. Fine MJ, Auble TE, Yealy DM, Hanusa BH, Weissfeld LA, Singer DE,
Coley CM, Marrie TJ, Kapoor WN: A prediction rule to identify low-risk
patients with community-acquired pneumonia. N Engl J Med 1997,
336:243-250.
18. Bernard GR, Artigas A, Brigham KL, Carlet J, Falke K, Hudson L, Lamy M,
Legall JR, Morris A, Spragg R: The American-European Consensus
Conference on ARDS. Definitions, mechanisms, relevant outcomes, and
clinical trial coordination. Am J Respir Crit Care Med 1994, 149:818-824.
19. Bone RC, Balk RA, Cerra FB, Dellinger RP, Fein AM, Knaus WA, Schein RM,
Sibbald WJ: Definitions for sepsis and organ failure and guidelines for
the use of innovative therapies in sepsis. The ACCP/SCCM Consensus
Conference Committee. American College of Chest Physicians/Society of
Critical Care Medicine. Chest 1992, 101:1644-1655.
20. Pantelidis P, Lagan AL, Davies JC, Welsh KI, du Bois RM: A single round PCR
method for genotyping human surfactant protein (SP)-A1, SP-A2 and
SP-D gene alleles. Tissue Antigens 2003, 61:317-321.
21. PHASE statistical software. [ />phase.html].
22. Excoffier L, Laval G, Schneider S: Arlequin ver. 3.0: An integrated software
package for population genetics data analysis. Evolutionary Bioinformatics
Online 2005, 1:47-50.
23. Barrett JC, Fry B, Maller J, Daly MJ: Haploview: analysis and visualization of
LD and haplotype maps. Bioinformatics 2005, 21:263-265.
24. The R Project for Statistical Computing. [].
25. Liu W, Bentley CM, Floros J: Study of human SP-A, SP-B and SP-D loci:
allele frequencies, linkage disequilibrium and heterozygosity in different
races and ethnic groups. BMC Genet 2003, 4:13.
26. Floros J, DiAngelo S, Koptides M, Karinch AM, Rogan PK, Nielsen H,
Spragg RG, Watterberg K, Deiter G: Human SP-A locus: allele frequencies
García-Laorden et al. Critical Care 2011, 15:R57
/>Page 11 of 12
and linkage disequilibrium between the two surfactant protein A genes.
Am J Respir Cell Mol Biol 1996, 15:489-498.
27. Pettigrew MM, Gent JF, Zhu Y, Triche EW, Belanger KD, Holford TR,
Bracken MB, Leaderer BP: Respiratory symptoms among infants at risk for
asthma: association with surfactant protein A haplotypes. BMC Med
Genet 2007, 8:15-27.
28. Löfgren J, Rämet M, Renko M, Marttila R, Hallman M: Association between
surfactant protein A gene locus and severe respiratory syncytial virus
infection in infants. J Infect Dis 2002, 185:283-289.
29. Thomas NJ, DiAngelo S, Hess JC, Fan R, Ball MW, Geskey JM, Willson DF,
Floros J: Transmission of surfactant protein variants and haplotypes in
children hospitalized with respiratory syncytial virus. Pediatr Res 2009,
66:70-73.
30. Floros J, Lin HM, García A, Salazar MA, Guo X, DiAngelo S, Montaño M,
Luo J, Pardo A, Selman M: Surfactant protein genetic marker alleles
identify a subgroup of tuberculosis in a Mexican population. J Infect Dis
2000, 182:1473-1478.
31. Jack DL, Cole J, Naylor SC, Borrow R, Kaczmarski EB, Klein NJ, Read RC:
Genetic polymorphism of the binding domain of surfactant protein-A2
increases susceptibility to meningococcal disease. Clin Infect Dis 2006,
43:1426-1433.
32. Rämet M, Löfgren J, Alho OP, Hallman M: Surfactant protein-A gene locus
associated with recurrent otitis media. J Pediatr 2001, 138:266-268.
33. El Saleeby CM, Li R, Somes GW, Dahmer MK, Quasney MW, DeVincenzo JP:
Surfactant protein A2 polymorphisms and disease severity in a
respiratory syncytial virus-infected population. J Pediatr 2010,
156:409-414.
34. Lahti M, Lofgren J, Marttila R, Renko M, Klaavuniemi T, Haataja R, Ramet M,
Hallman M: Surfactant protein D gene polymorphism associated with
severe respiratory syncytial virus infection. Pediatr Res 2002, 51:696-699.
35. Borron P, McIntosh JC, Korfhagen TR, Whitsett JA, Taylor J, Wright JR:
Surfactant-associated protein A inhibits LPS-induced cytokine and nitric
oxide production in vivo. Am J Physiol Lung Cell Mol Physiol 2000, 278:
L840-L847.
36. Botas C, Poulain F, Akiyama J, Brown C, Allen L, Goerke J, Clements J,
Carlson E, Gillespie AM, Epstein C, Hawgood S: Altered surfactant
homeostasis and alveolar type II cell morphology in mice lacking
surfactant protein D. Proc Natl Acad Sci USA 1998, 95:11869-11874.
37. Hawgood S, Ochs M, Jung A, Akiyama J, Allen L, Brown C, Edmondson J,
Levitt S, Carlson E, Gillespie AM, Villar A, Epstein CJ, Poulain FR: Sequential
targeted deficiency of SP-A and -D leads to progressive alveolar
lipoproteinosis and emphysema. Am J Physiol Lung Cell Mol Physiol 2002,
283:L1002-L1010.
38. Murakami S, Iwaki D, Mitsuzawa H, Sano H, Takahashi H, Voelker DR,
Akino T, Kuroki Y: Surfactant protein A inhibits peptidoglycan-induced
tumor necrosis factor-alpha secretion in U937 cells and alveolar
macrophages by direct interaction with toll-like receptor 2. J Biol Chem
2002, 277:6830-6837.
39. Guillot L, Balloy V, McCormack FX, Golenbock DT, Chignard M, Si-Tahar M:
Cutting edge: the immunostimulatory activity of the lung surfactant
protein-A involves Toll-like receptor 4. J Immunol 2002, 168:5989-5992.
40. Sørensen GL, Hjelmborg JB, Kyvik KO, Fenger M, Høj A, Bendixen C,
Sørensen TI, Holmskov U: Genetic and environmental influences of
surfactant protein D serum levels. Am J Physiol Lung Cell Mol Physiol 2006,
290:L1010-L1017.
41. Sánchez-Barbero F, Rivas G, Steinhilber W, Casals C: Structural and
functional differences among human surfactant proteins SP-A1, SP-A2
and co-expressed SP-A1/SP-A2: role of supratrimeric oligomerization.
Biochem J 2007, 406:479-489.
42. Voss T, Eistetter H, Schafer KP, Engel J: Macromolecular organization of
natural and recombinant lung surfactant protein SP 28-36. Structural
homology with the complement factor C1q. J Mol Biol 1988, 201:219-227.
43. Sánchez-Barbero F, Strassner J, García-Cañero R, Steinhilber W, Casals C:
Role of the degree of oligomerization in the structure and function of
human surfactant protein A. J Biol Chem 2005, 280:7659-7670.
44. Wang G, Myers C, Mikerov A, Floros J: Effect of cysteine 85 on
biochemical properties and biological function of human surfactant
protein A variants. Biochemistry 2007, 46:8425-8435.
45. Yamada C, Sano H, Shimizu T, Mitsuzawa H, Nishitani C, Himi T, Kuroki Y:
Surfactant protein A directly interacts with TLR4 and MD-2 and
regulates inflammatory cellular response. Importance of supratrimeric
oligomerization. J Biol Chem 2006, 281:21771-21780.
46. Floros J, Hoover RR: Genetics of the hydrophilic surfactant proteins A and
D. Biochim Biophys Acta 1998, 1408:312-322.
47. Garcia-Verdugo I, Wang G, Floros J, Casals C: Structural analysis and lipid-
binding properties of recombinant human surfactant protein a derived
from one or both genes. Biochemistry 2002, 41:14041-14053.
48. Oberley RE, Snyder JM: Recombinant human SP-A1 and SP-A2 proteins
have different carbohydrate-binding characteristics. Am J Physiol Lung
Cell Mol Physiol 2003, 284:L871-L881.
49. Wang G, Phelps DS, Umstead TM, Floros J: Human SP-A protein variants
derived from one or both genes stimulate TNF-alpha production in the
THP-1 cell line. Am J Physiol Lung Cell Mol Physiol 2000, 278:L946-L954.
50. Mikerov AN, Wang G, Umstead TM, Zacharatos M, Thomas NJ, Phelps DS,
Floros J: Surfactant protein A2 (SP-A2) variants expressed in CHO cells
stimulate phagocytosis of Pseudomonas aeruginosa more than do SP-
A1 variants. Infect Immun 2007, 75:1403-1412.
51. Wang G, Guo X, Floros J: Differences in the translation efficiency and
mRNA stability mediated by 5’-UTR splice variants of human SP-A1 and
SP-A2 genes. Am J Physiol Lung Cell Mol Physiol 2005, 289:L497-L508.
52. Wang G, Guo X, Floros J: Human SP-A 3’
-UTR variants mediate differential
gene expression in basal levels and in response to dexamethasone. Am
J Physiol Lung Cell Mol Physiol 2003, 284:L738-L748.
53. Tagaram HR, Wang G, Umstead TM, Mikerov AN, Thomas NJ, Graff GR,
Hess JC, Thomassen MJ, Kavuru MS, Phelps DS, Floros J: Characterization of
a human surfactant protein A1 (SP-A1) gene-specific antibody; SP-A1
content variation among individuals of varying age and pulmonary
health. Am J Physiol Lung Cell Mol Physiol 2007, 292:L1052-L1063.
54. Hickling TP, Malhotra R, Sim RB: Human lung surfactant protein A exists in
several different oligomeric states: oligomer size distribution varies
between patient groups. Mol Med 1998, 4:266-275.
55. Wang G, Guo X, Diangelo S, Thomas NJ, Floros J: Humanized SFTPA1 and
SFTPA2 transgenic mice reveal functional divergence of SP-A1 and SP-
A2: Formation of tubular myelin in vivo requires both gene products. J
Biol Chem 2010, 285:11998-12010.
56. Garcia-Laorden MI, Sole-Violan J, Rodriguez de Castro F, Aspa J, Briones ML,
Garcia-Saavedra A, Rajas O, Blanquer J, Caballero-Hidalgo A, Marcos-
Ramos JA, Hernandez-Lopez J, Rodriguez-Gallego C: Mannose-binding
lectin and mannose-binding lectin-associated serine protease 2 in
susceptibility, severity, and outcome of pneumonia in adults. J Allergy
Clin Immunol 2008, 122:368-374.
57. Rodriguez A, Lisboa T, Blot S, Martin-Loeches I, Solé-Violan J, De
Mendoza D, Rello J, Community-Acquired Pneumonia Intensive Care Units
(CAPUCI) Study Investigators: Mortality in ICU patients with bacterial
community-acquired pneumonia: when antibiotics are not enough.
Intensive Care Med 2009, 35:430-438.
58. Pison U, Obertacke U, Brand M, Seeger W, Joka T, Bruch J, Schmit-
Neuerburg KP: Altered pulmonary surfactant in uncomplicated and
septicaemia-complicated courses of acute respiratory failure. J Trauma
1990, 30:19-26.
59. Greene KE, Wright JR, Steinberg KP, Ruzinski JT, Caldwell E, Wong WB,
Hull W, Whitsett JA, Akino T, Kuroki Y, Nagae H, Hudson LD, Martin TR:
Serial changes in surfactant-associated proteins in lung and serum
before and after onset of ARDS. Am J Respir Crit Care Med 1999,
160:1843-1850.
60. Noah TL, Murphy PC, Alink JJ, Leigh MW, Hull WM, Stahlman MT,
Whitsett JA: Bronchoalveolar lavage fluid surfactant protein-A and
surfactant protein-D are inversely related to inflammation in early cystic
fibrosis. Am J Respir Crit Care Med 2003, 168:685-691.
61. Taut FJ, Rippin G, Schenk P, Findlay G, Wurst W, Häfner D, Lewis JF,
Seeger W, Günther A: A Search for subgroups of patients with ARDS who
may benefit from surfactant replacement therapy: a pooled analysis of
five studies with recombinant surfactant protein-C surfactant (Venticute).
Chest 2008, 134:724-732.
doi:10.1186/cc10030
Cite this article as: García-Laorden et al.: Influence of g e netic variability at
the surfactant proteins A and D in community-acquired pneumonia: a
prospective, observational, genetic s tudy. Critical Care 2011 15:R57.
García-Laorden et al. Critical Care 2011, 15:R57
/>Page 12 of 12