Báo cáo y học: " Arterial hyperoxia and in-hospital mortality after resuscitation from" pot
Bạn đang xem bản rút gọn của tài liệu. Xem và tải ngay bản đầy đủ của tài liệu tại đây (317.61 KB, 9 trang )
RESEARCH Open Access
Arterial hyperoxia and in-hospital mortality after
resuscitation from cardiac arrest
Rinaldo Bellomo
1*
, Michael Bailey
1
, Glenn M Eastwood
3
, Alistair Nichol
1
, David Pilcher
2
, Graeme K Hart
2
,
Michael C Reade
3
, Moritoki Egi
4
, D James Cooper
1
, the Study of Oxygen in Critical Care (SOCC) Group
Abstract
Introduction: Hyperoxia has recently been reported as an independent risk factor for mortality in patients
resuscitated from cardiac arrest. We examined the independent relationship between hyperoxia and outcomes in
such patients.
Methods: We divided patients resuscitated from nontraumatic cardiac arrest from 125 intensive care units (ICUs)
into three groups according to worst PaO
2
level or alveolar-arterial O
2
gradient in the first 24 hours after ad mission.
We defined ‘hyperoxia’ as PaO
2
of 300 mmHg or greater, ‘hypoxia/poor O
2
transfer’ as either PaO
2
< 60 mmHg or
ratio of PaO
2
to fraction of inspired oxygen (FiO
2
) < 300, ‘normoxia’ as any value between hypoxia and hyperoxia
and ‘isolated hypoxemia’ as PaO
2
< 60 mmHg regardless of FiO
2
. Mortality at hospital discharge was the main
outcome measure.
Results: Of 12,108 total patients, 1,285 (10.6%) had hyperoxia, 8,904 (73.5%) had hypoxia/poor O
2
transfer, 1,919
(15.9%) had normoxia and 1,168 (9.7%) had isolated hypoxemia (PaO
2
< 60 mmHg). The hyperoxia group had
higher mortality (754 (59%) of 1,285 patients; 95% confidence interva l (95% CI), 56% to 61%) than the normoxia
group (911 (47%) of 1,919 patients; 95% CI, 45% to 50%) with a proportional difference of 11% (95% CI, 8% to
15%), but not higher than the hypoxia group (5,303 (60%) of 8,904 patients; 95% CI, 59% to 61%). In a multivariable
model controlling for some potential confounders, including illness severity, hyperoxia had an odds ratio for
hospital death of 1.2 (95% CI, 1.1 to 1.6). However, once we applied Cox proportional hazards modelling of survival,
sensitivity analyses using deciles of hypox emia, time period matching and hyperoxia defined as PaO
2
> 400
mmHg, hyperoxia had no independent association with mortality. Importantly, after adjustment for FiO
2
and the
relevant covariates, PaO
2
was no longer predictive of hospital mortality (P = 0.21).
Conclusions: Among patients admitted to the ICU after cardiac arrest, hyperoxia did not have a robust or
consistently reproducible association with mortality. We urge caution in implementing policies of deliberate
decreases in FiO
2
in these patients.
Introduction
The majority of patients who experience cardiac arrest
die at the time of the event [1,2]. Even after response to
resuscitation efforts and survival to intensive care unit
(ICU) admission, such patients have a short-term mor-
tality of approximately 60% [1,2]. These dismal out-
comes suggest the need for strategies to attenuate
postresuscitation injury. Such injury is currently mostly
attributed to cerebral, myocardial and global ischemia-
reperfusion injury [3]. Accordingly, postresuscitation
therapy has focused on finding ways to diminish the
intensity and consequences of ischemia-reperfusion
injury.
The rapid application of therapeutic hypothermia can
mod ify the outco mes of patients after resuscitation from
cardiac arrest [4,5]. The success associated with this inter-
vention suggests that other aspects of patient care, which
may influence the course of reperfusion injury, should also
be logical targets for therapeutic manipulation.
In pursuit of potential therapeutic targets, investiga tors
from the Emergency Medicine Shock Research Network
* Correspondence:
1
Australian and New Zealand Intensive Care Research Centre, School of
Public Health and Preventive Medicine, Monash University, 5 Commercial
Road, Prahran, Melbourne, Victoria 3181, Australia
Full list of author information is available at the end of the article
Bellomo et al. Critical Care 2011, 15:R90
/>© 2011 Bellomo et al.; licen see BioMed Central Ltd. This is an open access article distributed under the terms of the Creati ve Commons
Attribution License ( whi ch permits unrestricted use, distribution, and reproduction in
any medium, provided the original work is prope rly cited.
(EMShockNet) recently explored the association between
hyperoxia and in-hospital outcome in a retrospective,
multicentre study [6]. They found that hyperoxia
occurredinalmostone-fifthof patients, that patients
with hyperoxia had greater in-hospital mortality than
patients with normoxia or hypoxia and that, after con-
trolling for some confounders, hyperoxia carried a c lear
independent association with mortality (odds ratio (OR),
1.8). Unfortunately, these investigators used on ly the first
set of arterial blood gases in the ICU to assess oxygena-
tion, excluded close to 30% of pa tients because of lack of
arterial blood gas data and did not adjust for standard ill-
ness severity scores. Their conclusion that hyperoxia is a
robust predictor of mortality in patients after resuscita-
tion form cardiac arrest was therefore potentially affected
by se lection bias and by insufficient adjustment for major
confounders. Thus, their re sults are of uncertain signifi-
cance and require confirmation.
The Australian and New Zealan d (ANZ) Adult Patient
Database (ANZ-APD) is a high-quality database [7] of
all admissions to most Australian and New Zealand
ICUs. Patients admitted after resuscitation from non-
traumatic cardiac arrest are coded as such. The database
recordscontainAcutePhysiologyandChronicHealth
Evaluation II (APACHE II) and APACHE III scores as
well as demographic, diagnostic and outcome factors
[8]. Given the potential clinical importance of hyperoxia
following cardiac arrest, we u sed this larger and more
detailed database specifically to confirm or refute the
initial findings of the EMShockNet investigators [6].
Materials and methods
We extracted data from the ANZ Intensive Care Society
(ANZICS)-APD. We used exactly same inclusion criteria
as the EMShockNet investigators [6] for patients
admitted at a participating centre between 2000 and
2009 after resuscitation from an out-of-hospital or in-
hospital cardiac arrest. We excluded readmissions and
patients for whom arterial blood gas analysis or vital sta-
tus at discharge was not available. The ANZICS Centre
for Outcomes a nd Resource Ev aluation (CORE) Man-
agement Committee granted u s access t o the data in
accordance with standing protocols. Data were collected
under the Quality Assurance Legislation of the Com-
monwealth of Australia (Part VC Health Insuran ce Act
1973, Commonwealth of Australia) with government
support and funding. Each hospital gives ethics approval
and allows the data to be used for appropr iate research,
which is governed by the ANZICS CORE terms of refer-
ence and waives the need for informed consent.
Data collection for oxygen values
All arterial blood gases during the first 24 hours o f ICU
admission were collected and entered into a standardized
data collection system which automatically selects the
appropriate high and low simul taneous fraction of
inspired oxygen (FiO
2
) and partial pressure of arterial
oxygen (PaO
2
) measurements and deletes other oxygena-
tion data. Using the APACHE II and III methodology for
intubated patients with FiO
2
≥0.5 , the PaO
2
associated
with the arterial blood gas with the highest alveolar-arter-
ial (A-a) gradient is se lected as the index of worst oxyge-
nation. For nonintubated patients or intubated patients
with FiO
2
< 0.5, the lowest arterial blood gas PaO
2
level
is recorded. The ratio of PaO
2
to FiO
2
(P/F rati o) is also
used as an index of illness severity.
Data extraction
We recorded the siz es, types and locations of the hospi-
tals. At the patient level, we extracted the following vari-
ables: demographics, comorbidities according to
APACHE II and III classifications, hospital and ICU
admission source, intubation, t reatment limitation, year
of admission, physiological and arterial blood gas para-
meters o ver the first 24 hours in the ICU, vital status at
hospital discharge, hospital discharge destination and an
APACHE III risk of death score [8]. As a marker of
severity of illness independent of arterial oxygenation,
we calculated an adjusted APACHE III index of illness
severity (AP3no-ox), in which the oxygen component of
the APACHE III scoring system was removed.
Statistical analyses
All analyses were performed using SAS version 9.2 (SAS
Institute Inc., Cary, NC, USA). Continuous data are pre-
sented as means ± standard deviations or as medians
with interquartile ranges (IQRs), depending on the
underlying data distribution. Categorical data are
reported as proportions. We categorized oxygenation
levels into the same three groups as in the EMShockNet
study [6], defined by the worst PaO
2
and P/F ratio
obtained in the first 24 hours of ICU admission. Thus,
we divided patients into three groups according to worst
PaO
2
or A-a O
2
gradient in the first 24 hours after
admission. We defined ‘hyperoxia’ as a PaO
2
300 mmHg
or greater, ‘hypoxia/poor O
2
transfer’ as either PaO
2
<
60 mmHg or a P/F ratio <300, ‘normoxia’ as any value
between hypoxia and hyperoxia and ‘isolated hypoxemia’
as PaO
2
< 60 mmHg regardless of FiO
2
level.
The primary outcome measures were in-hospital mor-
tality and survival time, which are reported as ORs (95%
confidence interval (95% CI)) or hazard ratios (HRs)
(95% CI), respectively. To determine functional recovery,
we also c onsidered discharge t o home a s a se condary
outcome. We comp ared outcomes between groups
using the c
2
test with the Bonferroni correction. We
conducte d multivariate analysis using logistic regression
for mortality and Cox proportional hazards regression
Bellomo et al. Critical Care 2011, 15:R90
/>Page 2 of 9
for survival time, with models constructed using both
stepwise selection and backwards elimination proce-
dures. To increase robustness and model validity, we
used a P value of 0.01 for variable inclusion. We applied
several models to the statistical analy sis of the indepen-
dent relationship between oxygenation and patient out-
come. We constructed an initial model for mortality in
accordance with the EMShockNet model (see Additional
file 1, Statistical appendix, Model 1) [ 8]. We then
applied a second model to improve discriminatory
power using AP3no-ox as a marker of severity (see
Additional file 1, Statistical appendix, Model cluster 2).
Finally, we conducted further sensitivity analysis inclu-
sive of propensity analysis [9], Cox proportional hazards
modelling, testing of different cutoff points for hyper-
oxia, analysis of subgroups contemporaneous with t he
EMShockNet cohort and assessment of PaO
2
according
to deciles (Additional file 1, Statistical appendix, Model
cluster 3).
As our database contained only the worst recorded
oxygenation in the first 24 hours after ICU admission,
we explored its r elationship with that of the first PaO
2
measurement after ICU admission (as in the EMShock-
Net study) and the mean oxygenation on ICU admission
days 1, 2 and 3 by sele cting 100 of the database pa tients
and o btaining additional data from all of their hospital
arterial blood gas records during their ICU stay (see
Additional file 1, Statistical appendix, Model cluster 3).
Statistical power considerations
The proportion of living patients with hyperoxia (PaO
2
> 400) was 5% (n = 280). Comprising 5,140 patients
who lived and 6,968 patients who died, this study had
93% power to detect a change of 1.5% (5% versus 6.5%)
in the proportion of patients with hyperoxia (PaO
2
>
400) with a two-sided P value of 0.05.
There were 625 patients in the data set with hyperoxia
(PaO
2
> 400). Comprising 11,483 patients without
hyperoxia, this study had 90% power to detect a differ-
ence in mortality of 7% (55% versus 62%) between
groups with a two-sided P value of 0.05. Given an
observed difference of 14% (55% versus 69%) in the
EMShockNet study between hyperoxic patients (PaO
2
>
400) and nonhyperoxic patients, we felt that this study
was adequately powered to detect a relationship between
mortality and PaO
2
> 400. In our study, the mortality
rate in the hyperoxia group (PaO
2
> 400) was only 0.5%
higher than that in the nonhyperoxia group ( 54.7% ver-
sus 55.2%, P = 0.22).
There were 531 hyperoxia survivors (PaO
2
> 300). With
4,609 nonhyperoxia survivors, this study had 80% power
to detect a difference between groups of 6% (64% versus
58%) regarding the proportion discharged to home with a
two-sided P value of 0.05. Given an observed difference of
6% (38% versus 44%) in the EMShockNet study between
hyperoxic survivors (PaO
2
> 300) discharged to home and
discharged nonhyperoxic survivors, we again felt that this
study was adequately powered to detect a relationship
between hyperoxia and discharge to home. In our study,
there was no observed difference in the proportion of
patients who were discharged to home between the hyper-
oxia and nonhyperoxia groups.
Results
There were 12,806 patients who met the study incl usion
criteria. Of these, 698 (5.4%) were excluded: 222 (1.7%)
had missing arterial blood gas data , 382 (3.0%) had
missing hospital mortality data and 94 (0.7%) were ICU
readmissions. The remaining 12,108 patients were
drawn from among 125 contributing ICUs. The median
number of cardiac arrest cases per hospital was 42 (IQR,
13-148). Baseline chara cteristics for all groups are given
in Tables 1 and 2.
The average age of patients was 64 years (SD ± 16),
and 64% (7,802) were male. A total of 8,175 patients
(68%)wereathomepriortohospital admission and
5,756 patient s (48%) were admitted to the ICU directly
from the Emergency Department. One-third (3,978) of
the patients had preexisting chronic comorbidities. The
median APACHE III risk of death was 66% (IQR, 36%-
84%). Most patients (8,904, 73.5%) had ‘hypoxia/poor O
2
transfer’, whi le 1,285 (10.6%) were hyp eroxic and 1,919
(15.9%) were normoxic. Isolated hypoxemia (PaO
2
<60
mmHg) was present in 1,168 patients (9.7%).
There were no significant differences in the m easured
physiological data between the three main oxygenation
groups (Table 3). Patients had a median lowest tempera-
ture of 34.9°C, and in 33% of the patients, this value was
below 34. 0°C. The median I CU length of stay for survi-
vors from ICU admission to hospital discharge was 3.8
days (IQR, 2.0 to 7.1), and for nonsu rvivors it was 1.5
days (IQR, 0.5 to 3.3). The median length of hospital
stay for survivors was 14.9 days (IQR, 8.2 to 27.2), and
for nonsurvivors it was 3.4 days (IQR, 1.5 to 8.1).
Overall, 6,968 patients (58%) died in the hospital
(Table 4). Mortality was significantly lower (P <0.0001)
in the normoxia group than in either the hyperoxia
group or the hypoxia/poor O
2
transfer group. It was
highest, however, in patients with ‘isolated hypoxemia’
(812 (70%) of 1,168 patients, P < 0.0001). The propor-
tion of patients discharged directly to h ome was signifi-
cantly higher in the normoxia group than in the other
groups. The lowest rate of discharge to home was in
patients with isolated hypoxemia (222 (19%) of 1,168
patients, P < 0.0001). Overall, 65% of survivors were dis-
charged directly to home.
When the EMShockNet statist ical model was repli-
cated, 12 risk factors were significantly associated with
Bellomo et al. Critical Care 2011, 15:R90
/>Page 3 of 9
in-hospital mortalit y (Table 5). Data were well fitted by
the model (Hosmer-Lemeshow goodness-of-fit test, P =
0.71), and the area under the curve (AUC) was 0.72.
Hypoxia/poor O
2
transfer or hyperoxia were signifi-
cantly associated with an increased risk of mortality in
comp arison to no rmoxia (OR 1.4 (95% CI, 1.3 to 1.6), P
< 0.0001, and OR 1.5 (95% CI, 1.3 to 1.8), P < 0.0001,
respectively). Once illness severity was added to the
model (Table 6) (Addit ional file 1, Statistical appendix,
Model cluster 2), the magnitude of the effect size was
markedly lower than in the original EMShockNet model
(hypoxia versus normoxia: OR 1.2 (95% CI, 1.1 to 1.4),
P = 0.002; hyperoxia versus normoxia: OR 1.2 (95% CI,
1.0 to 1.5), P = 0.04). This A PACHE-based model
showed improved discriminatory power in comparison
to the EMShockNet model (AUC 0.79 when AP3no-ox
was applied in isolation versus AUC 0.81 when AP3no-
ox was applied in combination with other variables
listed in Table 6). Data were well fitted by the model
(Hosmer-Lemeshow goodness-of-fit test, P = 0.42).
Table 1 Baseline characteristics of the study patients
a
Patient characteristics All patients
(N = 12,108)
Hypoxia/poor
O
2
exchange
(n = 8,904)
Normoxia
(n = 1,919)
Hyperoxia
(n = 1,285)
Mean age, yr (±SD) 64 (16) 64 (16) 62 (18) 65 (17)
Male sex, n (%) 7,802 (64) 5,778 (65) 1,228 (64) 796 (62)
Indigenous Australians, n (%) 515 (5) 388 (5) 74 (4) 53 (4)
Hospital admission source from home, n (%) 8,175 (68) 5,986 (67) 1,273 (66) 916 (71)
Acute renal failure, n (%) 2,368 (20) 1,916 (22) 237 (12) 215 (17)
Chronic comorbidities, n (%)
Cardiovascular disease, n (%) 2,395 (20) 1,821 (20) 357 (19) 217 (17)
Liver disease, n (%) 194 (2) 158 (2) 17 (1) 19 (1)
Renal disease, n (%) 668 (6) 488 (5) 100 (5) 80 (6)
Respiratory disease, n (%) 1,044 (9) 831 (9) 102 (5) 111 (9)
Cirrhosis, n (%) 195 (2) 158 (2) 18 (1) 19 (1)
Hepatic failure, n (%) 70 (1) 52 (1) 10 (1) 8 (1)
Immune suppression, n (%) 329 (3) 243 (3) 41 (2) 45 (4)
Cancer, n (%) 413 (3) 320 (4) 48 (3) 45 (4)
Markers of severity
Median APACHE III risk of death (IQR) 66% (36 to 84) 69% (40 to 86) 50% (20 to 73) 66% (36 to 84)
Median APACHE III risk of death (no oxygen)
b
(IQR) 58% (27 to 79) 60% (29 to 80) 47% (18 to 71) 58% (29 to 80)
ICU admission source, n (%)
Emergency department 5,756 (48) 4,123 (46) 1,035 (54) 598 (47)
Operating theatre 1,261 (10) 925 (10) 217 (11) 119 (9)
Other hospital 1,958 (16) 1,445 (16) 319 (17) 194 (15)
Ward 3,113 (26) 2,397 (27) 344 (18) 372 (29)
Treatment limitation
c
562 (5) 429 (5) 68 (4) 65 (5)
a
APACHE III, Acute Illness Severity and Chronic Health Evaluation III; IQR, interquartile range; ICU, intensive care unit;
b
APACHE III risk of death with oxygen
component removed from APACHE III score;
c
treatment limitation order or coded for palliative care.
Table 2 Baseline characteristics of the study hospitals
Hospital characteristics, n (%) All patients
(N = 12,108)
Hypoxia/poor O
2
exchange
(n = 8,904)
Normoxia
(n = 1,919)
Hyperoxia
(n = 1,285)
Hospital size
a
Small to medium (≤300 beds) 2,475 (20) 1,813 (20) 361 (19) 301 (23)
Large (301 to 500 beds) 5,277 (44) 3,906 (44) 843 (44) 528 (41)
Extra large (>500 beds) 4,356 (36) 3,185 (36) 715 (37) 456 (35)
Hospital type and location
Metropolitan community 2,670 (22) 1,988 (22) 437 (23) 245 (19)
Private 787 (6) 573 (6) 89 (5) 125 (10)
Rural 1,279 (11) 939 (11) 205 (11) 135 (11)
Tertiary academic 7,372 (61) 5,404 (61) 1,188 (62) 780 (61)
a
Defined according to Halpern et al. [30].
Bellomo et al. Critical Care 2011, 15:R90
/>Page 4 of 9
Propensity analysis (see Additional file 1, Statistical
appendix, Model cluster 3 ) did not alter this risk or the sig-
nificance of hyperoxia. However, when the secondary out-
come of discharge to home was considered, ox ygenatio n
status was no longer a statistically significant predictor (P =
0.64). Using a Cox proportional hazards regression model,
we found both hyperoxia and hypoxia/poor O
2
transfer to
increase the hazard of death in comparison to the nor-
moxia group (HR 1.3 (95% CI, 1.1 to 1.4), P <0.001,and
HR 1.3 (95% CI, 1.2 to 1.4), P < 0.0001, respectively). After
adjustment for the covariates described in Additional file 1,
Statistical appendix, Model cluster 2, however, oxygenation
status was no longer statistically significant (hyperoxia: OR
1.1 (95% CI, 1.0 to 1.2), P = 0.20; hypoxia: OR 1.1 (95% CI,
1.0 to 1.2), P = 0.01) (Table 6).
When a PaO
2
of 200 mmHg or greater was used to
define hyperoxia, after adjustment (Additional file 1, Sta-
tistical appendix, Model cluster 2), oxygenation status
was a statistically significant predictor of outcome (P =
0.002) (hyperoxia: OR 1.3 (95 % CI, 1.1 to 1.5), P =0.01;
hypoxia: OR 1.3 (95% CI, 1.1 to 1.5), P = 0.001). When
aPaO
2
of 400 mmHg or greater was used in sensitivity
analysis after adjustment, however (Additional file 1,
Statistical appendix, Model cluster 2), oxygenation status
was no longer statistically significant (P = 0.06) (hyper-
oxia: OR 1.0 (95% CI, 0.8 to 1.2), P = 0.71; hypoxia: OR
1.1 (95% CI, 1.0 to 1.3), P = 0.04).
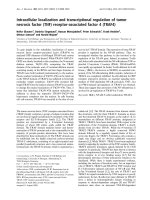
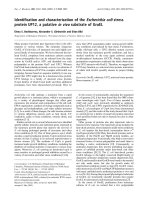
When PaO
2
was divided into deci les and modelled as a
predictor of hospit al mortality, it was statistically
significant at a univariate level (P < 0.0001), but with only
the lowest two deciles having ORs significantly greater
than the norm (Figure 1). After adjustment for FiO
2
and
the covariates described in Additional file 1, Statistical
appendix, Model cluster 2, PaO
2
was no longer predictive
of hospital mortality (P = 0.21), although those patients
with isolated hypoxemia (PaO
2
< 60 mmHg) had a signif-
icantly greater risk (OR 1.2 (95% CI, 1.0 to 1.5), P = 0.03)
(Figure 1). Importantly, 492 patients (42.1%) with isolated
hypoxemia were receiving deliberate decreases of FiO
2
to
<0.8 at the time of their hypoxemia. There was no statis-
tical evidence that patients with higher PaO
2
levels had
significantly greater risk of hospital mortality.
When the corresponding time period used by the
EMShockNet study group [6] (2001 to 2005) was consid-
ered, after adjustment (Additional file 1, Statistical appen-
dix, Model cluster 2), oxygenation was not predictive of
mortality (P = 0.16) (hyperoxia: OR 1.3 (95% CI, 0.9 to
1.8), P = 0.16; hypoxia: OR 1.3 (95% CI, 1.0 to 1.6), P =
0.06). When more detailed information was obtained from
a random sample of 100 patients, the worst PaO
2
value
over the first 24 hours was significantly more representa-
tive of mean PaO
2
than the first PaO
2
value measured
upon admission used by the EMShockNet study group [6].
This was true for the first 24 hours (Pearson’s r = 0.70 ver-
sus Pearson’s r = 0.50, P < 0.0001), the first 48 hours
(Pearson’s r = 0.63 versus Pearson’s r =0.38,P < 0.0001)
and the first 72 hours (Pearson’s r = 0.60 versus Pearson’s
r =0.34,P < 0.0001).
Table 3 Abnormal vital signs in the first 24 hours in intensive care unit and interventions
Vital signs (means ± SD) All patients
(N = 12,108)
Hypoxia/poor O
2
exchange
(n = 8,904)
Normoxia
(n = 1,919)
Hyperoxia
(n = 1,285)
Highest body temperature 37.1°C (1.5) 37.1°C (1.5) 37.1°C (1.4) 37.1°C (1.5)
Lowest body temperature 34.9°C (1.7) 34.9°C (1.7) 34.8°C (1.8) 34.7°C (1.7)
Highest heart rate, beats/min 108 (28) 109 (28) 104 (26) 108 (28)
Highest respiratory rate, breaths/min 22.0 (9.0) 22.2 (9.0) 21.4 (9.2) 21.4 (9.0)
Lowest systolic blood pressure, mmHg 88.6 (25.1) 87.3 (25.0) 94.1 (22.8) 88.9 (27.2)
Lowest mean arterial pressure, mmHg 62.3 (16.0) 61.5 (15.8) 66.2 (14.5) 62.5 (18.0)
Lowest glucose level first 24 hours 6.9 (3.9) 6.9 (4.0) 6.4 (3.1) 6.9 (3.6)
Body temperature, n (%)
Highest temperature <34°C 860 (7) 639 (7) 90 (5) 131 (10)
Lowest temperature <34°C 4031 (33) 2918 (33) 659 (34) 454 (35)
Table 4 Outcomes of study patients
Patient outcomes All patients
(N = 12,108)
Hypoxia/poor O
2
exchange
(n = 8,904)
Normoxia
(n = 1,919)
Hyperoxia
(n = 1,285)
In-hospital mortality
a
, n (%) (95% CI) 6,968 (58) (57 to 58) 5,303 (60) (59 to 61) 911 (47) (45 to 50) 754 (59) (56 to 61)
Discharge destination for survivors, n 5,140 3,601 1,008 531
Home
a
, n (%) (95% CI) 3,341 (28) (27 to 28) 2,350 (26) (25 to 27) 649 (34) (32 to 36) 342 (27) (24 to 29)
Rehabilitation facility 655 (5) 447 (5) 118 (6) 90 (7)
Transfer to another hospital 1,144 (9) 804 (9) 241 (13) 99 (8)
a
P < 0.0001 for comparisons of normoxia with hyperoxia and normox ia with hypoxia in patients discharged to home.
Bellomo et al. Critical Care 2011, 15:R90
/>Page 5 of 9
Discussion
Key findings
We conducted a large, multicen tre, cohort study of
patients admitted to ICUs in ANZ after resuscitation
from cardiac arrest to examine the relationship between
hyperoxia and patient outcome. We initially found that
hyperoxia was relatively uncommon and had only a
weak relationship with risk of death. This relationship
was significantly reduced by the addition o f illness
severity scores. In addition, once Cox proportional
hazards modelling of survival, sensitivity analyses using
deciles of hypoxemia, time period matching and defining
hyperoxia in keeping with experimental studies [10-13]
as PaO
2
> 400 mmHg, hyperoxia had no independent
association with mortalit y. Finally, after adjustment for
FiO
2
and relevant cova riates, PaO
2
was no longer pre-
dictive of hospital mortality. Thus, hyperoxia was rela-
tively uncommon, and it had no robust and consistently
reproducible independent relationship with mortality.
Comparison with other studies
Until very recently, concerns about the possible risks
associated with hyperoxia during and after recovery from
cardiac arrest were based on animal experiments [10-13].
In this regard, several experimental studies have sug-
gested that hyperoxia can increase oxidative stress [14],
induce more severe histopathological changes [10] and
worsen neurological injury [15]. On the other hand, two
studies have failed to confirm such findings [16,17], and
two other often-quoted major studies did not actually
assess animals after cardiac arrest [10,1 2]. Nonetheless,
despite the lack of human data, the International Liaison
Committee on Resuscitation moved to advocate the
avoidance of arterial hyperoxia. The committee instead
advocated the targeting of arterial oxygen saturation not
exceeding 94% to 96% [18]. In response to these issues,
in June 2010, the EMShockNet investigators reported
that, in a cohort of 6,326 USA patients who had survived
nontraumatic cardiac arrest and were admitted to the
ICU, hyperoxia was independently associated with
increased risk (OR 1.6) of in-hospital mortality. This was
the largest clinical study to date of the association
between hyperoxia after cardiac arrest and mortality. Our
findings should therefore be evaluated in direct compari-
son to the EMShockNet study and have been specifically
configured to facilitate such comparison.
Several important observations emerge from such
comparison. First, the baseline characteristics of the U.S.
and ANZ patients appear almost identical, although no
information was available on the APACHE scores for
Table 5 Multiple logistic regression model with in-
hospital mortality as dependent variable using
EMShockNet model variables
a
Variable OR (95%CI) P value
Acute renal failure 3.3 (2.9 to 3.7) <0.0001
Hypotension in first 24 hours
b
1.9 (1.7 to 2.0) <0.0001
Age, decile 1.1 (1.1 to 1.1) <0.0001
Emergency department origin 1.6 (1.4 to 1.7) <0.0001
High heart rate
c
1.5 (1.3 to 1.6) <0.0001
Hypoxia/poor O
2
exchange versus normoxia 1.4 (1.3 to 1.6) <0.0001
Hyperoxia versus normoxia 1.5 (1.3 to 1.8) <0.0001
Cancer 2.0 (1.5 to 2.5) <0.0001
Cirrhosis 2.2 (1.5 to 3.1) <0.0001
Female sex 1.2 (1.1 to 1.3) <0.0001
Chronic renal 1.4 (1.1 to 1.6) 0.001
Chronic respiratory disease 1.3 (1.1 to 1.5) 0.002
Hepatic failure 2.7 (1.3 to 5.9) 0.01
a
EMShockNet, Emergency Medicine Shock Research Net work; OR, odds ratio;
95% CI, 95% confidence interval. The following variables (OR (95% CI), P
value) were removed from the model for nonsignificance (P < 0.01):
immunosuppression (1.3 (1.0 to 1.7), P = 0.04), indigenous status (1.2 (0.9 to
1.5), P = 0.13), chronic cardiovascular disease (1.1 (0.9 to 1.2), P = 0.34),
chronic liver disease (0.6 (1.0 to 3.3), P = 0.56) and hospital source prior to
admission being from home (1.0 (0.9 to 1.1), P = 0.61).
b
Defined as any
systolic blood pressure of less than 90 mmHg in the first 24 hours;
c
indicates
highest value for first 24 hours in the intensive care unit (1 = exceeds median
and 0 = median or lower).
Table 6 Multiple regression models for in-hospital mortality and survival time using an APACHE III-based marker of
severity
a
Variable Hospital mortality
OR (95% CI)
P value Time to death
HR (95% CI)
P value
AP3no-ox
b
1.5 (1.5 to 1.6) <0.0001 1.2 (1.2 to 1.2) <0.0001
Treatment limitation
c
5.3 (3.8 to 7.2) <0.0001 1.7 (1.5 to 1.8) <0.0001
Year of admission 0.9 (0.9 to 0.9) <0.0001 0.97 (0.96 to 0.98) <0.0001
Lowest glucose in first 24 hours 1.1 (1.1 to 1.1) <0.0001 1.02 (1.02 to 1.03) <0.0001
Hospital admission from home 1.3 (1.1 to 1.4) 0.0002 1.1 (1.0 to 1.1) 0.02
Hypoxia/poor O
2
exchange versus normoxia 1.2 (1.1 to 1.4) 0.002 1.1 (1.0 to 1.2) 0.01
Hyperoxia versus normoxia 1.2 (1.0 to 1.5) 0.04 1.1 (1.0 to 1.2) 0.20
a
APACHE III, Acute Illness Severity and Chronic Health Evaluation III; OR, odds ratio; 95% CI, 95% confidence interval; HR, hazard ratio; AP3no-ox, APACHE III score
with oxygenation component removed;
b
APACHE III risk of death with oxygen component removed from calculation algorithm;
c
treatment limitation order or
palliative care coded for the patient. Indigenous status was removed from both models for nonsignificance (P < 0.01): (OR 1.3 (95% CI, 1.0 to 1.8), P = 0.04), (HR
1.1 (95% CI, 0.9 to 1.1) P = 0.89).
Bellomo et al. Critical Care 2011, 15:R90
/>Page 6 of 9
the USA cohort. Despite such similar ities, there were
striking differences in the lowest body temperature s
recorded (ANZ 34.9°C, USA 36°C). These differences
may reflect greater uptake of therapeutic hypothermia in
ANZ and make the observations from our cohort more
relevant to current recommended practice [4,5]. How-
ever, we cannot determine whether grea ter use of thera-
peutic hypothermia accounts for the difference in the
proportion of survivors discharged to home (65% in
ANZ as compared to 44% in the USA, approximately a
50% relative increase in favourable outcome).
In the ANZ cohort, hyperoxia occurred in only 10.6%
of patients as compared with 18% in the USA, and mor-
tality in the hyperoxic group was identical to that in the
hypoxia/poo r O
2
transfer group, instead of being much
greater. Importa ntly, the relationship between hyperoxia
and in-hospital mortality appeared much weaker using
the same modelling used by the EMShockNet investiga-
tors. E ven more importantly, this relat ionship could not
be confirmed when a different threshold for hyperoxia
was applied w hich mimicked that reported in experi-
mental studies [11-13] (rather than using a seemingly
arbitrary cutoff point of 300 mmHg), when a Cox pro-
portiona l hazards model was used, when PaO
2
was split
into deciles, when FiO
2
was taken into account or when
the same time period (2000 to 2005) was used for analy-
sis. In the ag gregate, these observ ations suggest that the
relationship between hyperoxia and mortality is depen-
dent on the individual healthcare system, the statistical
model used, the time period examined and the defini-
tions used. Such features are not consistent with a
robust and reproducible biological phenomenon.
Study significance
Our findings imply that it is incorrect and premature to
conclude that hyperoxia is an independent risk factor for
mortality in patients resuscitated from nontraumatic car-
diac arrest. In particular, we contend that hyperoxia
implies the administration of high FiO
2
fractions, making
it more likely for hyperoxia to actually be a marker of ill-
ness severity than a biological t oxin. This notion is sup-
ported by the significant decrease in ORs for morta lity
once APACHE scores were added to the model and the
disappearance of significant ORs once FiO
2
was added to
the model. Moreover, the definition of ‘hypoxia’ used by
the EMShockNet investigators (reproduced here to facili-
tate comparison under the term ‘hypoxia/poor O
2
trans-
fer’) included patients with a P/F ratio <300, together with
patients with PaO
2
< 60 mmHg. This approach conflates
physiologically relevant lack of oxygen at the tissue level
(true hypoxia) with a gas tran sfer problem. When we
examined isolated hypoxemia (PaO
2
< 60 mmHg), we
found that it was nearly as frequent as hyperoxia. The
risks of cerebral injury associated with hypoxemia are well
known [19-21], and hypoxemic patients in our cohort had
particularly poor outcomes. Importantly, after adjustment
for FiO
2
and relevant covariates, PaO
2
was no longer pre-
dictive of hospital mortality. These observations suggest
that the association seen in the models that do not include
FiO
2
may simply reflect the fact that hyperoxia is an indir-
ect marker of higher FiO
2
(that is, the higher the FiO
2
, the
greater the PaO
2
)andthatahigherFiO
2
is a marker of ill-
ness severity (that is, the sicker the patient is perceived to
be, the greater the FiO
2
administered in an emergency
situation). However, the link between FiO
2
and outcome is
independent of APACHE score. Thus, FiO
2
cannot be
considered simply a marker of disease severity. The physi-
cian can lower PaO
2
and FiO
2
levels at the same time and
avoid inducing hyperoxia. Only interventional studies can
clarify whether the association between oxygenation and
outcome is truly a causal relationship.
All the above observations ha ve potential clinical rele-
vance. For example, emergency responders may not
have access to pulse oximetry or blood gas analysis, or
such techniques may be unreliable immediately follow-
ing cardiac arrest because of decreased peripheral perfu-
sion. If fear of hyperoxia led emergency responders, in
the absence of adequate monitoring, to limit FiO
2
levels,
logically more people wouldlikelybeexposedtothe
risk of hypoxemia. In our study, >40% of patients with
hypoxemia might have had correction of their hypoxe-
mia had a higher FiO
2
level been induced. Thus, if con-
cerns about the alleged ill effects o f hyperoxia or high
Figure 1 Odds ratios for hospital mortalit y by deciles of PaO
2
.
Odds ratios for hospital mortality with partial pressure of arterial
oxygen (PaO
2
) divided into deciles and referenced against the
fourth decile (PaO
2
, 83 to 93). The adjusted model included the
following covariates: fraction of inspired oxygen (deciles), Acute
Physiology and Chronic Health Evaluation III (APACHE III) index of
illness severity in which the oxygen component of the APACHE III
scoring system was removed, year of admission, treatment
limitation on admission to intensive care unit, patient’s lowest
glucose level in the first 24 hours, hospital characteristics, patient
indigenous status and hospital source from home. 95% CI, 95%
confidence interval.
Bellomo et al. Critical Care 2011, 15:R90
/>Page 7 of 9
FiO
2
administration were taken into the clinical arena to
avoid a condition whose association with mortality is
uncertain, more pa tients might be exposed to a condi-
tion whose adverse cerebral effects are well established.
Given our findings, we c ounsel against implementing
poli cies of deliberately induced decreases in FiO
2
unless
accurate continuous pulse oximetry monitoring is in
place. Importantly, in no way do we advocate, promote
or justify hyperoxia in this setting. However, lowering
FiO
2
is justified only if good transcutaneous or arterial
oxygenation monitoring is available.
Strengths and limitations
This study has several strengths. It involved more than
12,000 patients from 125 ICUs in two countries, making
it the largest study of its type conducted so far and mak-
ing its findings reflective of all ICUs in ANZ [22,23]. It
included a multifaceted assessment of the independent
relationship between hyperoxia and outcome using mul-
tiple models and adjusting for illness severity. However,
like other studies of association using a large database, it
is limited by the nature of the data available and by the
fact that no causal inferences can be drawn. The assess-
ment of oxygenation status in the first 24 hours was
based on the ‘worst ’ possible arterial blood gas result,
while the EMShockNet study used the ‘first’ ICU arterial
blood gas measurement for evaluation. Thus, patients
may have been exposed to hyperoxia and may not have
been identified in our study. However, using a random
sample of 100 patients, we found that the measurement
used in our study was more closely representative of
overall mean oxygenation status in ICU patients during
the first 24 to 48 hours after admission (when reperfusion
injury occurs) than the first set of blood gas measure-
ments obtained in the ICU. In our study, data were miss-
ing for only 5.4% of patients compared with 27.6% in the
EM ShockNet study, making selection bias in our study
less likely. One-third of patients had a lowest body tem-
perature <34°C. Clinical knowledge (confirmed by the
EMShockNet data) that such severe spontaneous
hypothermia is uncommon suggests that many patients
were therefore treated with induced hypothermia as is
common in ANZ [24-28]. T his finding distinguishes our
study from the US investigation because it is in keeping
with current recommendations. Unfortunately, however,
our database do es not enable us to identify whic h
patients had induced versus spontaneous hypothermia.
Finally, we are unable to comment on the causes of death
or consider other potential confounding variables that
were not collected as part of the ANZICS-APD.
Future studies
More investigations appear necessary, perhaps using
other national datab ases [29]. Pros pective investigations
with focused data collection are also needed. If such stu-
dies confirmed a postive association, interventional stra-
tegies should be tested; if not, interventional studies
would not seem justified.
Conclusions
In a large, multicentre, cohort study of patients admitted
to the ICU after resuscitation from cardiac arrest, we
found that hyperoxia was relatively uncommon. On the
basis of in itial multivariable analysis, it had only a weak
independent relationship with mortality. This relation-
ship could not be confirmed on the basis of sensitivity
analysis, adjusted Cox proportional hazards modelling,
after taking FiO
2
into account or after adjusting for time
period, making it unlikely that it represents a reproduci-
ble biological phenomenon. Our findings support argu-
ments against implementing policies of deliberate
decreases in FiO
2
unless accurate and reliable pulse oxi-
metry monitoring is available.
Key messages
• When the worst set of arterial blood gases is used
for a ssessment, hyperoxia is uncommon in the first
24 hours after ICU admission in patients resusci-
tated from cardiac arrest.
• Using the same approach, isolated hypoxemia is
just as common.
• Hyperoxia in these patients has a weak, model-
dependent and nonreproducible association with
mortality.
• Unless accurate and reliable pulse oximetry is
available to prevent hypo xemia, a policy of reducing
FiO
2
to avoid possible hyperoxia is not justified and
may not be prudent.
Additional material
Additional file 1: Statistical appendix with details of multiple
statistical models linking oxygen status with outcome.
Abbreviations
ANZ: Australia and New Zealand; ANZICS: Australian and New Zealand
Intensive Care Society; APACHE III: Acute Physiology and Chronic Health
Evaluation III; CORE: Centre for Outcomes and Resource Evaluation; FiO
2
:
inspired fraction of oxygen; PaO
2
: arterial oxygen tension.
Acknowledgements
We thank all data collectors in the 125 participating ICUs in Australia and New
Zealand for their collection of high-quality data that made this study possible.
Three of the investigators (MB, RB, DJC) are supported in part by an enabling
grant from the Australian National Health and Medical Research Council.
Author details
1
Australian and New Zealand Intensive Care Research Centre, School of
Public Health and Preventive Medicine, Monash University, 5 Commercial
Road, Prahran, Melbourne, Victoria 3181, Australia.
2
Australia New Zealand
Intensive Care Society (ANZICS) Clinical Outcomes and Resource Evaluation
(CORE) Centre, 10 Ievers Terrace, Carlton, Melbourne, Victoria 3053, Australia.
Bellomo et al. Critical Care 2011, 15:R90
/>Page 8 of 9
3
Department of Intensive Care, Austin Hospital, 145 Studley Road,
Heidelberg, Melbourne, Victoria 3084, Australia.
4
Department of
Anesthesiology and Resuscitology, Okayama University Medical School, 5-1
Shikata-Cho 2-Chome, Okayama 700-8558, Okayama, Japan.
Authors’ contributions
RB conceived the study in conjunction with the other authors and wrote
the initial draft of the manuscript. MB conceived the study in conjunction
with the other authors and performed the statistical analysis. GME conceived
the study in conjunction with the other authors and reviewed and modified
the final manuscript. AN conceived the study in conjunction with the other
authors and reviewed and modified the final manuscript. DP conceived the
study in conjunction with the other authors and reviewed and modified the
final manuscript. GKH conceived the study in conjunction with the other
authors and reviewed and modified the final manuscript. MCR conceived
the study in conjunction with the other authors and reviewed and modified
the final manuscript. ME assisted with the study and obtained and provided
information on arterial blood gases in a selected cohort of cardiac arrest
patients. DJC conceived the study in conjunction with the other authors and
reviewed and modified the final manuscript.
Competing interests
The authors declare that they have no competing interests.
Received: 3 November 2010 Revised: 2 January 2011
Accepted: 8 March 2011 Published: 8 March 2011
References
1. Peberdy MA, Kaye W, Ornato JP, Larkin GL, Nadkarni V, Mancini ME,
Berg RA, Nichol G, Lane-Trultt T: Cardiopulmonary resuscitation of adults
in the hospital: a report of 14720 cardiac arrests from the National
Registry of Cardiopulmonary Resuscitation. Resuscitation 2003, 58:297-308.
2. Stiell IG, Wells GA, Field B, Spaite DW, Nesbitt LP, De Maio VJ, Nichol G,
Cousineau D, Blackburn J, Munkley D, Luinstra-Toohey L, Campeau T,
Dagnone E, Lyver M, Ontario Prehospital Advanced Life Support Study
Group: Advanced cardiac life support in out-of-hospital cardiac arrest. N
Engl J Med 2004, 351:647-656.
3. Negovsky VA: The second step in resuscitation: the treatment of the
‘post-resuscitation disease’. Resuscitation 1972, 1:1-7.
4. Bernard SA, Gray TW, Buist MD, Jones BM, Silvester W, Gutteridge G,
Smith K: Treatment of comatose survivors of out-of-hospital cardiac
arrest with induced hypothermia. N Engl J Med 2002, 346:557-563.
5. Hypothermia after Cardiac Arrest Study Group: Mild therapeutic
hypothermia to improve the neurologic outcome after cardiac arrest. N
Engl J Med 2002, 346:549-563.
6. Kilgannon JH, Jones AE, Shapiro NI, Angelos MG, Milcarek B, Hunter K,
Parrillo JE, Trzeciak S, Emergency Medicine Shock Research Network
(EMShockNet) Investigators: Association between arterial hyperoxia
following resuscitation from cardiac arrest and in-hospital mortality.
JAMA 2010, 303 :2165-2171.
7. Stow PJ, Hart GK, Higlett T, George C, Herkes R, McWilliam D, Bellomo R, for
the ANZICS Database Management Committee: Development and
implementation of a high-quality clinical database: the Australian and
New Zealand Intensive Care Society Adult Patient Database. J Crit Care
2006, 21:133-141.
8. Knaus WA, Wagner DP, Draper EA, Zimmerman JE, Bergner M, Bastos PG,
Sirio CA, Murphy DJ, Lotring T, Damiano A, et al: The APACHE III
prognostic system. Risk prediction of hospital mortality for critically ill
hospitalized adults. Chest 1991, 100:1619-1636.
9. D’Agostino RB Jr: Propensity scores in cardiovascular research. Circulation
2007, 115:2340-2343.
10. Douzinas EE, Patsouris E, Kypriades EM, Makris DJ, Andrianakis I,
Korkolopoulou P, Boursinos V, Papalois A, Sotiropoulou C, Davaris P,
Roussos C: Hypoxaemic reperfusion ameliorates the histopathological
changes in the pig brain after a severe global cerebral ischaemic insult.
Intensive Care Med 2001, 27:905-910.
11. Balan IS, Fiskum G, Hazelton J, Cotto-Cumba C, Rosenthal RE: Oximetry-
guided reoxygenation improves neurological outcome after
experimental cardiac arrest. Stroke 2006, 37:3008-3013.
12. Douzinas EE, Andrianakis I, Pitaridis MT, Karmpaliotis DJ, Kypriades EM,
Betsou A, Gratsias Y, Sotiropoulou C, Papalois A, Roussos C: The effect of
hypoxemic reperfusion on cerebral protection after a severe global
ischemic insult. Intensive Care Med 2001, 27:269-275.
13. Richards EM, Fiskum G, Rosenthal RE, Hopkins I, McKenna MC: Hyperoxic
reperfusion after global ischemia decreases hippocampal energy
metabolism. Stroke 2007, 38:1578-1584.
14. Liu Y, Rosenthal RE, Haywood Y, Miljkovic-Lolic M, Vanderhoek JY, Fiskum G:
Normoxic ventilation after cardiac arrest reduces oxidation of brain
lipids and improves neurological outcome. Stroke 1998, 29:1679-1686.
15. Zwermer CF, Whitesall SE, D’Alecy LG: Cardiopulmonary-cerebral
resuscitation with 100% oxygen exacerbates neurological dysfunction
following nine minutes of normothermic cardiac arrest in dogs.
Resuscitation 1994, 27:159-170.
16. Zwermer CF, Whitesall SE, D’Alecy LG: Hypoxic cardiopulmonary-cerebral
resuscitaiton fails to improve neurological outcome following cardiac
arrest in dogs. Resuscitation 1995, 29:225-236.
17. Lipinski CA, Hicks SD, Callaway CW: Normoxic ventilation during
resuscitation and outcome from asphyxial cardiac arrest in rats.
Resuscitation 1999, 42:221-229.
18. Neumar RW, Nolan JP, Adrie C, Aibiki M, Berg RA, Böttiger BW, Callaway C,
Clark RS, Geocadin RG, Jauch EC, Kern KB, Laurent I, Longstreth WT Jr,
Merchant RM, Morley P, Morrison LJ, Nadkarni V, Peberdy MA, Rivers EP,
Rodriguez-Nunez A, Sellke FW, Spaulding C, Sunde K, Vanden Hoek T: Post-
cardiac arrest syndrome: epidemiology, pathophysiology, treatment, and
prognostication. A consensus statement from the International Liaison
Committee on Resuscitation (American Heart Association, Australian and
New Zealand Council on Resuscitation, European Resuscitation Council,
Heart and Stroke Foundation of Canada, InterAmerican Heart
Foundation, Resuscitation Council of Asia, and the Resuscitation Council
of Southern Africa); the American Heart Association Emergency
Cardiovascular Care Committee; the Council on Cardiovascular Surgery
and Anesthesia; the Council on Cardiopulmonary, Perioperative, and
Critical Care; the Council on Clinical Cardiology; and the Stroke Council.
Circulation 2008, 118:2452-2483.
19. Tsui SS, Schultz JM, Shen I, Ungerleider RM: Postoperative hypoxemia
exacerbates potential brain injury after deep hypothermic circulatory
arrest. Ann Thorac Surg 2004, 78:188-196.
20. Martin LJ, Brambrink AM, Lehmann C, Portera-Cailliau C, Koehler R,
Rothstein J, Traystman RJ: Hypoxia-ischemia causes abnormalities in
glutamate transporters and death of astroglia and neurons in newborn
striatum. Ann Neurol 1997, 42:335-348.
21. Stahel PF, Smith WR, Moore EE: Hypoxia and hypotension, the “lethal
duo” in traumatic brain injury: implications for prehospital care. Intensive
Care Med 2008, 34:402-404.
22. ANZIC Influenza Investigators: Critical care services and 2009 H1N1
influenza in Australia and New Zealand. N Engl J Med 2009,
361:1925-1934.
23. Webb SA, Seppelt IM, ANZIC Influenza Investigators: Pandemic (H1N1)
2009 influenza ("swine flu”) in Australian and New Zealand intensive
care. Crit Care Resusc 2009, 11:170-172.
24. Whitfield AM, Coote S, Ernest D: Induced hypothermia after out of hospital
cardiac arrest: one hospital’s experience. Crit Care Resusc 2009, 11
:97-100.
25. Jones DA: Management of cardiac arrest patients in the ICU: is keeping
a cool head the standard of care? Crit Care Resusc 2009, 11:91-93.
26. Moran JL, Peake SL, Solomon P: Hypothermia as therapy in cerebral
injury. Crit Care Resusc 2002, 4:86-92.
27. Bernard SA: Hypothermia improves outcome from cardiac arrest. Crit Care
Resusc 2005, 7:325-327.
28. Bernard SA, Smith K, Cameron P, Masci K, Taylor DM, Cooper DJ, Kelly AM,
Silvester W, Rapid Infusion of Cold Hartmanns (RICH) Investigators:
Induction of therapeutic hypothermia by paramedics after resuscitation
from out-of-hospital ventricular fibrillation cardiac arrest: a randomized
controlled trial. Circulation 2010, 122:737-742.
29. Harrison DA, Rowan KM: Outcome prediction in critical care: the ICNARC
model. Curr Opin Crit Care 2008, 14:506-512.
30. Halpern NA, Pastores SM, Thaler HT, Greenstein RJ: Changes in critical care
beds and occupancy in the United States 1985-2000: Differences
attributable to hospital size. Crit Care Med 2006, 34:2105-2112.
doi:10.1186/cc10090
Cite this article as: Bellomo et al.: Arterial hyperoxia and in-hospital
mortality after resuscitation from cardiac arrest. Critical Care 2011 15:R90.
Bellomo et al. Critical Care 2011, 15:R90
/>Page 9 of 9