Báo cáo y học: " Revealing signaling pathway deregulation by using gene expression signatures and regulatory motif analysis" ppt
Bạn đang xem bản rút gọn của tài liệu. Xem và tải ngay bản đầy đủ của tài liệu tại đây (452.7 KB, 10 trang )
Genome Biology 2007, 8:R77
comment reviews reports deposited research refereed research interactions information
Open Access
2007Liu and RingnérVolume 8, Issue 5, Article R77
Method
Revealing signaling pathway deregulation by using gene expression
signatures and regulatory motif analysis
Yingchun Liu
*
and Markus Ringnér
†
Addresses:
*
Computational Biology and Biological Physics, Department of Theoretical Physics, Lund University, SE-221 85, Sweden.
†
Division
of Oncology, Department of Clinical Sciences, Lund University, SE-221 85, Sweden.
Correspondence: Markus Ringnér. Email:
© 2007 Liu and Ringnér; licensee BioMed Central Ltd.
This is an open access article distributed under the terms of the Creative Commons Attribution License ( which
permits unrestricted use, distribution, and reproduction in any medium, provided the original work is properly cited.
Revealing signaling pathway deregulation<p>A strategy for identifying cell signaling pathways whose deregulation result in an observed expression signature is presented.</p>
Abstract
Gene expression signatures consisting of tens to hundreds of genes have been found to be
informative for different biological states. Recently, many computational methods have been
proposed for biological interpretation of such signatures. However, there is a lack of methods for
identifying cell signaling pathways whose deregulation results in an observed expression signature.
We present a strategy for identifying such signaling pathways and evaluate the strategy using six
human and mouse gene expression signatures.
Background
Genetic aberrations and variations in cellular processes are
usually reflected in the expression levels of many genes.
Hence, such alterations can potentially be characterized by
their gene expression profiles. Gene expression profiling, in
particular DNA microarray analysis, has been widely used in
attempts to reveal the underlying mechanisms of many dis-
eases, different developmental stages, cellular responses to
different conditions, and many other biological phenomena
(for example, [1-3]). Gene expression signatures consisting of
tens to hundreds of genes have been associated with many
important aspects of the systems studied. To help realize the
full potential of gene expression studies, a variety of methods,
such as GenMAPP [4], GoMiner [5], DAVID [6] and its desk-
top version EASE [7], Catmap [8], ArrayXPath [9], and Gene
Set Enrichment Analysis (GSEA) [10], have been developed to
relate gene expression profiles or signatures to a broad range
of biological categories. Although some of these methods
include signaling pathways in their categories, their focus has
not been on regulatory mechanisms that control the observed
gene expression changes.
Signal transduction is at the core of many regulatory systems.
Cellular functions such as growth, proliferation, differentia-
tion, and apoptosis are regulated by signaling pathways.
Appropriate regulation of such pathways is essential for the
normal functioning of cells. Cells affected by disease often
have one or several signaling pathways abnormally activated
or inactivated. For example, cancer is a disease of deregulated
cell proliferation and death [11]. To uncover mechanisms
underlying cellular phenotypes, therefore, it is crucial to sys-
tematically analyze gene expression signatures in the context
of signaling pathways. In signal transduction, ligands, usually
from outside the cell, interact with receptors on the surface of
the cell membrane or with nuclear receptors. These interac-
tions trigger a cascade of biochemical reactions. Proteins
called transcription factors (TFs) and cofactors are eventually
transported to, or activated in, the nucleus of the cell where
they turn transcription of target genes on or off. A signaling
pathway is composed of a set of molecular components con-
veying the signal, such as ligands, receptors, enzymes, TFs,
and cofactors.
Published: 11 May 2007
Genome Biology 2007, 8:R77 (doi:10.1186/gb-2007-8-5-r77)
Received: 6 October 2006
Revised: 19 April 2007
Accepted: 11 May 2007
The electronic version of this article is the complete one and can be
found online at />R77.2 Genome Biology 2007, Volume 8, Issue 5, Article R77 Liu and Ringnér />Genome Biology 2007, 8:R77
When a pathway is activated, the expression levels of the
components of the pathway are not necessarily affected. For
example, mutation of a TF can change the expression levels of
its target genes, without necessarily affecting the expression
levels of the TF itself or other components of the pathway.
Also, pathway components might not be regulated at the tran-
scriptional level; instead, they are often regulated post-trans-
lationally, for example, by phosphorylation. Proteomic data
could be used to detect such modifications and be used for
pathway analysis, but currently there is a lack of such
genome-wide protein data. It has beenpointed out that gene
expression signatures may be more reliable indicators of
pathway activities than protein data for single components in
signaling pathways [12]. Taking all these considerations into
account, we reason that the activity of a signaling pathway
may currently be best characterized by the expression levels
of its target genes. In support of this hypothesis, Breslin et al.
[13] have shown the capacity of expression levels of known
target genes to reflect pathway activities. However, knowl-
edge about target genes of TFs is far from complete, which
hampers accurate prediction of pathway activities. On the
other hand, the cis-regulatory motifs to which TFs bind are
often better characterized. For organisms with sequenced
genomes, these motifs enable genome-wide identification of
putative target genes by looking for potential TF binding sites
in promoter sequences. Therefore, integrating regulatory
motif analysis with pathway information would be a potential
approach to break this bottleneck for pathway analysis.
Recently, the feasibility ofusing putative binding sites to iden-
tify TFs responsible for gene expression signatures of human
cancer has been demonstrated [14].
Here we present a strategy to discover activated and inacti-
vated signaling pathways from gene expression signatures by
using regulatory motif analysis (Figure 1). To achieve this
goal, we began by extracting all signaling pathways in the
TRANSPATH database [15], and characterized each pathway
by the TFs that mediate it. In all human and mouse promoter
sequences, we identified putative binding sites of all the TFs
mediating pathways using TF binding site position weight
matrices from the TRANSFAC database [16]. Next, we inves-
tigated promoters of genes in gene expression signatures for
an enrichment of these putative binding sites. Finally, we
measured the activity of a pathway in a gene expression sig-
nature in terms of the enrichment of binding motifs for the
TFs mediating the pathway. Although the use of putative TF
binding sites will introduce false-positive target genes for
each TF, when the promoters of a set of co-expressed genes
are enriched for a putative TF binding site, the gene set is also
likely enriched for true target genes. Moreover, our strategy
to integrate regulatory motif analysis with knowledge about
which TFs act together in pathways further reduces the influ-
ence of false-positive targets on the identification of
pathways.
Our results for six human and mouse gene expression signa-
tures demonstrate the power of our method to identify rele-
vant pathways. We compared our results with those obtained
using two widely used methods for relating gene expression
profiles to biological categories, EASE [7] and GSEA [10]. For
data sets with known pathways activated, we found that our
strategy identified the expected pathways whereas EASE and
GSEA did not. Hence, our strategy provides additional infor-
mation complementary to what can be obtained using current
methods for biological interpretation of gene expression data.
Results and discussion
Gene signatures for oncogenic pathways
To examine the ability of our method to accurately detect the
activity of pathways, we obtained gene signatures for three
oncogenic pathways produced by Bild et al. [17]. These signa-
tures consist of genes for which the expression levels in
human mammary epithelial cells were highly correlated with
the activation status of the oncogenes encoding E2F3 (268
genes), Myc (218 genes), or Ras (304 genes), respectively.
These three oncogenic pathways are often activated in solid
tumors, including breast tumors, where they contribute to
tumor development or progression. Bild et al. verified the
activation status of each pathway using various biochemical
measurements and demonstrated that the expression pat-
terns in each signature were specific to each pathway. Hence,
these signatures are ideal for evaluating our strategy to iden-
tify activated pathways. The statistically significant pathways
identified by our method for the three gene signatures are
shown in Table 1.
The E2F pathway was extremely significant for the E2F3 gene
signature. E2F3 is a member of the E2F TF family (E2Fs).
E2Fs can induce cell cycle G1 to S transition and activate
many genes encoding proteins essential for DNA replication
[18,19]. E2F1, another member of the E2Fs, can form dimers
with DP-1, making this activation more efficient [20]. Our
method identified both E2F1 (P < 0.001) and DP-1 (P <
0.001) as significant TFs for this signature.
TRANSPATH does not contain a strictly defined Myc path-
way, but it includes three pathways containing c-Myc as a TF:
the epidermal growth factor (EGF), Notch, and mitogen-acti-
vated protein kinase (MAPK) pathways. We identified c-Myc
as a significant TF for this signature (P < 0.001), and both the
EGF and the Notch pathways were found to be significant.
The MAPK pathway was not found to be significant. The only
significant TF found for the MAPK pathway was c-Myc, per-
haps suggesting that induction of c-Myc is not sufficient to
deregulate this pathway. Consistent with this suggestion, it
has been shown that elevated c-Myc expression is not suffi-
cient for tumorigenesis in human mammary epithelial cells
[21]. Interestingly, we also found the hypoxia-inducible path-
way HIF-1 significant. Studies have shown that HIF-1 is acti-
vated in many tumors, including breast cancer [22], as a
Genome Biology 2007, Volume 8, Issue 5, Article R77 Liu and Ringnér R77.3
comment reviews reports refereed researchdeposited research interactions information
Genome Biology 2007, 8:R77
consequence of a shortage in oxygen supply during sustained
tumor growth. Moreover, it has been reported that HIF-1α
counteracts Myc to induce cell cycle arrest, and HIF-1α down-
regulates Myc-activated genes [23].
In the analysis of the Ras gene signature, we found the MAPK
and p38 pathways to be significantly relevant. This finding is
consistent with the fact that Ras activates MAPKs, including
ERK and p38. It has been shown in human fibroblasts that a
sustained high intensity Ras signal induces increased expres-
sion of MEK and ERK, eventually resulting in stimulation of
the p38 pathway [24] and that the p38 pathway provides neg-
ative feedback for Ras proliferation [25]. Several of the path-
ways we found to be significant contained nuclear factor
(NF)-κB as a significant TF (P = 0.002), including the recep-
tor activator of NF-κB (RANK) and tumor necrosis factor-α
pathways. It has been shown that NF-κB has an essential role
in breast cancer progression, and activation of NF-κB signal-
ing is especially required for the epithelial-mesenchymal
transition in Ras-transformed epithelial cells [26]. We identi-
fied the stress pathway as affected, perhaps only because this
pathway overlaps the p38 pathway. Also, we identified the
TLR3 and TLR4 pathways as responsive to Ras stimulation. A
recent study has shown that toll-like receptors (TLRs) are
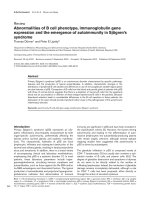
Overview of the method used to reveal pathways deregulated in gene expression signaturesFigure 1
Overview of the method used to reveal pathways deregulated in gene expression signatures. (a) Information was retrieved and integrated from four
sources: TRANSPATH, TRANSFAC, UniGene, and the UCSC Genome Browser. (b) Putative TF binding sites in promoter regions were identified using
MotifScanner. Enrichment of putative transcription binding sites among genes in a gene signature was assessed using a binomial test. Each pathway was
scored in terms of an enrichment for putative binding sites for the TFs mediating the pathway. The significance of a pathway's relevance for a gene
signature was assessed by using randomly selected gene sets from the genome.
ESR1
NAT2
13,950 human RefSeq and
13,477 mouse RefSeq
1-kb promoter sequences
47 signal transduction pathways
182 pathway transcription factor
position weight matrices
(a) Information retrieval
(b) Pathway deregulation
analysis procedure
Gene expression signature
Identification of putative
transcription factor binding sites
MotifScanner
Pathways deregulated
in the gene expression signature
Expected:
Randomly selected
gene sets
Observed:
Gene expression
signature
Pathway activity score analysis
Statistical analysis of binding sites
Binomial test
TRANSPATH
62 signal transduction pathways
58 pathway transcription factors
TRANSFAC
569 vertebrate transcription
factor position weight matrices
UniGene
86,820 human clusters
66,224 mouse clusters
UCSC Genome
Browser
R77.4 Genome Biology 2007, Volume 8, Issue 5, Article R77 Liu and Ringnér />Genome Biology 2007, 8:R77
expressed in a variety of tumors and trigger tumor self-pro-
tection mechanisms [27], making it plausible that they are
induced by Ras activation.
In addition to those pathways affected specifically for an
oncogenic activation signature, the caspases pathway was
found to be significantly affected for all three signatures. The
caspases pathway triggers cell death. Because evasion of cell
death is essential for tumor development [11], it is likely that
this pathway is repressed regardless of which of the onco-
genes is activated. Indeed, it has been indicated that over-
expression of E2F3 or Ras induces tumor invasion through
interaction with AP-2α, a characteristic TF in the caspases
pathway, in epithelial cells of bladder cancer [28]. It has also
been shown that c-Myc represses AP-2α trans-activation
[29]. Another pathway found to be affected for more than one
signature was the AhR pathway, which was found to be signif-
icant for both the Myc and Ras gene signatures. It has been
demonstrated that the AhR TF is constitutively active at high
levels in mammary tumors compared to in normal mammary
glands, suggesting that it contributes to ongoing mammary
tumor cell growth [30]. For all identified significant path-
ways, a total of 19 significant TFs were found. Of these, only
AP-2α was significant for all three signatures and only AhR,
Sp1, and NF-κB were significant for two signatures. These
small overlaps show that we do not find the same set of TFs
for each signature and verify the conclusion of Bild et al. [17]
that the signatures are specific to each pathway. Taken
together, our results for these three oncogenic gene signa-
tures demonstrate the power of our method to accurately
identify the known active pathways. Moreover, we found
additional pathways known to be relevant for each oncogenic
pathway. These results highlight the potential of our method
to generate hypotheses for connections between pathways.
We also looked into pathway activities for each oncogenic sig-
nature by analyzing the up-regulated and down-regulated
genes separately. Each oncogenic signature was divided into
two signatures, one containing the up-regulated and one con-
taining the down-regulated genes. For the up-regulated
signatures we obtained essentially the same result as for the-
original signatures containing both up- and down-regulated
genes. In contrast, very few significant pathways were found
for the down-regulated signatures, likely because these signa-
tures contained very few genes. For example, there were only
32 genes found to be down-regulated by E2F3. Suchsmall
numbers do not allow for a detailed analysis of whether our
method would benefit from analyzing up- and down-regu-
lated genes separately. In the following analysis, we have used
signatures containing both up- and down-regulated genes for
our method.
Gene signatures for the TGF-β pathway
Sets of genes claimed to belong to a gene signature are often
sensitive tosample selection and have small overlaps in differ-
ent studies [31,32]. This issue has raised debate about the
Table 1
Significant pathways for oncogenic gene signatures
Pathway TFs Significant TFs P value
E2F3 gene signature
E2F DP-1, E2F, p53 DP-1, E2F <0.001
Caspases CREB, Max, SRF, p53, AP-2α AP-2α <0.001
Myc gene signature
AhR AhR, ER-α, Sp1, p300, NF-κB, Arnt AhR, Sp1, NF-κB, Arnt <0.001
HIF-1 p53, p300, HIF-1α, HNF-4α2, Arnt HIF-1α, Arnt <0.001
Notch Max, LEF-1, p300, c-Myc Max, c-Myc <0.001
EGF c-Fos, Elk-1, Sp1, STAT3, c-Jun, STAT1α, c-Myc Sp1, c-Myc 0.002
Caspases CREB, Max, SRF, p53, AP-2α Max, AP-2α 0.002
c-Kit MITF, Sp1, Tal-1, p300, GATA-1 MITF, Sp1, Tal-1 0.006
Ras gene signature
AhR AhR, ER-α, Sp1, p300, NF-κB, Arnt Sp1, NF-κB <0.001
Apoptosis p53, FOXO3a, NF-κBp53, NF-κB0.001
Caspases CREB, Max, SRF, p53, AP-2α CREB, p53, AP-2α 0.004
RANK MITF, PU.1, c-Jun, NF-κBPU.1, NF-κB0.008
TNFα AP-1, NF-κB AP-1, NF-κB0.009
TLR4 CREB, CRE-BP2, STAT1, Elk-1, p300, IRF-3, IRF-7, NF-κB CREB, CRE-BP2, NF-κB0.015
MAPK CREB, Elk-1, p53, c-Jun, c-Myc CREB, p53 0.023
TLR3 CRE-BP2, p300, c-Jun, IRF-3, IRF-7, NF-κBCRE-BP2, NF-κB0.034
p38 ELk-1, p53, MITF, PPAR-α, CHOP-10, Max, CREB, PU.1, MRF4, HNF-1α, CRE-BP2, NF-
AT2, STAT3
p53, PPAR-α, CHOP-10, CREB, PU.1, CRE-BP2 0.035
Stress PPAR-γ, c-Ets-1, PPAR-α, Max, NF-AT2, HSF1, c-Jun, Elk-1, p53, CHOP-10, CREB, CRE-
BP2, RXR-α, HNF-1α, STAT3, MRF4
PPAR-α, p53, CHOP-10, CREB, CRE-BP2 0.037
Genome Biology 2007, Volume 8, Issue 5, Article R77 Liu and Ringnér R77.5
comment reviews reports refereed researchdeposited research interactions information
Genome Biology 2007, 8:R77
credibility of such signatures. A possible explanation for
small overlaps is that there may be redundancy in expression
profiles; many gene sets are equally good at distinguishing a
phenotype of interest. In this case, gene sets with small over-
laps may still arise from activation or repression of identical
pathways.
To validate our method as a guide to pathway analysis in this
regard, we analyzed target genes of the transforming growth
factor (TGF)-β pathway from two independent studies. One
data set contains 360 genes identified by comparing expres-
sion profiles of murine embryonic fibroblast(MEF) cells defi-
cient in Smad2, Smad3, or MAPK ERK, which are mediators
ofTGF-β signaling, with those of wild-type MEFs in response
to 1, 2, or 4 hours of TGF-β stimulation [33]. The other data
set contains 465 targets differentially expressed between
MEFs with the TGF-β receptor Alk5 knocked out and wild-
type MEFs stimulated with TGF-β for 2, 4, or 16 hours [34].
Whereas there are only 29 genes in common for the two data
sets, manyof the active pathways we found are the same
(Table 2). In particular, all five pathways with P < 0.001 for
the Karlsson et al. [34] data set also have P < 0.001 for the
Yang et al. [33] data set. We identified the TGF-β pathway as
significant for the Yang et al. target genes, but not forthe
Karlsson et al. genes. This discrepancy is possibly due to the
different durations of TGF-β stimulation in the two experi-
ments. Yang at al. reported that Smad3/Smad4 binding
motifs are present only in immediate-early target genes but
not in the intermediate ones [33]. The lack of an overabun-
dance of genes containing Smad binding motifs in the Karls-
son et al. data set suggests that it consists of intermediate or
late response genes. A targetgene of TGF-β signaling is Myc
and it is one of the genes in commonfor both data sets. The
repression of Myc by TGF-β stimulation is mediated by the
TFs E2F4/5 and DP-1 [35]. In agreement with this picture, we
found all six pathways that were significant for the Myc gene
signature (Table 1) as well as the E2F pathway to be signifi-
cant for both TGF-β data sets (Table 2).
The fibroblasts used by Yang et al. to identify TGF-β respon-
sive genes included MEFs with genetic ablation of MAPK
ERK. The oncogene Ras activates ERK, and eight of the ten
pathways we found to be significant for the Ras gene
signature (Table 1) were also found to be significant for the
Yang et al. gene signature (Table 2). This finding indicates
that the Yang et al gene signature is a mixture of the tran-
scriptional response to both MAPK and Smad signaling. For
this data set, four pathways appeared as significant only
because they contain the TFs c-Jun and NF-κB. These two
TFs also appear in other significant pathways supported by
additional significant TFs, including the AhR, EGF, MAPK,
and p38 pathways. Biochemical investigations are required to
reveal if the pathways with only c-Jun and NF-κ
B are indeed
deregulated, or if they are false positives likely to go away as
the information in pathway databases improves.
This analysis of TGF-β signaling provides a demonstration
that pathway analysis can be used to find common pathways
underlying gene sets with small overlaps. In addition, we have
again verified that our method identifies relevant pathways.
Poor prognosis gene signature for breast cancer
Finally, we tested the ability of our method to identify signal-
ing pathways involved in a disease by using a gene expression
signature from breast tumor samples. We used a signature
distinguishing patients who developed distant metastases
within five years from patients who remained disease free for
at least five years [36]. This poor prognosis gene signature
contains 70 genes that we investigated for pathway activities.
The signature consists of genes annotated as being involved
in cell cycle, invasion, metastasis, and angiogenesis [36].
Consistent with the functional annotation of the genes, we
found that the E2F pathway, a pathway that regulates the cell
cycle, was most significantly associated with the poor progno-
sis signature (Table 3). Activation of the E2F pathway can
induce the transition from G1 to S phase in the cell cycle. The
percentage of cells in a tumor cell population that are in S
phase is known to be associated with shorter disease-free sur-
vival [37]. We also found the AhR pathway to be significant
(Table 3). The AhR pathway has been suggested to inhibit
apoptosis while promoting transition to an invasive, meta-
static phenotype for breast tumors [30]. Interestingly, we
found the caspases pathway, which regulates apoptosis, to be
significant (Table 3). This finding is consistent with the indi-
cation in recent studies that apoptosis is a central mechanism
regulating metastasis [38]. We note that the pathways found
are similar to those significant for the E2F3 oncogenicgene
signature (Table 1), suggesting that the poor prognosis signa-
ture largely reflects cell proliferation. Our analysis of the poor
prognosis signature highlights the potential of our method to
reveal pathways that both are consistent with functional
annotations of genes in signatures andprovide a more
detailed insight into the molecular mechanisms underlying
the annotations.
Comparison with EASE and GSEA for oncogenic
pathway profiles
We compared our method with methods that relate gene
expression signaturesor profiles to gene annotations. Two
widely used methods for such analysisare EASE [7] and GSEA
[10]. EASE uses a gene signature and can, among other
things, search for an enrichment in the signature of genes
annotated as components of pathways in the KEGG, Gen-
MAPP, and BBID pathway databases. GSEA uses entire gene
expression profiles to evaluate whether a pre-defined set of
genes shows statistically significant, concordant differences
between two biological states. GSEA provides a collection of
gene sets called the Molecular Signature Database (MSigDB),
which contains two collections of gene sets relevant for path-
way analysis. The gene set C2 (curated gene sets) includes sets
of pathway genes from the BioCarta, GenMAPP, and Signal
R77.6 Genome Biology 2007, Volume 8, Issue 5, Article R77 Liu and Ringnér />Genome Biology 2007, 8:R77
transduction knowledge environment (STKE) databases, but
also numerous published gene signatures [10]. The gene set
C3 (motif gene sets) includes sets of genes annotated as TF
targets using TRANSFAC [39]. Given the differences between
these two methods, we think a comparison with EASE and
GSEA will highlight important differences between our
method and methods that identify pathways based on path-
way components. We used the three oncogenic pathway data
sets for this comparison because they are ideal to evaluate
whether pathway activation can be identified from gene
expression profiles since each data set reflects activation of a
known pathway.
EASE results
For the E2F3 signature, EASE identified a few cell cycle-
related pathways as significant (EASE score <0.05): 'Cell
cycle' and 'Cell growth and death' from KEGG, 'Cell cycle'
from GenMAPP, as well as 'RBphosphoE2F' and 'cyclin-CDK
complexes' from BBID. They were all identified by a set of cell
cycle genes. In addition, 'Purine metabolism' from KEGG and
'Wnt signaling' from GenMAPP were found to be significant.
All of these pathways reflect downstream effects of E2F3 acti-
vation. However, the 'E2F transcriptional activity cell cycle'
pathway from BBID was not found to be significant at all
(EASE score of 1.0). For the Myc signature, EASE identified
'Fructose and mannose metabolism' and 'Carbohydrate
metabolism' from KEGG as well as 'Glycolysis and gluconeo-
genesis' from GenMAPP as significant pathways (EASE score
<0.05). These three pathways were essentially identified by
the same genes. In contrast, pathways with Myc itself as a
component, including the 'Myc network' and 'G1-phase tran-
sition by Myc' from BBID, were found to be insignificant (all
had EASE scores of 1.0). For the Ras signature, two pathways
from KEGG, 'Signal transduction' and 'Phosphatidylinositol
signaling system', were found to be significant (EASE score
<0.05). It has been indicated that Ras activates the phos-
phatidylinositol signaling system, although not at levels suffi-
cient for oncogenic transformation of human mammary
Table 2
Significant pathways for TGF-β gene signatures
Pathway TFs Significant TFs P value
Yang et al. gene signature
AhR AhR, ER-α, Sp1, p300, NF-κB, Arnt AhR, Sp1, p300, NF-κB, Arnt <0.001
EGF c-Fos, Elk-1, Sp1, STAT3, c-Jun, STAT1α, c-Myc Sp1, c-Jun, c-Myc <0.001
c-Kit MITF, Sp1, Tal-1, p300, GATA-1 Sp1, p300 <0.001
p53 TFIIA, E2F1, p53, p300, BRCA1, YY1 E2F1, p53, p300, BRCA1 <0.001
Caspases CREB, Max, SRF, p53, AP-2α CREB, Max, p53, AP-2α <0.001
MAPK CREB, Elk-1, p53, c-Jun, c-Myc CREB, p53, c-Jun, c-Myc <0.001
E2F DP-1, E2F, p53 DP-1, E2F, p53 <0.001
HIF-1 p53, p300, HIF-1α, HNF-4α2, Arnt p53, p300, HIF-1α, Arnt <0.001
Stress PPAR-γ, c-Ets-1, PPAR-α, Max NF-AT2, HSF1, c-Jun, Elk-1, p53, CHOP-10, CREB,
CRE-BP2, RXR-α, HNF-1α, STAT3, MRF4
Max, c-Jun, p53, CREB, CRE-BP2, RXR-α 0.001
TLR3 CRE-BP2, p300, c-Jun, IRF-3, IRF-7, NF-κB CRE-BP2, p300, c-Jun, NF-κB0.002
TLR4 CREB, CRE-BP2, STAT1, Elk-1, p300, IRF-3, IRF-7, NF-κB CREB, CRE-BP2, p300, NF-κB0.002
p38 ELk-1, p53, MITF, PPAR-α, CHOP-10, Max, CREB, PU.1, HNF-1α, CRE-BP2, NF-
AT2, STAT3, MRF4
p53, Max, CREB, CRE-BP2 0.003
JNK CRE-BP2, p53, HSF1, PPAR-γ, STAT3, c-Jun, c-Ets-1 CRE-BP2, p53, c-Jun 0.004
TGF-β LEF-1, CRE-BP2, Smad2, Smad3, Smad4 CRE-BP2, Smad4 0.006
EDAR c-Jun, NF-κB c-Jun, NF-κB0.015
IL-1 ELk-1, c-Jun, NF-κB c-Jun, NF-κB0.015
TCR2 c-Jun, NF-κB, NF-AT c-Jun, NF-κB0.018
RANK MITF, PU.1, c-Jun, NF-κB c-Jun, NF-κB0.020
Hypoxia ER-α, p53, AP-1, HIF-1α p53, HIF-1α 0.033
Notch Max, LEF-1, p300, c-Myc Max, p300, c-Myc 0.037
Karlsson et al. gene signa-
ture
AhR AhR, ER-
α, Sp1, p300, NF-κB, Arnt AhR, Sp1, Arnt <0.001
EGF c-Fos, Elk-1, Sp1, STAT3, c-Jun, STAT1α, c-Myc Sp1, STAT1α, c-Myc <0.001
c-Kit MITF, Sp1, Tal-1, p300, GATA-1 Sp1, Tal-1 <0.001
p53 TFIIA, E2F1, p53, p300, BRCA1, YY1 E2F1, BRCA1 <0.001
Caspases CREB, Max, SRF, p53, AP-2α Max, AP-2α <0.001
E2F DP-1, E2F, p53 DP-1, E2F 0.002
HIF-1 p53, p300, HIF-1α, HNF-4α2, Arnt HIF-1α, Arnt 0.006
Notch Max, LEF-1, p300, c-Myc Max, c-Myc 0.019
Genome Biology 2007, Volume 8, Issue 5, Article R77 Liu and Ringnér R77.7
comment reviews reports refereed researchdeposited research interactions information
Genome Biology 2007, 8:R77
epithelial cells [21]. However, the pathways 'MAPK signaling'
from KEGG (EASE score = 0.35) and 'MAPK cascade' from
GenMAPP (EASE score = 1.0) were not significant. For each
signature, we also analyzed the up- and down-regulated genes
separately. We found the results for signatures consisting of
up-regulated genes to be almost identical to the results
obtained using the total signatures, while very few significant
pathways were found for the down-regulated genes.
Together, these results for gene signatures of active oncogenic
pathways suggest that EASE identifies downstream effects
but not the known activated pathways.
GSEA results
We submitted the expression profiles for each oncogenic
pathway to GSEA and searched for enriched gene sets among
the C2 gene set collection from MSigDB. We used default set-
tings for GSEA, which means that up- and down-regulated
genes were analyzed separately. Surprisingly, for the E2F3
and Ras data, no gene sets were found to be significant (false
discovery rate (FDR) < 25%). For the E2F3 data, none of the
gene sets related to E2F obtained a P value below 0.18. For the
Ras data, the RAS pathway from BioCarta obtained a P value
of 0.32 and none of five MAPK pathways obtained P values
below 0.05. A gene set described as genes of the MAPK cas-
cade, with no further information, obtained a P value of 0.027
but was only ranked as gene set 59. For the Myc data, no sig-
nificant gene sets were found for genes up-regulated by Myc
activation (FDR < 25%). However, five of the ten top ranked
gene sets were related to Myc. Four sets consisted of genes
found by other gene expression profiling studies to be up-reg-
ulated by Myc and one set was a database of identified direct
targets of Myc. On the other hand, there were 393 gene sets
significant for genes down-regulated by Myc (FDR < 25%),
but no Myc-related gene set obtained a P value below 0.05.
We also analyzed the data sets with GSEA such that up- and
down-regulated genes were not separated and obtained gene
sets ranked essentially in the same order as for up-regulation
separately. However, for this analysis, GSEA identified 855,
966, and 829 sets significant at a FDR < 25% out of 1,287 gene
sets for the E2F3, Myc, and Ras data, respectively, indicating
that the significance calculations in GSEA are highly sensitive
to changes in parameter settings. These results reinforce that
the genes for which expression correlated with activation of
oncogenic pathways are the target genes of the oncogenic
pathways rather than the components of the pathways.
We also ran GSEA for the oncogenic profiles using the C3
gene set collection from MSigDB to search for TFs potentially
regulating the gene expression profiles. For the E2F3 data,
568 gene sets were significant at a FDR < 25%. Of the ten top
ranked motifs, eight were binding motifs for TFs in the E2F
family. For the Myc data, GSEA identified eight gene sets at a
FDR < 25%, including binding motifs for Myc and Nmyc. No
significant gene sets were found for the Ras data. We also per-
formed this motif analysis for up- and down-regulated genes
together. Again, we obtained gene sets ranked in similar order
as for the up-regulated genes analyzed separately, but with
the majority of all gene sets significant at a FDR < 25%.
The methods provide complementary information
Our comparison with EASE and GSEA has shown that identi-
fying pathway deregulation from gene expression profiles by
mapping genes to pathway components is difficult. Instead,
we find, using both Toucan [40,41] as a part of our strategy
and GSEA with the C3 (motif) gene sets, that characteristi-
cally expressed genes are more likely target genes of the
deregulated pathways. With this in mind, it is not surprising
that our strategy was better than EASE and GSEA at
identifying the expected activated pathways for the oncogenic
pathway profiles. On the other hand, by having the potential
to identify downstream effects of the deregulated pathways,
EASE may provide information complementary to our
method. Although mapping to gene sets consisting of path-
way components using GSEA did not identify the deregulated
pathways, GSEA can be used with a variety of other gene sets
that can provide valuable information. Our GSEA results for
the Myc data show that gene sets based on gene expression
signatures from pathway characterization experiments can be
used to identify pathway deregulation in other gene expres-
sion data sets. Such signatures are likely a mixture of direct
targets and genes affected downstream. Motif analysis, as
part of our strategy, has the advantage of emphasizing target
genes, which allows for more accurate identification of sign-
aling pathway deregulation. Our GSEA results for the C3
(motif) gene sets also show that GSEA is useful for identifying
TFs whose deregulation results in an observed gene expres-
sion profile. However, our results indicate that the signifi-
cance statistics that Toucan uses are more robust for the
discovery of significant binding motifs. In addition, the
results obtained with our method suggest that a gene set for a
pathway could be generated by merging all motif gene sets for
Table 3
Significant pathways for the breast cancer prognosis gene signature
Pathway TFs Significant TFs P value
E2F DP-1, E2F, p53 DP-1, E2F <0.001
AhR AhR, ER-α, Sp1, p300, NF-κB, Arnt AhR, Sp1 0.017
Caspases CREB, Max, SRF, p53, AP-2α AP-2α 0.039
R77.8 Genome Biology 2007, Volume 8, Issue 5, Article R77 Liu and Ringnér />Genome Biology 2007, 8:R77
the TFs involved in the pathway. Such pathway gene sets
could be very useful for GSEA analysis.
Conclusion
We present a strategy to identify signaling pathways whose
deregulation results in an observed gene expression signa-
ture. The strategy is based on combining identification of
putative TF binding sites in promoter regions of genes with
knowledge about which TFs act in the same pathway. The
major conclusions from our results for six human and mouse
gene expression signatures are as follows. First, it is feasible
to identify pathways deregulated in mammalian gene expres-
sion signatures by viewing such signatures as a collection of
target genes of the TFs mediating the pathways. Second,
while binding site analysis alone can identify key TFs, com-
bining such analysis with pathway information improves the
potential to direct attention to possible mechanisms driving
an observed transcriptional response. Third, mapping gene
expression signatures onto pathways by motif analysis can
guide the identification of common regulatory programs driv-
ing different signatures with small overlaps, as well as the
identification of diverse regulatory programs driving a single
signature. Moreover, our strategy provides information com-
plementary to widely used methods for biological interpreta-
tion of gene expression data such as EASE and GSEA. While
such methods, for example, can verify the biological consist-
ency of gene expression data to pathway signatures in the lit-
erature, we found that our strategy was better at identifying
the pathways known to be deregulated for many of the data
sets. As pathway databases are steadily growing in size and
quality, we expect that methods combining regulatory motif
analysis with pathway information will be even more useful in
the future.
Materials and methods
Pathway information retrieval
Signal transduction pathways were taken from the TRANS-
PATH database (release 7.1). For the 62 pathways defined in
the database, 58 components were identified as TFs mediat-
ing at least one pathway. We extracted pathway-TF pairs from
the map files provided by TRANSPATH and extracted DNA
binding motifs of these TFs from TRANSFAC (release 10.1).
The binding motifs used were 6-24 bp long and each was rep-
resented by a position-weight-matrix (PWM) that indicates
the experimentally determined frequency of the four nucleo-
tides at each position. Some TFs have multiple DNA binding
motifs, and each binding motif is associated with one PWM.
The 58 pathway TFs were associated with 182 PWMs. There
were 47 pathways represented by at least one PWM. These 47
pathways were used in our subsequent analysis (Figure 1a).
Identification of transcription factor binding sites
Each human and mouse cluster in the UniGene database
(human build 193; mouse build 155) was associated with Ref-
Seq reference sequences using ACID [42]. Clusters that did
not match a RefSeq or matched multiple RefSeqs were
excluded from the analysis. This procedure resulted in 13,950
human and 13,477 mouse RefSeqs for which we retrieved 1 kb
promoter sequences from the University of California Santa
Cruz Genome Browser [43] using human assembly hg18 and
mouse assembly mm7 (Figure 1a). Putative TF binding sites
in the promoter sequences were identified by using MotifS-
canner, a part of the Toucan software [40,41], which can
search for the occurrences of a list of known motifs in each
query sequence. MotifScanner requires several arguments
including: a set of query sequences; a background model that
scores the frequencies of single nucleotides or oligonucle-
otides of fixed size; and a set of motifs represented by PWMs.
In our analysis, all 1 kb promoter sequences for a species were
used both as a query set and to generate a background model
for oligonucleotides of size three [44]. All PWMs for the path-
way TFs were used when searching for putative binding sites.
Default values were used for all other MotifScanner parame-
ters. For each promoter sequence, MotifScanner outputs the
number of occurrences for each motif.
Statistical analysis of binding sites
The genome-wide frequency (f) of each motif (m) is calculated
by dividing the observed number of occurrences (K) of this
motif in all human or mouse promoter sequences (N) with the
number of possible start positions R(N):
The possible number of start positions (R) in n promoter
sequences for a motif was approximated as:
where Li is the length of the ith sequence and w is the length
of the motif. The P value of observing k or more occurrences
of the motif m in n (n ≤ N) promoter sequences is calculated
by a binomial test (Figure 1b) as described in [40]:
Thus, a small P value indicates an enrichment for motif m in
the promoters of genes in a gene signature.
Statistical analysis of pathway activities
The activity of a pathway in a gene expression signature was
assessed by the enrichment of the binding motifs for the TFs
mediating this pathway (Figure 1b). Letting TF(p) denote the
set of TFs for a pathway p, and M(t) the set of binding motifs
for a TF t, we used the P values for the motifs (equation 3) to
first define a score for a TF t as:
f
K
RN
m
=
()
.
(1)
Rn L w
i
i
n
() ( ),=× − +
=
∑
21
1
(2)
Pm
Rn
j
ff
m
j
jk
Rn
m
Rn j
−=
⎛
⎝
⎜
⎞
⎠
⎟
××−
=
−
∑
va uel ()
()
().
()
()
1
(3)
Genome Biology 2007, Volume 8, Issue 5, Article R77 Liu and Ringnér R77.9
comment reviews reports refereed researchdeposited research interactions information
Genome Biology 2007, 8:R77
and second a score for a pathway p as:
We generated gene sets of the same size as the gene signature
by randomly selecting genes from the human or mouse
genome. We calculated a P value for pathway p by comparing
S(p) with scores obtained using these randomly selected gene
sets. A P value for TF t was calculated as for pathway p but
using the TF score S(t) instead of the pathway score. In this
way two types of P values are obtained: one for TFs and one
for pathways. We used 1,000 randomly selected sets in each
of our analyses. TFs with P < 0.1 were considered significant.
Pathways were considered significant if they met two criteria:
a pathway P value < 0.05; and at least two significant TFs or
one significant TF unique for the pathway.
EASE and GSEA analysis
In the EASE analysis, we selected the categories BBID path-
way, GenMAPP pathway, and KEGG pathway, used the EASE
score as the primary score, and used all mouse or human
genes as the general population of genes. For all other EASE
settings, we used default values. Pathways that obtained an
EASE score smaller than 0.05 were considered significant.
We used default values for parameters in the GSEA analysis:
genes were ranked according to how their expression levels
correlate with phenotypes using the signal-to-noise ratio, and
phenotype permutations were used for assessments of signif-
icance. A FDR maximum of 25% was used to identify signifi-
cant gene sets as recommended by GSEA. When presenting
results for specific gene sets nominal, uncorrected P values
are shown. When analyzing up- and down-regulated genes
together the absolute value of the signal-to-noise ratio was
used to rank genes. Gene sets were obtained from MSigDB
version 2 (January 2007 release).
Gene signatures
We obtained six different publicly available human and
mouse gene signatures. Gene identifiers were mapped to Uni-
Gene clusters using ACID [42]. Gene identifiers that mapped
to multiple UniGene clusters were removed from further
analysis.
Availability
Software for the method was written using the PERL pro-
gramming language and is freely available upon request.
Additional data files
The following additional data are available with the online
version of this paper. Additional data file 1 is a file in tab-
delimited format listing the results for all pathways for the
E2F3 gene signature. Additional data file 2 is a file in tab-
delimited format listing the results for all pathways for the
Myc gene signature. Additional data file 3 is a file in tab-
delimited format listing the results for all pathways for the
Ras gene signature. Additional data file 4 is a file in tab-
delimited format listing the results for all pathways for the
Yang et al. [33] gene signature. Additional data file 5 is a file
in tab-delimited format listing the results for all pathways for
the Karlsson et al. [34] gene signature. Additional data file 6
is a file in tab-delimited format listing the results for all path-
ways for the breast cancer prognosis gene signature.
Additional data file 1Results for all pathways for the E2F3 gene signatureResults for all pathways for the E2F3 gene signatureClick here for fileAdditional data file 2Results for all pathways for the Myc gene signatureResults for all pathways for the Myc gene signatureClick here for fileAdditional data file 3Results for all pathways for the Ras gene signatureResults for all pathways for the Ras gene signatureClick here for fileAdditional data file 4Results for all pathways for the Yang et al. [33] gene signatureResults for all pathways for the Yang et al. [33] gene signatureClick here for fileAdditional data file 5Results for all pathways for the Karlsson et al. [34] gene signatureResults for all pathways for the Karlsson et al. [34] gene signatureClick here for fileAdditional data file 6Results for all pathways for the breast cancer prognosis gene signatureResults for all pathways for the breast cancer prognosis gene signatureClick here for file
Acknowledgements
We thank Morten Krogh and Jari Häkkinen for helpful discussions. MR was
in part supported by the Swedish Foundation for Strategic Research
through the Lund Strategic Centre for Clinical Cancer Research (CREATE
Health). YL was supported by the Swedish National Research School in
Genomics and Bioinformatics.
References
1. Brandenberger R, Wei H, Zhang S, Lei S, Murage J, Fisk GJ, Li Y, Xu
C, Fang R, Guegler K, et al.: Transcriptome characterization elu-
cidates signaling networks that control human ES cell
growth and differentiation. Nat Biotechnol 2004, 22:707-716.
2. Dean SO, Rogers SL, Stuurman N, Vale RD, Spudich JA: Distinct
pathways control recruitment and maintenance of myosin II
at the cleavage furrow during cytokinesis. Proc Natl Acad Sci
USA 2005, 102:13473-13478.
3. Bjorklund M, Taipale M, Varjosalo M, Saharinen J, Lahdenpera J,
Taipale J: Identification of pathways regulating cell size and
cell-cycle progression by RNAi. Nature 2006, 439:1009-1013.
4. Dahlquist KD, Salomonis N, Vranizan K, Lawlor SC, Conklin BR:
GenMAPP, a new tool for viewing and analyzing microarray
data on biological pathways. Nat Genet 2002, 31:19-20.
5. Zeeberg BR, Feng W, Wang G, Wang MD, Fojo AT, Sunshine M, Nar-
asimhan S, Kane DW, Reinhold WC, Lababidi S, et al.: GoMiner: a
resource for biological interpretation of genomic and pro-
teomic data. Genome Biol 2003, 4:R28.
6. Dennis GJ, Sherman BT, Hosack DA, Yang J, Gao W, Lane HC, Lem-
picki RA: DAVID: Database for Annotation, Visualization, and
Integrated Discovery. Genome Biol 2003, 4:P3.
7. Hosack DA, Dennis GJ, Sherman BT, Lane HC, Lempicki RA: Identi-
fying biological themes within lists of genes with EASE.
Genome Biol 2003, 4:R70.
8. Breslin T, Eden P, Krogh M: Comparing functional annotation
analyses with Catmap. BMC Bioinformatics 2004, 5:193.
9. Chung HJ, Park CH, Han MR, Lee S, Ohn JH, Kim J, Kim J, Kim JH:
ArrayXPath II: mapping and visualizing microarray gene-
expression data with biomedical ontologies and integrated
biological pathwayresources using scalable vector graphics.
Nucleic Acids Res 2005, 33(Web Server issue):621-626.
10. Subramanian A, Tamayo P, Mootha VK, Mukherjee S, Ebert BL, Gil-
lette MA, Paulovich A, Pomeroy SL, Golub TR, Lander ES, et al.
: Gene
set enrichment analysis: a knowledge-based approach for
interpreting genome-wide expression profiles. Proc Natl Acad
Sci USA 2005, 102:15545-15550.
11. Hanahan D, Weinberg RA: The hallmarks of cancer. Cell 2000,
100:57-70.
12. Downward J: Cancer biology: signatures guide drug choice.
Nature 2006, 439:274-275.
13. Breslin T, Krogh M, Peterson C, Troein C: Signal transduction
pathway profiling of individual tumor samples. BMC
Bioinformatics 2005, 6:163.
14. Rhodes DR, Kalyana-Sundaram S, Mahavisno V, Barrette TR, Ghosh
St m
mt
( ) ( ( )),
()
=−
∈
∑
log P
M
− value
(4)
Sp St
tp
() ().
()
=
∈
∑
TF
(5)
R77.10 Genome Biology 2007, Volume 8, Issue 5, Article R77 Liu and Ringnér />Genome Biology 2007, 8:R77
D, Chinnaiyan AM: Mining for regulatory programs in the can-
cer transcriptome. Nat Genet 2005, 37:579-583.
15. Krull M, Pistor S, Voss N, Kel A, Reuter I, Kronenberg D, Michael H,
Schwarzer K, Potapov A, Choi C, et al.: TRANSPATH: an infor-
mation resource for storing and visualizing signaling path-
ways and their pathological aberrations. Nucleic Acids Res 2006,
34(Database issue):546-551.
16. Matys V, Kel-Margoulis OV, Fricke E, Liebich I, Land S, Barre-Dirrie
A, Reuter I, Chekmenev D, Krull M, Hornischer K, et al.: TRANS-
FAC and its module TRANSCompel:transcriptional gene
regulation in eukaryotes. Nucleic Acids Res 2006, 34(Database
issue):108-110.
17. Bild AH, Yao G, Chang JT, Wang Q, Potti A, Chasse D, Joshi MB, Har-
pole D, Lancaster JM, Berchuck A, et al.: Oncogenic pathway sig-
natures in human cancers as a guide to targeted therapies.
Nature 2006, 439:353-357.
18. Johnson DG, Schwarz JK, Cress WD, Nevins JR: Expression of
transcription factor E2F1 induces quiescent cells to enter S
phase. Nature 1993, 365:349-352.
19. Dyson N: The regulation of E2F by pRB-family proteins. Genes
Dev 1998, 12:2245-2262.
20. Helin K, Wu CL, Fattaey AR, Lees JA, Dynlacht BD, Ngwu C, Harlow
E: Heterodimerization of the transcription factors E2F-1
andDP-1 leads to cooperative trans-activation. Genes Dev
1993, 7:1850-1861.
21. Zhao JJ, Gjoerup OV, Subramanian RR, Cheng Y, Chen W, Roberts
TM, Hahn WC: Human mammary epithelial cell transforma-
tion through the activation of phosphatidylinositol 3-kinase.
Cancer Cell 2003, 3:483-495.
22. Pugh CW, Gleadle J, Maxwell PH: Hypoxia and oxidativestress in
breast cancer. Hypoxia signalling pathways.
Breast Cancer Res
2001, 3:313-317.
23. Koshiji M, Kageyama Y, Pete EA, Horikawa I, Barrett JC, Huang LE:
HIF-1alpha induces cell cycle arrest by functionally counter-
acting Myc. EMBO J 2004, 23:1949-1956.
24. Deng Q, Liao R, Wu BL, Sun P: High intensity ras signaling
induces premature senescence by activating p38 pathway in
primary human fibroblasts. J Biol Chem 2004, 279:1050-1059.
25. Chen G, Hitomi M, Han J, Stacey DW: The p38 pathway provides
negative feedback for Ras proliferative signaling. J Biol Chem
2000, 275:38973-38980.
26. Huber MA, Azoitei N, Baumann B, Grunert S, Sommer A, Peham-
berger H, Kraut N, Beug H, Wirth T: NF-kappaB is essential for
epithelial-mesenchymal transition and metastasis in a model
of breastcancer progression. J Clin Invest 2004, 114:569-581.
27. Huang B, Zhao J, Li H, He KL, Chen Y, Chen SH, Mayer L, Unkeless
JC, Xiong H: Toll-like receptors on tumor cells facilitate eva-
sion of immune surveillance. Cancer Res 2005, 65:5009-5014.
28. Wolff EM, Liang G, Jones PA: Mechanisms of disease:genetic and
epigenetic alterations that drive bladder cancer. Nat Clin Pract
Urol 2005, 2:502-510.
29. Batsche E, Cremisi C: Opposite transcriptional activity
between the wild type c-myc gene coding for c-Myc1 and c-
Myc2 proteins and c-Myc1 and c-Myc2 separately. Oncogene
1999, 18:5662-5671.
30. Schlezinger JJ, Liu D, Farago M, Seldin DC, Belguise K, Sonenshein GE,
Sherr DH: A role for the aryl hydrocarbon receptor in mam-
marygland tumorigenesis. Biol Chem 2006, 387:1175-1187.
31. Ein-Dor L, Kela I, Getz G, Givol D, Domany E: Outcome signature
genes in breast cancer: is there a unique set? Bioinformatics
2005, 21:171-178.
32. Michiels S, Koscielny S, Hill C: Prediction of cancer outcome
with microarrays: a multiple random validation strategy.
Lancet 2005, 365:488-492.
33. Yang YC, Piek E, Zavadil J, Liang D, Xie D, Heyer J, Pavlidis P, Kucher-
lapati R, Roberts AB, Bottinger EP: Hierarchical modelof gene
regulation by transforming growth factor beta.
Proc Natl Acad
Sci USA 2003, 100:10269-10274.
34. Karlsson G, Liu Y, Larsson J, Goumans MJ, Lee JS, Thorgeirsson SS,
Ringnér M, Karlsson S: Gene expression profiling demonstrates
thatTGF-beta1 signals exclusively through receptor com-
plexes involvingAlk5 and identifies targets of TGF-beta
signaling. Physiol Genomics 2005, 21:396-403.
35. Chen CR, Kang Y, Siegel PM, Massague J: E2F4/5 and p107 as Smad
cofactors linking the TGFbeta receptor to c-myc repression.
Cell 2002, 110:19-32.
36. van't Veer LJ, Dai H, van de Vijver MJ, He YD, Hart AAM, Mao M,
Peterse HL, van der Kooy K, Marton MJ, Witteveen AT, et al.: Gene
expression profiling predicts clinical outcome of breast
cancer. Nature 2002, 415:530-536.
37. Sigurdsson H, Baldetorp B, Borg A, Dalberg M, Ferno M, Killander D,
Olsson H: Indicators of prognosis in node-negative breast
cancer. N Engl J Med 1990, 322:1045-1053.
38. Mehlen P, Puisieux A: Metastasis: a question of life ordeath. Nat
Rev Cancer 2006, 6:449-458.
39. Xie X, Lu J, Kulbokas EJ, Golub TR, Mootha V, Lindblad-Toh K,
Lander ES, Kellis M: Systematic discovery of regulatory motifs
in human promoters and 3' UTRs by comparison of several
mammals. Nature 2005, 434:338-345.
40. Aerts S, Van Loo P, Thijs G, Mayer H, de Martin R, Moreau Y, De
Moor B: TOUCAN 2: the all-inclusive open source workbench
for regulatorysequence analysis. Nucleic Acids Res 2005:393-396.
41. Aerts S, Thijs G, Coessens B, Staes M, Moreau Y, De Moor B: Tou-
can: deciphering the cis-regulatory logic of coregulated
genes. Nucleic Acids Res 2003, 31:1753-1764.
42. Ringnér M, Veerla S, Andersson S, Staaf J, Häkkinen J: ACID: adata-
base for microarray clone information. Bioinformatics 2004,
20:2305-2306.
43. Kent WJ, Sugnet CW, Furey TS, Roskin KM, Pringle TH, Zahler AM,
Haussler D: The human genome browser at UCSC. Genome
Res
2002, 12:996-1006.
44. Thijs G, Lescot M, Marchal K, Rombauts S, De Moor B, Rouze P,
Moreau Y: A higher-order background model improves the
detection of promoter regulatory elements by Gibbs
sampling. Bioinformatics 2001, 17:1113-1122.