Báo cáo y học: "Species-wide distribution of highly polymorphic minisatellite markers suggests past and present genetic exchanges among house mouse subspecies" ppt
Bạn đang xem bản rút gọn của tài liệu. Xem và tải ngay bản đầy đủ của tài liệu tại đây (2.8 MB, 15 trang )
Genome Biology 2007, 8:R80
comment reviews reports deposited research refereed research interactions information
Open Access
2007Bonhommeet al.Volume 8, Issue 5, Article R80
Research
Species-wide distribution of highly polymorphic minisatellite
markers suggests past and present genetic exchanges among house
mouse subspecies
François Bonhomme
¤
*
, Eric Rivals
¤
†
, Annie Orth
*
, Gemma R Grant
‡
,
Alec J Jeffreys
‡
and Philippe RJ Bois
‡§
Addresses:
*
Biologie Intégrative, ISEM CNRS Université de Montpellier 2 UMR 5554, Montpellier 34095, France.
†
LIRMM, CNRS Université
de Montpellier 2 UMR 5506, rue Ada, Montpellier 34392 Cedex 5, France.
‡
Department of Genetics, University of Leicester, Leicester LE1 7RH,
UK.
§
The Scripps Research Institute, Department of Cancer Biology, Genome Plasticity Laboratory, Parkside Drive, Jupiter, Florida 33458,
USA.
¤ These authors contributed equally to this work.
Correspondence: François Bonhomme. Email:
© 2007 Bonhomme et al.; licensee BioMed Central Ltd.
This is an open access article distributed under the terms of the Creative Commons Attribution License ( which
permits unrestricted use, distribution, and reproduction in any medium, provided the original work is properly cited.
Genetic exchanges among House Mouse subspecies<p>Global analysis of four minisatellite loci in House Mouse reveals unexpected long-range gene flow between populations and subspe-cies.</p>
Abstract
Background: Four hypervariable minisatellite loci were scored on a panel of 116 individuals of
various geographical origins representing a large part of the diversity present in house mouse
subspecies. Internal structures of alleles were determined by minisatellite variant repeat mapping
PCR to produce maps of intermingled patterns of variant repeats along the repeat array. To
reconstruct the genealogy of these arrays of variable length, the specifically designed software
MS_Align was used to estimate molecular divergences, graphically represented as neighbor-joining
trees.
Results: Given the high haplotypic diversity detected (mean H
e
= 0.962), these minisatellite trees
proved to be highly informative for tracing past and present genetic exchanges. Examples of
identical or nearly identical alleles were found across subspecies and in geographically very distant
locations, together with poor lineage sorting among subspecies except for the X-chromosome
locus MMS30 in Mus mus musculus. Given the high mutation rate of mouse minisatellite loci, this
picture cannot be interpreted only with simple splitting events followed by retention of
polymorphism, but implies recurrent gene flow between already differentiated entities.
Conclusion: This strongly suggests that, at least for the chromosomal regions under scrutiny, wild
house mouse subspecies constitute a set of interrelated gene pools still connected through long
range gene flow or genetic exchanges occurring in the various contact zones existing nowadays or
that have existed in the past. Identifying genomic regions that do not follow this pattern will be a
challenging task for pinpointing genes important for speciation.
Published: 14 May 2007
Genome Biology 2007, 8:R80 (doi:10.1186/gb-2007-8-5-r80)
Received: 12 October 2006
Revised: 22 January 2007
Accepted: 14 May 2007
The electronic version of this article is the complete one and can be
found online at />R80.2 Genome Biology 2007, Volume 8, Issue 5, Article R80 Bonhomme et al. />Genome Biology 2007, 8:R80
Background
To address the significance of molecular polymorphisms, one
option is to look at their distribution at population-, species-,
and genus-wide scales. Polymorphic genetic features, such as
variable number of tandem repeats (VNTRs) have long been
considered to be the most informative markers due to their
intrinsic high variability [1]. Minisatellites are particularly
informative, as shown by their early use in forensics and
paternity testing in humans [2]. Their very high level of vari-
ability made them ideal for DNA fingerprinting, linkage anal-
ysis, and population studies [3]. While semi-automated PCR
analysis of microsatellites has now largely replaced minisatel-
lite-based systems, DNA typing of minisatellites still provides
a powerful and highly discriminating tool. Unlike microsatel-
lites that are composed of short repeats of a few base pairs
(typically 1 to 6 bp), minisatellites are intermingled arrays of
usually GC-rich variant repeats ranging from 10 to over 100
bp depending on the locus, and with array lengths varying
from 100 bp to over 20 kilobases (kb). Intermingled patterns
of variant repeats along the array can be charted by minisat-
ellite variant repeat mapping by PCR (MVR-PCR) to provide
exquisitely detailed information on internal allele structure.
This strategy has been used extensively at human hypervari-
able minisatellites, with germline mutation rates greater than
0.5% per gamete, to obtain crucial information needed to
understand repeat turnover processes at these VNTRs
(reviewed in [4,5]). Due to the unstable nature of minisatel-
lites together with the frequently complex inter-allelic con-
version-like germline mutation process, pedigree analysis can
be performed for only a limited number of generations before
it becomes impossible to trace back the original allele
structure.
In the mouse genome, the situation appears to be more favo-
rable for pedigree and genealogy analysis. Systematic isola-
tion has identified human-like minisatellite loci (for example,
GC-rich, highly polymorphic) [6]. However, none were found
to be hypermutable. Analyses of mouse semen DNA demon-
strated that mutant alleles were rare, with mutation frequen-
cies at or below 5 × 10
-6
per sperm. However, these
frequencies are an underestimate since mutations involving
gain or loss of one to three repeats, likely to be the most com-
mon type of mutation, would have been lost during mutant
enrichment by DNA fractionation [7]. Also, female mutation
rates are not known. In contrast to human minisatellites,
mouse sperm mutants arise by simple intra-allelic duplica-
tion and deletion, similar to those observed in human blood
DNA [7,8]. This combination of high polymorphism, lower
mutation rate, and relatively simple intra-allelic turnover
mechanisms make mouse minisatellites potentially highly
informative for species-wide population studies. Neverthe-
less, reconstructing the genealogy of alleles is hampered by
the fact that aligning their sequences is difficult. Recently,
however, development of new algorithms specifically
designed to treat tandem repeat data has made analysis of
large MVR datasets possible (MS_Align; [9]). This allows
quantification of molecular divergence between alleles and
renders these information-rich loci amenable to phylogenetic
analysis. This allows the unique properties of rapid simple
mutation and complex internal structure at minisatellites to
be exploited to provide far more informative systems com-
pared to classic markers such as non-repetitive DNA or
microsatellites.
We therefore used MVR-PCR together with the MS_Align
algorithm to study for the first time the distribution of allelic
variants at four different minisatellite loci in the house mouse
(Mus musculus). This species has radiated outside its original
range within the last 0.5 million years, leaving at its periphery
three well recognized subspecies with recent ancestry (M. m.
domesticus, M. m. musculus, and M. m. castaneus) and pop-
ulations of a more ancient descent at its center [10]. Its range
has more recently expanded outside Eurasia because of com-
mensalism with man [11], allowing many recent secondary
contacts to occur, leading to a certain amount of re-admix-
ture. The possibility of a gene re-entering a gene pool depends
strongly on the kind of selective pressures exerted on it during
its co-evolution from its original background. The occurrence
of progressive incompatibilities building up during the course
of allele divergence (so called Dobzhansky-Muller incompat-
ibilities) may impede this phenomenon. At the opposite end
of the spectrum, facilitation may occur if some strong selec-
tive advantage is provided by the gene irrespective of the
recipient background. These contrasting possibilities will
shape the coalescence of individual chromosomal segments
when differentiated gene pools have co-existed for apprecia-
ble amounts of time, as in the house mouse. The question of
allele circulation throughout the species range is presently an
important focus for understanding the impact of selective
forces that shape complex eukaryotic genomes. However, for
a standard nuclear DNA sequence the intra-specific nucleo-
tide divergence is generally small, resulting in very short and
poorly informative coalescent branches within subspecies. To
characterize allele circulation among house mouse subspe-
cies, we report intra-specific coalescence analysis at four min-
isatellite loci, MMS24, 26, 80, and 30 [4], located on
chromosomes 7 (22 cM), 9 (68 cM and 79 cM), and X (43 cM),
respectively, on a panel of 116 individuals of various geo-
graphical origins.
Results
Array size and map structure
The entire data set is available at [12]. The geographical origin
of the mice used in this study is shown in Figure 1. The
number of different alleles and overall allelic diversity is pro-
vided in Table 1 for each of the four minisatellite loci ana-
lyzed. All loci proved to be highly variable in length and array
structure (He 0.90-0.99). Figures 2, 3, 4, 5 show examples of
MVR structures encountered. DOM, MUS, CAS stand for
domesticus, musculus and castaneus respectively, while CEN
designates the less well defined central populations. For each
Genome Biology 2007, Volume 8, Issue 5, Article R80 Bonhomme et al. R80.3
comment reviews reports refereed researchdeposited research interactions information
Genome Biology 2007, 8:R80
locus, for the sake of graphical representation, we computed
a multiple alignment according to the unpublished method of
Rivals (MS_Alimul) of some representative MVR codes for
each subspecies. While all haplotypes were employed in the
pairwise estimation of genetic distance between haplotypes
performed with MS_Align, computations with MS_Alimul
were made for subsets of similar MVR maps, otherwise the
proposed alignment would require too many gaps. We also
included unaligned short and long alleles, as well as some of
the more divergent alleles encountered. We supply for each
locus the set of alleles whose MVR codes were identical as
supplementary material at [12].
Trees
Figures 6, 7, 8, 9 show the coalescence patterns observed at
each locus across a reduced panel of haplotypes. For the sake
of legibility, only the locales analyzed for at least three loci
have been included in the trees, but the results presented
below were qualitatively identical to what could be inferred
from the complete set of individuals. One striking feature is
the variable degree of subspecific coalescence observed,
which goes from almost complete resolution of the domesti-
cus, musculus, and castaneus clades for sex chromosome
locus MMS30 (Figure 8) to a much more interspersed situa-
tion for MMS24 (Figure 6). Nevertheless in all four trees,
small clades of almost pure subspecific composition could be
identified. These small clades were robust with respect to var-
iations in penalty parameters used to align alleles (see Mate-
rials and methods); this robustness can be observed when
comparing for each locus a sub-optimal tree (given in supple-
mentary Figure S3 at [12]) and the corresponding optimal
tree of Figures 6 to 9. Below, we list noticeable, well supported
clades in each tree.
The MMS30 tree (Figure 8) offers the best subspecific resolu-
tion. When rooted by two European spretus alleles, starting
from the top node we first observe a not very solidly placed
subtree with two CAS/CEN alleles (a), and a reasonably well-
supported clade (Re = 0.66; see Materials and methods for a
description of Re) encompassing all the rest. This further
splits into two equally well-supported clades (Re = 0.73 (b)
and Re = 0.79 (c)). The uppermost one contains 24 out of 30
CAS/CEN alleles, while the bottommost constitutes a para-
phyletic grouping of three independent DOM clades (with Re
= 0.86 (d), 0.79 (f), and 1.00 (h)), a small CAS/CEN clade of
four haplotypes (Re = 0.88 (g)), and a well defined MUS clade
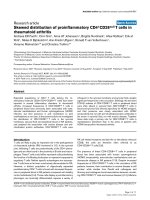
Geographical location of the localities sampledFigure 1
Geographical location of the localities sampled. 1, Lake Casitas, CA, USA; 2, Azzemour, Morocco; 3, Ouarzazate, Morocco; 4, Azrou, Morocco; 5, Leo'n
prov., Spain; 6, Granada, Spain; 7, Oran, Algeria; 8, Ardèche, France; 9, Montpellier, France 10, Monastir, Bembla, M'saken, Tunisia; 11, Sfax, Tunisia; 12,
Cascina Orcetto, Italy; 13, Ödis, Denmark; 14, Hov, Denmark; 15, Bohemia reg., Czech Republic; 16, Bialowieza, Poland; 17, Kranevo, Sokolovo, Bulgaria;
18, Vlas, Bulgaria; 19, Moscow, Russia; 20, Abkhasia prov., Georgia; 21, Adjaria prov., Georgia; 22, Van Lake, Turkey; 23, KefarGalim, Israel; 24, Cairo,
Egypt; 25, Megri, Armenia; 26, Alazani, Chirackskaya, DidichChiraki, Gardabani, Lissi, Vachlavan, Tbilissi, Georgia; 27, Daghestan, Russia; 28, Antananarivo,
Manakasina, Madagascar; 29, Mashhad, Kahkh, Birdjand, Iran; 30, Turkmenistan; 31, Gujarkhan, Islamabad, Tamapasabad, Rawalpindi, Pakistan; 32, Jalandhar,
Bikaner, Delhi, India; 33, Pachmarhi, India; 34, Masinagudi, India; 35, Varanasi, India; 36, Gauhati, India; 37, PathumThani, Thailand; 38, Gansu prov., China;
39, Fuhai, China; 40, Taiwan; 41, Mishima, Japan; 42, Tahiti, French Polynesia.
R80.4 Genome Biology 2007, Volume 8, Issue 5, Article R80 Bonhomme et al. />Genome Biology 2007, 8:R80
(Re = 0.85 (e)) branching out between two subtrees contain-
ing DOM haplotypes. The musculus subspecies is thus the
only one to appear monophyletic. In the '(f) domesticus sub-
tree, one also observes one CEN haplotype
(CEN_PAKI_Gujarkhan_10358). The case of these CAS/
CEN 'intruders' in the domesticus subtree will be discussed
further below. Moreover, a spretus haplotype,
SPR_MARO_Azzemour_9852, is clustered with two domes-
ticus haplotypes in clade (h) since they share exactly the same
MVR map. This haplotype differs completely from the other
SPR alleles, and suggests interspecific hybridization as
already demonstrated in this Moroccan locality [13].
The coalescent for locus MMS26 (Figure 7) displays a similar,
but somewhat fuzzier, pattern. Indeed, one still observes a
split between a CAS/CEN part and a DOM part in which a
large well-supported predominantly MUS clade (Re = 0.86
(d)) containing 15 out of 19 musculus haplotypes branches
Maps of the internal structure of variant repeats for mouse minisatellite MMS24Figure 2
Maps of the internal structure of variant repeats for mouse minisatellite MMS24. Groups of similar haplotypes were chosen arbitrarily for the purpose of
illustrating the maps' complexity. The groups correspond to clades in the trees of Figure 7. Their maps were aligned with the multiple alignment procedure
MS_Alimul (E Rivals, unpublished) and the alignments edited manually. Under an alignment column, an asterisk indicates a complete conservation, while a
period means that 60% of the variants in the column are identical. The alignments show which type of mutations occur between alleles, and where
corresponding differences are located in the maps. For comparison, we also display for each locus one of the shortest and one of the longest or most
complex alleles. Color code: spretus, orange; domesticus, blue; castaneus/cen, red; musculus, green.
Genome Biology 2007, Volume 8, Issue 5, Article R80 Bonhomme et al. R80.5
comment reviews reports refereed researchdeposited research interactions information
Genome Biology 2007, 8:R80
Maps of the internal structure of variant repeats for mouse minisatellite MMS26Figure 3
Maps of the internal structure of variant repeats for mouse minisatellite MMS26. Groups of similar haplotypes were chosen arbitrarily for the purpose of
illustrating the maps' complexity. The groups correspond to clades in the trees of Figure 7. Their maps were aligned with the multiple alignment procedure
MS_Alimul (E Rivals, unpublished) and the alignments edited manually. Under an alignment column, an asterisk indicates a complete conservation, while a
period means that 60% of the variants in the column are identical. The alignments show which type of mutations occur between alleles, and where
corresponding differences are located in the maps. For comparison, we also display for each locus one of the shortest and one of the longest or most
complex alleles. Color code: spretus, orange; domesticus, blue; castaneus/cen, red; musculus, green.
R80.6 Genome Biology 2007, Volume 8, Issue 5, Article R80 Bonhomme et al. />Genome Biology 2007, 8:R80
Maps of the internal structure of variant repeats for mouse minisatellite MMS30Figure 4
Maps of the internal structure of variant repeats for mouse minisatellite MMS30. For this locus, the alignments of domesticus haplotypes also comprise 4
CAS/CEN haplotypes. These castaneus and central haplotypes are clearly more similar to the domesticus alleles than to the group of CAS/CEN alleles in the
top multiple alignment. The sequence motifs shared between these introgressed CAS/CEN haplotypes and the domesticus and/or the musculus haplotypes
are shown in bold in a few maps. Groups of similar haplotypes were chosen arbitrarily for the purpose of illustrating the maps' complexity. The groups
correspond to clades in the trees of Figure 7. Their maps were aligned with the multiple alignment procedure MS_Alimul (E Rivals, unpublished) and the
alignments edited manually. Under an alignment column, an asterisk indicates a complete conservation, while a period means that 60% of the variants in the
column are identical. The alignments show which type of mutations occur between alleles, and where corresponding differences are located in the maps.
For comparison, we also display for each locus one of the shortest and one of the longest or most complex alleles. Color code: spretus, orange; domesticus,
blue; castaneus/cen, red; musculus, green.
Genome Biology 2007, Volume 8, Issue 5, Article R80 Bonhomme et al. R80.7
comment reviews reports refereed researchdeposited research interactions information
Genome Biology 2007, 8:R80
out. In the DOM/MUS part there is also a 15 haplotype sub-
tree (Re = 0.80 (c)) containing 14 out of 23 domesticus indi-
viduals. However, in the upper part of the tree there are two
main CAS/CEN clades (Re = 0.77 (a) and 0.53 (b)) that
encompass 34 out of 43 CAS/CEN haplotypes, but also one
MUS, two DOM, and one SPR alleles. In the bottom part, a
small subtree (Re = 0.69 (e)) mixes DOM, CAS, and MUS
haplotypes.
In contrast, the coalescence trees for loci MMS24 and
MMS80 (Figures 6 and 9) both display interspersion of small
and subspecies specific clades. For MMS80, the largest well-
supported clades are the perfectly supported (Re = 1.00)
monophyletic clade of M. spretus (a) haplotypes, and the
homogenous clade of 12 CAS/CEN haplotypes (Re = 0.70 (c)).
Other instances of well-supported specific clades for MMS80
include: a subtree of five musculus haplotypes originating
Maps of the internal structure of variant repeats for mouse minisatellite MMS80Figure 5
Maps of the internal structure of variant repeats for mouse minisatellite MMS80. Groups of similar haplotypes were chosen arbitrarily for the purpose of
illustrating the maps' complexity. The groups correspond to clades in the trees of Figure 7. Their maps were aligned with the multiple alignment procedure
MS_Alimul (E Rivals, unpublished) and the alignments edited manually. Under an alignment column, an asterisk indicates a complete conservation, while a
period means that 60% of the variants in the column are identical. The alignments show which type of mutations occur between alleles, and where
corresponding differences are located in the maps. For comparison, we also display for each locus one of the shortest and one of the longest or most
complex alleles. Color code: spretus, orange; domesticus, blue; castaneus/cen, red; musculus, green.
R80.8 Genome Biology 2007, Volume 8, Issue 5, Article R80 Bonhomme et al. />Genome Biology 2007, 8:R80
from Iran and Georgia (Re = 0.94 (b)), a clade of five cas-
taneus haplotypes from Madagascar (Re = 1.00 (d)) and a
clade of four domesticus haplotypes from Tunisia, Bulgaria,
and Denmark (Re = 1.00 (e)). For MMS24, the pattern is sim-
ilar, although some of the clades are somehow larger. Notice-
able are (i), a homogenous clade of 21 CAS/CEN haplotypes
(Re = 0.65 (a)), a homogenous clade of 7 domesticus haplo-
types (Re = 0.67 (b)), and a clade of 10 musculus haplotypes
with one laboratory strain domesticus allele (Re = 0.91 (c)).
The remainder of the tree shows a high level of interspersion.
Between clades (b) and (c), one notices a subtree containing
mostly domesticus but also two castaneus alleles,
CAS_THAI_Pathumtani_16108 and
CAS_THAI_Pathumtani_16144. These 'intruders' exhibit a
high level of similarity to domesticus alleles as testified by
their average distances to the set of alleles of each Mus mus-
culus subspecies: 40 to DOM and 52 to CAS for allele 16108,
and 37 to DOM and 45 to CAS for allele 16144 (see
supplementary Table S2 at [12]). Indeed, they are included in
the multiple alignment of DOM alleles of Figure 2, where
their similarity to domesticus alleles and their dissimilarity to
other CAS/CEN haplotypes becomes apparent. Such
intruders, which exist at all loci and cannot be interpreted as
artifacts (since they are similar but nevertheless different
from alleles of another subspecies), highlight the capacity of
the alignment program to correctly handle complex cases.
(Examples of intruders at all loci but MMS30 are listed in
supplementary Table S2).
In all four trees, the nearest neighbors of M. spretus haplo-
types are CAS/CEN haplotypes. Moreover, the MMS26 and
MMS30 trees agree on the split CAS/CEN-SPR against DOM-
MUS. It is interesting that MMS26, 30, and 80 have similar
variance accounted for (VAF) values (0.92, 0.93, 0.91 respec-
tively) but different patterns of subspecific coalescence.
Introgressed CAS/CEN haplotypes at locus MMS30
We mentioned above five castaneus and central haplotypes
that appear inside the domesticus/musculus subtree of the
MMS30 coalescence (Figure 8). We sought to understand
why these haplotypes are not located in the CAS/CEN part of
the tree with all other CAS/CEN haplotypes, and whether this
reflected homoplasy and the over-simplification of the evolu-
tionary model used in the alignment algorithm, or instead
truly reflects alleles identical by descent. When looking at the
alignment in Figure 4 for locus MMS30, it is striking that
these intruder haplotypes differ considerably from the typical
CAS/CEN MVR codes, and resemble much more the DOM or
Figure 6
Most reliable coalescence obtained at locus MMS24Figure 6
Most reliable coalescence obtained at locus MMS24. Neighbor-joining
trees obtained from the matrices of allele alignment distances computed
with the MS_Align pairwise alignment program [9]. For each internal edge,
the corresponding confidence value Re (in the range [0,100]) is shown.
The clades referred to by roman letters in parentheses in the text are
indicated.
Genome Biology 2007, Volume 8, Issue 5, Article R80 Bonhomme et al. R80.9
comment reviews reports refereed researchdeposited research interactions information
Genome Biology 2007, 8:R80
Most reliable coalescence obtained at locus MMS26Figure 7
Most reliable coalescence obtained at locus MMS26. Neighbor-joining
trees obtained from the matrices of allele alignment distances computed
with the MS_Align pairwise alignment program [9]. For each internal edge,
the corresponding confidence value Re (in the range [0,100]) is shown.
The clades referred to by roman letters in parentheses in the text are
indicated.
Most reliable coalescence obtained at locus MMS30Figure 8
Most reliable coalescence obtained at locus MMS30. Neighbor-joining
trees obtained from the matrices of allele alignment distances computed
with the MS_Align pairwise alignment program [9]. For each internal edge,
the corresponding confidence value Re (in the range [0,100]) is shown.
The clades referred to by roman letters in parentheses in the text are
indicated.
R80.10 Genome Biology 2007, Volume 8, Issue 5, Article R80 Bonhomme et al. />Genome Biology 2007, 8:R80
MUS haplotypes. Indeed, they share several sequence motifs
(all displayed in bold in Figure 4) either with the DOM codes
('G-G- [YK]-W- [YK]-K-K' just before the 3'-most 'o'-motif) or
with both the DOM and MUS codes ('K-K-Y(2,3)-K-G' at the
3' end, or 'G-Y-K-K-K-W-G' at the 5' end of DOM and at about
the tenth position in MUS codes), and none of these motifs
occur in the other CAS/CEN haplotypes. This supports clearly
the neighborhood of DOM and MUS in the tree, and gives evi-
dence that these 'intruders' do actually carry DOM-like hap-
lotypes. In addition, note that the nine-variant motif ('G-Y-Y-
K-G-Y-K-Y-K') at the 5' end of MUS haplotypes is specific for
this subspecies.
Identical haplotypes shared among geographically or
taxonomically distant samples
Several identical or quasi-identical alleles are shared by geo-
graphically distant locations (Table S2 at [12]). For instance,
at locus MMS24, allele DOM_TUNI_Sfax_10247L (CTTC-
CCCCCCCTTCTTTCTTTTToTTCC) is identical to
DOM_USA_Casitas_10712L, while
DOM_FRAN_Montpellier_BFM (CTTCCCCCCCoTToTT-
TCTTTTTTTTCCT) differs from DOM_DANE_Odis_DDO
(CTTCCCCCCCoTTTTTTCTTTTTTTTCCT) by a single
mutation (in bold italics). More surprisingly,
CAS_CHIN_Gansu_16072L (CTTTCTTC) is just one T
shorter than DOM_MARO_Azrou_DMZ2 (CTTTCTTCT).
Even more unexpectedly, DOM_BULG_Vlas_DBV,
DOM_TUNI_Monastir_22MO, and
SPR_MARO_Azzemour_9852 share the same haplotype
(GYKKKGWGKoGGYWYKKoKKKYYYKG) at this locus of the
X chromosome. There are many other examples where
identical haplotypes are shared among geographically distant
subspecies, as shown at tree tips or in the complete data set
(Table S1 at [12]). Occasionally, some haplotypes may be
over-represented and geographically widespread. A striking
example is the MMS30 haplotype
(GKKKKWGKKYKWKGWGHoGoKWKKKWKYY), which is
encountered 28 times in Taiwan and Madagascar, or the
MMS24 haplotype (TTTTTTCTTTTTCCoTTTCTTTCCCCCC),
which is encountered 10 times in India, Taiwan, and
Madagascar.
Discussion
Haplotype diversity and mutation rates
From the numbers of alleles and overall allelic diversities
given in Table 1, the locus with the smallest diversity is the X-
linked MMS30, which is consistent with the smaller effective
size of the X-chromosome compared to autosomes (a theoret-
ical three-quarter ratio). Taking this into account, the diver-
sity values in Table 1 are remarkably similar at each locus,
which may reflect a globally uniform mutation rate at mouse
minisatellites. This is consistent with the fact that the optimal
trees were obtained with similar mutation penalty parame-
ters for all loci.
Most reliable coalescence obtained at locus MMS80Figure 9
Most reliable coalescence obtained at locus MMS80. Neighbor-joining
trees obtained from the matrices of allele alignment distances computed
with the MS_Align pairwise alignment program [9]. For each internal edge,
the corresponding confidence value Re (in the range [0,100]) is shown.
The clades referred to by roman letters in parentheses in the text are
indicated.
Genome Biology 2007, Volume 8, Issue 5, Article R80 Bonhomme et al. R80.11
comment reviews reports refereed researchdeposited research interactions information
Genome Biology 2007, 8:R80
MMS80 is one of the most unstable loci. Its mutation fre-
quency has been directly estimated in the wild derived strain
DHA male germline at 5.10
-6
per sperm, while no mutations
were detected in Balb/c sperm [7]. However, considering an
average haplotypic diversity inside subspecies for the three
autosomal loci of 0.83 (calculation not shown) one can get an
approximation of the evolutionary mutation rate μ from the
equilibrium relationship H
e
= 4N
e
μ/(1 + 4N
e
μ) of circa 2.5 ×
10
-5
/generation for an effective size of N
e
= 5.10
4
. This last
value can itself be deduced from the inverse relationship
adapted for haploid genomes N
e
= H
e
/μ(1-H
e
) using an aver-
age mitochondrial D-Loop nucleotide diversity inside subspe-
cies of 0.5% (from [14]) and a D-Loop mutation rate of 10
-7
/
nucleotides/generation (from [15]). If Ne = 5.10
4
is an overes-
timate in the mouse, then the MMS mutation rate may be
even higher. One reason for this discrepancy with published
data may reside in the method for isolating mutant alleles by
size-enrichment small-pool PCR (SESP-PCR). This did not
permit the detection of length variations smaller than two or
three repeats, nor mutations that did not affect the size of the
array [7]. Nevertheless, the mutation rate of the mouse mini-
satellite loci studied here is higher than previously reported
by a factor of approximately 20.
Homoplasy versus migration
In order to draw biological inference from the trees built from
our MVR analysis, we have to address the issue of evolution-
ary noise due to the variable nature of the VNTRs used, spe-
cifically homoplasy arising by convergent evolution of allele
structures. Thus, the validity of the emplacement of, say, a
small CAS/CEN subtree inside a DOM clade has to be
questioned as well as the reality of similar or identical alleles
shared by very distinct geographic samples. Several argu-
ments suggest low levels of homoplasy in our data set. First,
there is a good tree arboricity as measured by the VAF, being
86% for the tree of MMS24 and above 90% for the three
others, and many clades are well supported with an Re index
above 0.8. Second, there is a paucity of long branches inside
various well-identified clades. In such clades, homoplasy on
complex structures is expected to yield spurious imperfect
matches between convergent alleles that would translate into
long branches. The latter is not observed in the examples pro-
vided above, where the structural complexity of long alleles
minimizes the likelihood of convergent evolution. This may
not be the case, however, for very small alleles like the spretus
ones, which are located toward the root of the tree. However,
for long haplotypes, which are predominant in our data set,
homoplasy may be discarded as the primary source of lack of
reciprocal monophyly.
Incomplete lineage sorting
On purely theoretical grounds, such intermingling could be
due to incomplete lineage sorting leading to the preservation
of ancestral polymorphisms in the various subspecific groups.
The question is, therefore, whether or not the time elapsed
since the divergence of domesticus and musculus, for
instance, would allow a complete sorting of gene lineages. An
estimation of this can be inferred from the coalescence of
mitochondrial genes as reported in [14]. In this report, the
intra-subspecific coalescence depth (estimated as twice the
average intra-subspecific pairwise nucleotide divergence) is
smaller than the divergence time (as estimated by the net
divergence between taxa). These two values are 0.98% and
3.55%, respectively, for the DOM/MUS comparison, which
makes a ratio of 0.27, much smaller than 1. Therefore, there is
a clear monophyly of each mitochondrial lineage with a com-
plete mitochondrial lineage sorting for these two subspecies
(this is less clear for the CAS/CEN mitochondrial haplotypes
[16]). For nuclear genes, the coalescence should be larger
than for mitochondria due to increased effective population
size, while the divergence time should be the same for all neu-
tral genes. So the ratio of coalescence over divergence is
expected to be four-fold larger than for the mitochondrial
data set. Extrapolating from the mitochondrial divergences
computed by [14], this would give a ratio of 1.08 for the DOM/
MUS comparison and 1.75 and 2.35 for the DOM/CAS and
MUS/CAS comparisons, respectively. Thus, we are, in princi-
ple, at the limit where one could predict complete coalescence
of nuclear genes to eventually occur for domesticus and mus-
culus, while incomplete lineage sorting is expected to occur
for haplotypes retained in the CAS (and even more so in the
CEN) coalescent. Note that if the coalescence of the mito-
chondrial genome has been reduced by selection as suggested
for species with large effective sizes [17], our mitochondrial
value would be an underestimate, and thus incomplete line-
age sorting is even more likely for nuclear genes unless they
are also subjected to selection. This fits well with what we
observe in the trees since monophyly is never attained except
for musculus at MMS30 and probably corresponds to the fact
that musculus and domesticus subspecies are likely to have
experienced evolutionarily smaller effective sizes while
migrating out of the Indian subcontinent cradle than the
central populations that supposedly occupied their distribu-
tion range for a longer time [16,18].
However, even if several molecular lineages were to be kept
segregating for a long time inside the subspecies, they would
have acquired autapomorphic mutations that could allow
them to be distinguished easily, and would not yield close
molecular similarity, such as seen here for some mouse min-
isatellites. With the mutation rate estimated above, the prob-
ability of having two haplotypes remaining identical after
50,000 generations of divergence is less than 1%, while after
10,000 generations only, one expects, on average, 5 muta-
tions per lineage. This necessarily means that exchanges of
alleles have occurred by migration, and that those migrations
are not restricted to within subspecies. On the other hand, it
is also possible to find little subclades of closely related
regionalized alleles that testify to local evolution of a probably
former foreign migrant haplotype, as exemplified in the
Results section. This is plausible, since if hybrid zone can trig-
ger genetic exchanges now, they can have done so even more
R80.12 Genome Biology 2007, Volume 8, Issue 5, Article R80 Bonhomme et al. />Genome Biology 2007, 8:R80
in the past, when taxa were less diverged than they are now.
Indeed, before expansion with agriculture during the Neo-
lithic, all subspecies were very likely restricted to a much
smaller region going from the Near East and the Fertile Cres-
cent to the southern slopes of the Himalayas, Elbourz, and
Caucasus, and maybe around the Black and Caspian seas, but
they were not elsewhere (this is well documented for domes-
ticus westward bound in, for example, [19] and the literature
cited therein, and the same should apply for musculus and
castaneus northward and eastward). So indeed, these sub-
species were all rather close to each other and ready to form
local hybrid zones at each expansion/contraction cycle due to
Pleistocene glaciations.
Altogether, the general lack of monophyly of the three main
subspecific groups, together with the traces of recent and less
recent migration events among them, is most likely due to the
permeability of the various subspecies' genomes to foreign
alleles, at least for the loci considered here. Note that this is
less so for the X-linked locus MMS30, which has the best res-
olution of subspecies coalescences and shows a lesser amount
of exchange between subspecies. This is expected since sex-
chromosomes have been shown to accumulate interspecific
incompatibility genes at a higher rate than autosomes for sev-
eral reasons, such as smaller effective population size, less
recombination, sexual selection, and arms races imposed by
segregation distortion and genome imprinting. This is in
agreement with the recently reported analysis of molecular
diversity of six X-linked and seven autosomal loci [20]. Nev-
ertheless, we show that for the locus considered and its sur-
rounding, the X chromosome inside domesticus exists under
at least three variant forms (see above) that are not
necessarily closer to each other than they are to the musculus
one; this may reflect past exchanges and introgression, even
for the X chromosome.
These results may appear to conflic with previously published
data concerning the identity and genetic borders of the vari-
ous entities inside M. musculus. Most of the previous litera-
ture, however, concerns mitochondrial DNA, and it is true
that at the global scale and at first glance, the distribution of
matrilines fits rather well with taxonomy, and that the Latin
trinomens seem to correspond to three well-defined entities
(some authors have even considered them as full species
[14]). Nevertheless, there are some exceptions to this, with
evidence of mitochondrial DNA admixture even rather far
from hybrid zones. Moreover, reciprocal monophyly is not
completely granted either; the rooting of the so-called 'orien-
tal' matrilines [16,21] that would characterize what we term
here CEN (for central) is clearly a complex and poorly
resolved matter. On the other hand, nuclear sequence data
are rarely available with the same configuration (that is, more
than ten individuals per subspecies). So most of the time
there are only one or two sequences per taxon, which is not
enough to detect the amounts of reticulation such as we have
seen. At last, these possibilities of genome wide gene
exchanges are reflected by a growing number of single
nucleotide polymorphism (SNP) data that show that except
for few specific regions [22,23], the three archetypal subspe-
cific genomes are still largely compatible, as exemplified by
the mosaic constitution of laboratory strains themselves [22-
24]. Moreover, these SNP studies show that, when focusing
for instance on the comparison between wild-derived strains
of musculus and domesticus, three kinds of chromosomal
segments can be sketched: some where the two subspecies are
maximally divergent; some where intra- and intersubpecific
levels of SNPs are comparable and rather high; and some with
both low divergence and low polymorphism. Since we have no
reason to consider that these mostly non-coding SNPs have
highly variable mutation rates, the last two categories are
good candidates for encompassing a continuum of situations,
from retention of purely ancestral polymorphism to recent
exchanges, with all possible intermediate situations.
Divergence among subspecies
If one computes net average divergence among groups esti-
mated by the mutational steps measured along the tree (tree
distance; not shown), one obtains the same picture at all loci,
with CAS being closest to CEN (5.6 steps on average over all 4
loci), while DOM and MUS are always invariably closer to
CEN than to CAS (alignment scores of 18.4 and 24.7 for DOM,
and 20.8 and 26.5 for MUS), the divergence between them
being 21.1. If one then considers the intra-group average
divergence, the CAS haplotypes show a tendency to be less
diversified (34.9 steps) than MUS (43.4), CEN (49.5), or
DOM (54.2). The castaneus alleles thus show the least diver-
sity while the domesticus ones show the most. This is in good
concordance with the fact that castaneus is a peripheral sub-
species most recently derived from the central populations.
The fact that domesticus displays greater diversity than the
central populations is somewhat surprising since the latter
populations are thought to have a longer history in the same
place than domesticus, castaneus or musculus. This may be
due to the fact that DOM MMS alleles tend to be longer than
the CEN alleles (30.5 repeats on average versus only 24.15 for
CEN), which will inflate the intra-group divergence even if the
coalescence time is indeed less.
Conclusion
Our murine VNTR study shows that these complex DNA
structures when handled in a meaningful way with adequate
alignment tools can reveal informative evolutionary data on
species-wide genetic flow. This may not be the case when
using simple non-repetitious sequences that may not possess
enough intrinsic variation as well as simpler tandem repeats
like microsatellites where mutation history is readily lost
through homoplasy. Therefore, minisatellite VNTRs com-
prise an invaluable tool to identify past and present
exchanges within the species range. Indeed, we show using
our panel of wild-caught and wild-derived mice that such is
the case: generalized non-reciprocal monophyly as well as
Genome Biology 2007, Volume 8, Issue 5, Article R80 Bonhomme et al. R80.13
comment reviews reports refereed researchdeposited research interactions information
Genome Biology 2007, 8:R80
current and less recent secondary exchanges between subspe-
cies are a reality. Interestingly, this is true even for the X-
chromosome despite its demonstrated tendency to diverge
faster than autosomes. Indeed, sex-chromosomes are, by
nature, prone to accumulate incompatibility genes, which
supposedly render it less likely to cross subspecies borders
[25]. Our analysis reveals a complex history at the MMS30 X-
linked locus, with multiple origins for the castaneus and
domesticus haplotypes (Figure 8). Thus, these wild mice
genomes constitute a set of interrelated gene pools that are
still able to exchange genes from time to time, at least for the
four chromosomal locations and the sample of wild genomes
analyzed. Recent SNP studies also illustrate this point
[22,23], although SNPs do not allow as refined an analysis of
the coalescence of a particular point in the genome as MMS
do, this last technique potentially constituting an interesting
means of revealing past and present forces having shaped the
distribution of their flanking region species-wide. The overall
picture fits well with the supposed phylogeographic scenario
in which castaneus is a recent offshoot from the so-called cen-
tral populations that would have occupied the species' ances-
tral range, while domesticus and musculus would have
diverged earlier when migrating out.
Materials and methods
Animals and DNAs
We selected 116 samples from the Montpellier DNA collection
to represent the main subspecies of M. musculus and its cen-
tral populations. Some individuals were not original wild-
caught mice, but were the offspring of mice that were bred in
closed colonies of a single origin in our genetic repository in
Montpellier. Their geographical origin is shown on the map in
Figure 1 and incorporated in the individual designation of
haplotypes available in the first column of Table S1 in [12].
The number of individuals studied at each location may vary
slightly from one locus to another. Several individuals of the
closely related species M. spretus were taken as an outgroup.
Altogether, 92, 90, 82, and 87 wild or wild-derived mice were
scored for MMS24, 26, 30, and 80, respectively. Additionally,
laboratory strains' DNA (AKR, C57Bl6, DBA/2, C3H, Balb/c,
SWR and SJL) was used as standards and included in the
study. Routine laboratory strategies were taken to reduce to a
minimum any possibility of DNA contamination or mix ups
with such small batch processing during DNA extraction.
Molecular methods
MVR-PCR uses variant repeats within minisatellite loci to
generate internal maps of minisatellite alleles by a simple
PCR assay [26]. Prior to MVR mapping, mouse minisatellite
alleles were amplified to visible level using specific flanking
primers. Flanking primers were (nomenclature: -, 5' of the
array; +, 3' of the array; distance in kb from the repeated
array; F, forward; R, reverse): MMS30-0.02/F, 5'-CTGGGA-
TAGATTCATGCACAGC-3'; MMS30+0.03/R, 5'-CCTGCCA-
CATGGTTAGTTACCT-3'. Amplifying primers and PCR
conditions for MMS24, 26 and 80 have been previously
described [6]. MMS30 amplifications were carried out at
96°C for 30 s, 66°C for 30 s, 70°C for 3 minutes for 28 cycles
as described elsewhere [3]. PCR products were resolved by
electrophoresis through 0.8% agarose gels. Two- and three-
state MVR-PCR were developed at four independent mouse
minisatellite loci using the same methodology as previously
established [6,26]. MMS30 MVR-PCR reactions were carried
out at 96°C for 50 s, 56°C for 45 s, 70° for 3 minutes for 24
cycles. The 5' flanking primer was MMS30-0.02/F. Two-state
MVR specific 3' primers together with their final concentra-
tion per reaction were MMS30/TAG-CT (Y repeat: 5'-
tcatgcgtccatggtccggaATCTTCTGTATAGTGTGAACT-3', 1
nM); MMS30/TAG-GT (K repeat: 5'-tcatgcgtccatggtccg-
gaATCTTCTGTATAGTGTGAAGT-3', 1 nM); MMS30/TAG-
GG (G repeat: 5'-tcatgcgtccatggtccggaATCTTCTGTATAGT-
GTGAAGG-3', 1 nM). Nucleotide variations between primers
are highlighted in bold and the TAG primer sequence is in
lower case. The TAG primer used was as previously described
[26]. MVR-PCR conditions for MMS24, 26 and 80 can be
found elsewhere [6]. All subsequent MVR-PCR manipula-
tions, including two-state and three-state MVR mapping, gel
electrophoresis and detection were carried out as previously
described [6,7]. Again, particular care was taken to avoid mix-
ing up of the various samples. Each MMS locus was processed
in two phases and some DNA was typed at least twice. No dis-
crepancy was observed.
Description of the loci
We selected three autosomal (MMS24, 26 and 80) and one X-
linked (MMS30) minisatellite (Table 2). MMS26 and 80 are
both located in the subtelomeric region of chromosome 9, 4
Mb apart. All autosomal minisatellites were located in
intronic regions (Table 2). While distal from the promoter
region, it is possible that these intronic minisatellites may
contain enhancer regions that could potentially affect gene
expression. However, the wide range of size observed at these
minisatellites in M. musculus would suggest only a minimal,
if any, effect of these VNTRs on gene expression.
Alignment of MVR maps, distance, and penalties
To recover the relationships between alleles observed at a
locus, one needs to quantify the molecular divergence
between their MVR maps. For each locus separately, we con-
sidered the set of MVR maps of all haplotypes represented in
our sample. The alphabet of possible variants is defined by
the MVR-PCR experiments, such that MVR maps are
sequences written in locus specific alphabets. Simply count-
ing the difference of length between alleles yields a poor esti-
mate of allele divergence, as illustrated in Figures 2, 3, 4, 5
(two very different haplotypes may have the same length).
Obviously, one needs to consider not only the number of var-
iants, but also the sequence of variants. Classic alignment
methods suitable for DNA sequences cannot be applied to
MVR maps. Indeed, these methods count only point muta-
tions and disregard the main source of sequence divergence
R80.14 Genome Biology 2007, Volume 8, Issue 5, Article R80 Bonhomme et al. />Genome Biology 2007, 8:R80
in VNTR, namely the tandem duplication or contraction
events. The tandem duplication of a variant copies a variant
and inserts the copy next to the template (for example,
G→GG), and the reciprocal event, the tandem contraction of
a variant, deletes one among two identical adjacent variants
(for example, GG→G). In VNTR evolution, tandem
duplication and contraction are considered to be much more
frequent than point mutations. Therefore, to compare MVR
maps we use the alignment program MS_Align [9], whose
mutational model comprises, beyond insertion, deletion, and
substitution, also tandem duplication and tandem
contraction of a variant. The difference between tandem
duplication and insertion is that, in an insertion, the inserted
variant is not required to be identical to its adjacent variants.
The propensity of the different mutations in the output align-
ments is controlled by the parameter penalties assigned to
each mutation by the user. In the scoring scheme, the penal-
ties are denoted by M for a substitution, I for an insertion, D
for a deletion, A for a tandem duplication, and C for a tandem
contraction. Each penalty is independent of the variant
involved in the mutation event and our model is symmetrical,
that is, I = D and A = C. Note that once being introduced by a
duplication, a variant may later be changed into another by a
substitution (which altogether is like an insertion); thus,
duplication followed by a substitution may be preferred to an
insertion, depending on the penalties.
Now, given a scoring scheme that associates a penalty to each
type of mutation event, MS_Align computes an optimal align-
ment of minimum score between two MVR maps. An optimal
alignment is the sequence of mutations that transforms one
map into the other and whose sum of penalties is minimum.
The penalties sum of an alignment is called the alignment
score or the distance (since it is a metric distance in the math-
ematical sense). We compared in a pairwise fashion all MVR
maps of a set with MS_Align [9], and this yields a pairwise
distance matrix (with one distance per allele pair).
A present limitation of this approach is the undifferentiated
treatment of the null variant (a repeat unit that does not
prime during PCR due to the presence of an unknown
sequence variant), with all nulls being treated as identical.
Another limitation is the restriction of duplications and
contractions to operate on single variant, and not on blocks of
consecutive variants; that is, if the evolution of one allele has
involved a duplication of a block of several variants (for exam-
ple, TCoT → TCoTCoT), then MS_Align will find the best
optimal alignment with single variant duplications, but with-
out block duplication, and will thus overestimate the align-
ment score. Some alleles do indeed show evidence of these
larger-scale duplications, such as the reduplicated oTTT
motif in the MMS24 allele MUS_ARMN_Megri_MAM from
positions 11 to 18 (see the third multiple alignment for
MMS24 in Figure 2).
Inference of locus coalescence
For a given locus, these comparisons yield a distance matrix
giving the alignment score between any pair of MVR maps.
The alignment score is a distance metric in the mathematical
sense. We use the distance matrix to reconstruct an evolu-
tionary tree for the MVR maps using an improved neighbor-
joining algorithm called FastME [27]. To determine the
robustness of the obtained coalescence with respect to align-
ment parameters, we iterated this procedure for 40 different
combinations of penalties: A = C = 1, M = 4, 5, 6, 8, 10, 12, 14,
or 16, and I = D = 8, 10, 15, 20, or 25. The most influential cri-
terion is the ratio between the amplification and substitution
penalties; thus, we set arbitrarily A = C = 1 and let M vary. For
VNTR loci, amplification or contraction of a single variant are
the most frequent events and are more probable than a
variant substitution; this is the rationale for the chosen pen-
alties. As bootstrapping is not meaningful for this type of
data, we use an alternative to assess the confidence of each
tree and of each node in the tree. We computed two
mathematical criteria [28], the VAF and the rate of elemen-
tary well-designed quartets (Re). The VAF quantifies the ade-
quacy of representing the distances between maps by a tree;
the Re of an internal edge measures the average level of con-
fidence over all possible quadruplets of taxa linked by this
edge. The tree Re is an average of the edges' Re over all
internal edges; it gives a global confidence value for the whole
tree. This enables us to select the most reliable trees and to
see whether sub-optimal trees differ greatly from the optimal
(robustness). The optimal trees were obtained with penalties
M = 6, I = 20 for MMS24, M = 8, I = 20 for MMS26, M = 6, I
= 20 for MMS30, and M = 6, I = 8 for MMS80. Re is the value
reported on the trees. For each locus, the values of criteria of
each parameter combination are reported in Table S4 of the
supplementary material [12].
Acknowledgements
The authors are indebted to P Boursot, E Desmarais and B Dod for useful
comments on the manuscript. ER was supported by grants from 'Action
Concertée Incitative Mathématiques-Physique-Biologie' for the project
REPEVOL and from BioSTIC LR. AJJ is grateful for support from the Royal
Society. This paper is ISE-M contribution N° 2007-041.
References
1. Tautz D, Schlotterer C: Simple sequences. Curr Opin Genet Dev
1994, 4:832-837.
2. Jeffreys AJ, Wilson V, Thein SL: Hypervariable 'minisatellite'
regions in human DNA. Nature 1985, 314:67-73.
3. Jeffreys AJ, Neumann R, Wilson V: Repeat unit sequence
variation in minisatellites: a novel source of DNA polymor-
phism for studying variation and mutation by single mole-
cule analysis. Cell 1990, 60:473-485.
4. Bois P, Jeffreys AJ: Minisatellite instability and germline
mutation. Cell Mol Life Sci 1999, 55:1636-1648.
5. Tamaki K, Jeffreys AJ: Human tandem repeat sequences in
forensic DNA typing. Leg Med (Tokyo) 2005, 7:244-250.
6. Bois P, Stead JD, Bakshi S, Williamson J, Neumann R, Moghadaszadeh
B, Jeffreys AJ: Isolation and characterization of mouse
minisatellites. Genomics 1998, 50:317-330.
7. Bois PR, Grant GR, Jeffreys AJ: Minisatellites show rare and sim-
ple intra-allelic instability in the mouse germ line. Genomics
Genome Biology 2007, Volume 8, Issue 5, Article R80 Bonhomme et al. R80.15
comment reviews reports refereed researchdeposited research interactions information
Genome Biology 2007, 8:R80
2002, 80:2-4.
8. Jeffreys AJ, Neumann R: Somatic mutation processes at a
human minisatellite. Hum Mol Genet 1997, 6:129-136.
9. Bérard S, Rivals E: Comparison of minisatellites. J Comput Biol
2003, 10:357-372.
10. Guénet J-L, Bonhomme F: Wild mice: an ever-increasing contri-
bution to a popular mammalian model. Trends Genet 2003,
19:19-31.
11. Auffray J-C, Vanlerberghe F, Britton-Davidian J: The house mouse
progression in Eurasia: a palaeontological and
archaeozoological approach. Biol J Linn Soc 1990, 41:13-25.
12. Species-wide Analysis of Mouse Minisatellites [http://
www.lirmm.fr/~rivals/REPEVOL/MMS]
13. Orth A, Belkhir K, Britton-Davidian J, Boursot P, Benazzou T, Bon-
homme F: Hybridation naturelle entre deux espèces sym-
patriques de souris M. musculus domesticus L. et M. spretus
Lataste. C R Biologies 2002, 325:89-97.
14. Prager EM, Orrego C, Sage RD: Genetic variation and phyloge-
ography of central Asian and other house mice, including a
major new mitochondrial lineage in Yemen. Genetics 1998,
150:835-861.
15. Prager EM, Sage RD, Gyllensten U, Thomas WK, Hübner R, Jones CS,
Noble L, Searle JB, Wilson AC: Mitochondrial DNA sequence
diversity and the colonization of Scandinavia by house mice
from East Holstein. Biol J Linn Soc 1993, 50:85-122.
16. Boursot P, Din W, Anand R, Darviche D, Dod B, Von Deimling F, Tal-
war G, Bonhomme F: Origin and radiation of the house mouse:
mitochondrial DNA phylogeny. J Evol Biol 1996, 9:391-415.
17. Bazin E, Glemin S, Galtier N: Population size does not influence
mitochondrial genetic diversity in animals. Science 2006,
312:570-572.
18. Din W, Anand R, Boursot P, Darviche D, Dod B, Jouvin-Marche E,
Orth A, Talwar GP, Cazenave P-A, Bonhomme F: Origin and radi-
ation of the house mouse: Clues from nuclear genes.
J Evol Biol
1996, 9:519-539.
19. Cucchi T, Vigne J-D, Auffray J-C: First occurrence of the house
mouse (Mus musculus domesticus Schwarz & Schwarz, 1943)
in the Western Mediterranean: a zooarchaeological revision
of subfossil occurrences. Biol J Linn Soc 2005, 84:429-445.
20. Baines JF, Harr B: Reduced x-linked diversity in derived popula-
tions of house mice. Genetics 2007, 175:1911-1921.
21. Boissinot S, Boursot P: Discordant phylogeographic patterns
between the Y chromosome and mitochondrial DNA in the
house mouse: selection on the Y chromosome? Genetics 1997,
146:1019-1034.
22. Harr B: Genomic islands of differentiation between house
mouse subspecies. Genome Res 2006, 16:730-737.
23. Boursot P, Belkhir K: Mouse SNPs for evolutionary biology:
beware of ascertainment biases. Genome Res 2006,
16:1191-1192.
24. Zhang J, Hunter KW, Gandolph M, Rowe WL, Finney RP, Kelley JM,
Edmonson M, Buetow KH: A high-resolution multistrain haplo-
type analysis of laboratory mouse genome reveals three dis-
tinctive genetic variation patterns. Genome Res 2005,
15:241-249.
25. Orr HA, Presgraves DC: Speciation by postzygotic isolation:
forces, genes and molecules. Bioessays 2000, 22:1085-1094.
26. Jeffreys AJ, MacLeod A, Tamaki K, Neil DL, Monckton DG: Minisat-
ellite repeat coding as a digital approach to DNA typing.
Nature 1991, 354:204-209.
27. Desper R, Gascuel O: Fast and accurate phylogeny reconstruc-
tion algorithms based on the minimum-evolution principle.
J Comput Biol 2002, 9:687-705.
28. Guénoche A, Garreta H: Can we have confidence in a tree rep-
resentation? In Proceedings of the First International Conference on Biol-
ogy, Informatics, and Mathematics: 3-5 May 2000; Montpellier Edited by:
Gascuel O, Sagot M-F. Berlin: Springer-Verlag; 2000:45-56. [Hofmann
A (series editor): Lecture Notes in Computer Science, vol 2066.]