Báo cáo y học: "Characterizing the expression of the human olfactory receptor gene family using a novel DNA microarray" pps
Bạn đang xem bản rút gọn của tài liệu. Xem và tải ngay bản đầy đủ của tài liệu tại đây (603.32 KB, 10 trang )
Genome Biology 2007, 8:R86
comment reviews reports deposited research refereed research interactions information
Open Access
2007Zhanget al.Volume 8, Issue 5, Article R86
Research
Characterizing the expression of the human olfactory receptor
gene family using a novel DNA microarray
Xiaohong Zhang
*
, Omar De la Cruz
†
, Jayant M Pinto
‡
, Dan Nicolae
†§
,
Stuart Firestein
*
and Yoav Gilad
‡
Addresses:
*
Department of Biological Sciences, Columbia University, New York, NY 10027, USA.
†
Department of Statistics, University of
Chicago, Chicago, IL 60637, USA.
‡
Department of Human Genetics, University of Chicago, Chicago, IL 60637, USA.
§
Department of Medicine,
University of Chicago, Chicago, IL 60637, USA.
Correspondence: Yoav Gilad. Email:
© 2007 Zhang et al; licensee BioMed Central Ltd.
This is an open access article distributed under the terms of the Creative Commons Attribution License ( which
permits unrestricted use, distribution, and reproduction in any medium, provided the original work is properly cited.
Olfactory receptor expression<p>Using a microarray, expression of 76% of predicted human olfactory receptor genes was detected in olfactory epithelia, and many were expressed in non-olfactory tissues.</p>
Abstract
Background: Olfactory receptor (OR) genes were discovered more than a decade ago, when
Buck and Axel observed that, in rats, certain G-protein coupled receptors are expressed
exclusively in the olfactory epithelium. Subsequently, protein sequence similarity was used to
identify entire OR gene repertoires of a number of mammalian species, but only in mouse were
these predictions followed up by expression studies in olfactory epithelium. To rectify this, we have
developed a DNA microarray that contains probes for most predicted human OR loci and used
that array to examine OR gene expression profiles in olfactory epithelium tissues from three
individuals.
Results: We detected expression of 437 (76%) human OR genes in these olfactory epithelia.
Interestingly, we detected widespread expression of OR pseudogenes, an observation that may
shed light on the mechanism of OR gene choice in the olfactory sensory neurons. To address the
hypothesis that OR genes may carry out additional functions, we also characterized the expression
of OR genes in a number of non-olfactory tissues.
Conclusion: While our results corroborate the functional annotation of the majority of predicted
human odorant receptors, we find that a large number of putative human OR genes are expressed
in non-olfactory tissues, sometimes exclusively so. Our evolutionary analysis of ectopically
expressed human OR genes does not lend support to the hypothesis that these genes have
alternative functions.
Background
Buck and Axel [1] identified the odorant receptor (OR) gene
family based partly on the observation that OR genes were
expressed in olfactory epithelium, but were not detected in
lung, liver, spleen, kidney, retina, and brain. Subsequently,
additional OR genes were recognized in genomic sequences
by their similarity to the first set of identified OR genes [2,3],
and by the presence of certain predicted protein motifs [1,4].
Recently, the complete genomic sequence of a number of
mammalian species became available, permitting
Published: 17 May 2007
Genome Biology 2007, 8:R86 (doi:10.1186/gb-2007-8-5-r86)
Received: 17 January 2007
Revised: 10 April 2007
Accepted: 17 May 2007
The electronic version of this article is the complete one and can be
found online at />R86.2 Genome Biology 2007, Volume 8, Issue 5, Article R86 Zhang et al. />Genome Biology 2007, 8:R86
interspecies comparisons of complete OR gene repertoires.
The analyses of published mammalian genomes suggested
that the original estimate of the size of the mammalian OR
gene repertoire, approximately 100 genes, was a severe
underestimate. Indeed, it is now thought that mammalian
genomes carry 800-1,400 OR genes [5-10], which are typi-
cally organized in gene clusters and are found on many chro-
mosomes. With roughly 3% of all genes coding for odorant
receptors, OR genes are by far the largest gene family in mam-
malian genomes.
To date, however, mammalian OR genes have remained
largely orphan receptors. In fact, until recently, there was no
systematic study of putative mammalian OR gene expression
in olfactory epithelium [7,11], such that the functional anno-
tation of OR genes remained unclear. Moreover, expression
of several predicted mammalian OR genes was detected only
in non-olfactory tissues, notably in testis [12-14]. These
observations raised the possibility that a subset of predicted
OR genes may not be odorant receptors at all but have other
functions, with important implications for functional studies
in olfaction and comparisons of mammalian OR gene reper-
toires. Alternatively, OR genes may have a function beyond
odor recognition, for example, in sperm chemotaxis [15].
Recently, Zhang et al. [16] studied the expression of nearly all
predicted OR genes in mouse using a newly developed DNA
microarray [16]. Most (approximately 80%) predicted mouse
OR genes were confirmed to be expressed in olfactory epithe-
lium, but a subset were found to be expressed only in non-
olfactory tissues and, consequently, their functional annota-
tion is now in question [16]. In humans, it is not known how
many of the predicted OR genes are expressed in the olfactory
epithelium, and hence how many are likely to participate in
odorant binding. Moreover, the predicted human OR gene
repertoire includes nearly 600 pseudogenes [5] and it
remains unknown how often they are expressed. Since olfac-
tory sensory neurons are believed to express only a single
functional OR gene, if these pseudogenes are routinely
expressed in the olfactory epithelium, a large proportion of
neurons may either express a single non-functional gene, or
co-express a functional and non-functional OR genes [17].
A recent study [14] used expressed sequence tag (EST) data
and results of genome-wide microarrays to survey human OR
gene expression in olfactory epithelium and several non-
olfactory tissues. However, that analysis was limited by short-
comings of the available data, including biases and inaccura-
cies in the EST databases and incomplete sampling of OR
genes on the human genome-wide microarray (which
includes probe-sets for only 356 predicted OR genes and
pseudogenes). Moreover, the genome-wide microarray was
not optimized specifically to measure OR gene expression, so
many of the probes may be susceptible to cross-hybridization
by other OR genes [14]. Indeed, the authors' analysis of the
probe-set sequences suggested that the expression of only 217
human OR genes and pseudogenes could be estimated with
confidence using the genome-wide microarray data [14].
To comprehensively and reliably assess expression of pre-
dicted human OR genes, we designed a new microarray with
probes for nearly all human OR genes. We used this microar-
ray to characterize the expression of human OR genes in
olfactory epithelium as well as in a number of other tissues.
Results and discussion
To measure the expression of human OR genes, we extracted
total RNA from three samples of human olfactory epithelium
tissues collected by the National Disease Research Inter-
change)[18] within eight hours of the donor's death. We con-
firmed that RNA was extracted from olfactory epithelium
tissues by amplification of the odorant binding protein 2B
(OBP2B) gene (Figure 1), which is expressed exclusively in
olfactory epithelium [19]. In addition, we tested for the pres-
ence of olfactory sensory neurons in each sample by amplify-
ing the olfactory sensory neuron marker gene, the olfactory
marker protein (OMP) [20]. Once we confirmed the source of
the RNA, we proceeded by labeling and hybridizing each
olfactory epithelium RNA sample, in two independent techni-
cal replicates, to a custom human OR gene microarray (see
Materials and methods). Similarly, we hybridized RNA from
human liver, lung, kidney, heart, and testis (purchased from
Ambion (Austin, TX, USA)) to the microarray in two technical
replicates each.
Expression of OR genes in human olfactory epithelium
Our first goal was to detect which of the predicted human OR
genes are expressed in olfactory epithelium, thereby lending
support to their functional annotation as odorant receptors.
One way to examine this is to rely on the absent/present calls
that the Affymetrix software provides for each probe-set.
However, microarrays were not designed to detect expression
but rather to compare levels of expression between samples
or treatments and, as a result, existing algorithms are not well
suited for our application [21,22]. In particular, as probes
vary in their specificity and sensitivity, using cut-offs for
absolute hybridization intensity as a detection tool is unrelia-
ble [23-25]. An alternative is to use a comparison of gene
expression levels across the studied RNA samples in order to
detect genes that are expressed [16]. The rationale of this
approach is that genes with significantly higher expression in
sample A compared to sample B are clearly expressed in A.
Thus, OR genes with significantly elevated expression in
olfactory epithelium compared to other tissues can be consid-
ered 'detected'. Accordingly, we compared expression of OR
genes in the olfactory epithelium samples with their expres-
sion levels in the five non-olfactory tissues (see Materials and
methods).
Genome Biology 2007, Volume 8, Issue 5, Article R86 Zhang et al. R86.3
comment reviews reports refereed researchdeposited research interactions information
Genome Biology 2007, 8:R86
We found 437 predicted OR genes on the array to be
expressed in human olfactory epithelium at P < 0.05 (Figure
2a; Additional data file 1), when at most 29 are expected by
chance, given the statistical cutoff and the number of genes on
the array (see Table 1 for results using alternative statistical
cutoffs). These results were validated by performing RT-PCR
on ten randomly chosen OR genes whose expression was
detected in olfactory epithelium (Additional data file 1); in all
ten cases, the RT-PCR confirmed the arrays results. Thus, we
confirmed that the vast majority (76%) of predicted human
OR genes are indeed expressed in olfactory epithelium. In
contrast, the functional annotations of 141 predicted human
OR genes are now in question, as these were not detected as
expressed in olfactory epithelium. We note, however, that 109
of the above 141 OR genes did not have significantly elevated
expression levels in any tissue (Additional data file 1). Since
our detection criterion is based on differential expression, we
cannot exclude the possibility that a subset of the 109 OR
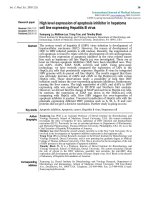
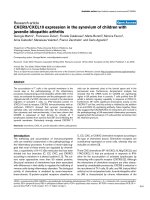
Gel electrophoresis of PCR amplification results using cDNA from three olfactory epithelium tissues, heart, testis, liver, lung, and kidney as templateFigure 1
Gel electrophoresis of PCR amplification results using cDNA from three olfactory epithelium tissues, heart, testis, liver, lung, and kidney as template. (a)
The 440 base-pair (bp) OBP2B product was only amplified from the olfactory epithelium samples. (b) The 562 bp cathepsin C (CTSC) product was
successfully amplified from all three samples. Both primer pairs were designed to amplify multiple exon products and hence are expected to yield a much
larger product (1,686 bp) if genomic DNA was used as template. (c) The 378 bp product of the OMP gene was amplified from the olfactory epithelium
samples to confirm that these samples contain neutrons.
OE1 OE2 OE3 Heart Testis Liver
OBP2B
CTSC
Lung Kidney
100 bp
ladder
100 bp
ladder
OMP
(a)
(b)
(c)
R86.4 Genome Biology 2007, Volume 8, Issue 5, Article R86 Zhang et al. />Genome Biology 2007, 8:R86
genes were not detected because they are expressed at similar
levels in all tissues, including olfactory epithelium [16].
Previous studies also noted anecdotal expression of individ-
ual human OR pseudogenes [11,14]. Of the 212 human OR
pseudogenes on the microarray, 142 (67%) were found to be
expressed in olfactory epithelium (Additional data file 1).
While considerable, this fraction is significantly lower than
the fraction of intact OR genes, 295 out of 366 (80%), found
to be expressed in olfactory epithelium (Fisher Exact test, P <
10
-3
; see Table 1 for results using alternative statistical cut-
offs). Moreover, intact OR genes appear to be expressed at a
higher level on average than OR pseudogenes (assuming that
the probe effect is canceled in large samples, such that we can
compare hybridization intensity across groups of probe-sets,
the mean difference in normalized intensity is +16%; Mann-
Whitney-U, P = 0.005). The more frequent and greater
expression of genes relative to pseudogenes is consistent with
recent observations in mice (XZ and SF, manuscript in prep-
aration). The observation of widespread OR pseudogene
expression in this study, as well as a number of others [11,14],
suggests that a nonsense-mediated decay RNA system
(reviewed in [26]) does not efficiently remove OR pseudogene
mRNAs.
On our array, we included only OR pseudogenes with one or
two premature coding region disruptions. These ORs are
likely to be recent pseudogenes, so that expression in olfac-
tory epithelium may not be unexpected. This said, the obser-
vation of widespread OR pseudogene expression has
implications for the outstanding question of how OR gene
expression is regulated in olfactory sensory neurons. A com-
mon model is one in which mature olfactory sensory neurons
are assumed to have a cellular mechanism that restricts the
expression to only one OR gene [27,28]. This model predicts
that a neuron expressing a pseudogene would eventually
switch to express a functional gene [27,28], while a functional
and an OR pseudogene would rarely be co-expressed. Thus, if
OR pseudogene expression is widespread, as our observa-
tions suggest, this implies that, at any given time, a large pro-
portion of neurons will not express functional genes and,
thus, will not contribute to the sense of smell. This prediction
is consistent with the small numbers of OR pseudogenes
found in species that rely heavily on their sense of smell [29].
An alternative model is that expression of OR pseudogenes in
olfactory sensory neurons occurs with the same probability as
expression of intact OR genes, but that the neurons express-
ing only a non-functional OR gene do not converge in the
olfactory bulb, never reach maturation and are removed [17],
Table 1
Number of expressed OR genes in human olfactory epithelium
P value* No. of detected OR genes and pseudogenes Only intact
†
Only pseudogenes
†
0.001 192 (33%) 131 (36%) 61 (29%)
0.01 342 (59%) 232 (63%) 110 (52%)
0.05 437 (76%) 295 (80%) 142 (67%)
*The statistical cutoff used to identify OR genes as expressed.
†
The number and percentage (in parenthesis) of intact OR genes and pseudogenes on
the array detected as expressed. The array includes probe-sets for 578 predicted human OR genes.
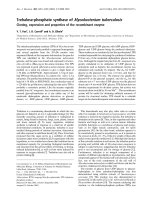
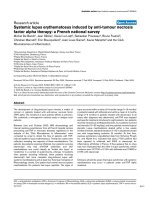
Expression profile of human OR genes across tissuesFigure 2
Expression profile of human OR genes across tissues. The log transformed
detection P values for OR genes in all tissues (from Additional data file 1)
were standardized to have mean 0 and standard deviation 1 and are color
coded (red and blue shades indicate values above and below the mean,
respectively). The dendrograms on top of each panel illustrate the
clustering (by hierarchical clustering in dchip [48]) of tissue samples based
on the profile of OR gene expression. (a) All 578 predicted OR genes are
included in a comparison between olfactory epithelium (OE) and the non-
olfactory tissues (see Materials and methods). (b) Shown are the data for
only the 147 OR genes with significantly elevated expression in non-
olfactory tissues.
(a)
(b)
Testis
Lung
Kidney
Heart
Liver
OE2
OE1
OE3
Testis
Lung
Kidney
Heart
Liver
Genome Biology 2007, Volume 8, Issue 5, Article R86 Zhang et al. R86.5
comment reviews reports refereed researchdeposited research interactions information
Genome Biology 2007, 8:R86
while neurons that co-express both a functional gene as well
as a pseudogene will converge in the olfactory bulb [17]. This
model does not rely on a cellular mechanism that restricts the
expression to only one OR gene. Accordingly, this model pre-
dicts that pseudogenes can be either co-expressed with a
functional gene, or are limited to young neurons that are
removed. This prediction is consistent with our observations
of a lower proportion and weaker expression of OR pseudo-
genes compared to intact genes. If true, it would suggest that
a considerable proportion of human olfactory sensory neuron
cells co-express a functional as well as an OR pseudogene.
Inter-individual variation in OR gene expression
Recent work suggested that the extensive genetic variation in
human OR protein coding regions (in particular, segregating
null mutations) may account for inter-individual variability
in the sense of smell [30,31]. Here, we also find evidence that
the repertoire of expressed OR genes varies across individuals
(Figure 3). Although our sample of only three olfactory epi-
thelium tissues is insufficient to quantify the variability in
human OR gene expression, it suggests that such variability is
abundant. Regardless of the statistical cutoff (10
-5
<P < 0.05)
employed to identify OR genes that are expressed in each
sample, the expressed OR gene repertoires of any pair of indi-
viduals differs by at least 14%. This number reflects technical
error as well as true inter-individual differences. However, we
do not observe significant differences in the expression of the
'house-keeping' genes across the olfactory epithelium tissues,
indicating that technical explanations are unlikely to account
for the difference in detection of OR gene expression across
these samples. Thus, our findings raise the possibility that, in
addition to differences in protein function, variation in the
regulation of OR genes also underlies phenotypic differences
in olfactory sensitivity between individuals. If so, studies of
the genetic basis of specific anosmia should include genetic
variants in OR gene promoter and putative control regions in
addition to coding region polymorphisms.
Expression of OR genes in non-olfactory epithelium
tissues
We detected OR gene expression in five non-olfactory tissues
by identifying genes whose expression is significantly ele-
vated in one or more tissues (see above for rationale). Our
approach is analogous to the one used by Zhang et al. [16],
who observed that, in mice, OR gene expression is lowest in
the vomeronasal organ (VNO), then used the expression lev-
els in this tissue as a background against which to compare
data from each of the other tissues. Since humans lack a clear
VNO [32], and we could not find a tissue in which OR gene
expression is clearly lower (Additional data file 1), we looked
for elevated expression in each individual tissue compared to
the distribution of expression levels across all the other tis-
sues (including the olfactory epithelium). Using our
approach, only 33 OR genes (Figure 2a; Additional data file 1)
were found to have significantly elevated expression in non-
olfactory tissues compared to olfactory epithelium (at an
adjusted P < 0.05; corrected for multiple testing in five tis-
sues). An obvious limitation of the approach is that if a gene
is expressed at similar levels in all tissues, we would not be
able to identify it as differentially expressed and hence would
not detect it as expressed. Reassuringly, however, although
our criteria for detection is somewhat different from that of
Zhang et al., our finding is consistent with their results in
mice in terms of the proportion of OR genes whose expression
is enriched in the studied non-olfactory tissues [16].
When we compared expression among the non-olfactory tis-
sues alone (that is, excluding the olfactory epithelium sam-
ples), we found 147 OR genes to have significantly elevated
expression in one or more tissues (Figure 2b; Additional data
file 1). We therefore considered the expression of these genes
to be detected in those non-olfactory tissues. When we used
RT-PCR on a sample of four genes in four tissues to validate
our results, we found only one instance in which we did not
confirm the findings of the array (Additional data file 4).
Since we expect 29/578 genes to be false positives (given the
statistical cutoff we used; P < 0.05), an error rate of 1/22
assays (4.5%) in the RT-PCR results for olfactory epithelium
and non-olfactory tissues is consistent with our expectation.
The RT-PCR also reveals expression in one case not detected
using the array (for OR2T1 in kidney). Again, this false nega-
tive is expected given the increased sensitivity of RT-PCR,
and the conservative criteria that we used to detect expression
from the microarray data.
We note that 32 of the ectopically expressed OR genes (iden-
tified by comparison only to other non-olfactory tissues) were
not identified as expressed in olfactory epithelium. This find-
ing raises a question as to the functional annotation of these
32 genes as odorant receptors. If these genes are only
expressed in non-olfactory tissues, they are unlikely to partic-
ipate in odorant recognition. Interestingly, while the only
existing hypothesis regarding additional functions of OR
genes is about a possible role in sperm chemotaxis [15], we
found that the tissues with the largest number of ectopically
expressed OR genes were actually the lung and heart (Table
2). These results are in agreement with previous observations
of ectopic expression of human OR genes based on ESTs and
genome-wide expression microarrays [14]. In addition,
although the approach used in [14] to analyze the microarray
data is different than the one we used, the overlap in the lists
of ectopically expressed OR genes in the two studies is signif-
icantly larger than expected by chance (P = 0.012; Additional
data file 2).
Do OR genes have additional functions?
Since the first observation of ectopic expression of OR genes
[12,13], it was hypothesized that odorant receptors may have
additional functions in non-olfactory tissues. We performed
evolutionary analysis of ectopically expressed OR genes in
order to test this hypothesis. Our basis is the recent
observation that genes expressed in a larger number of tis-
R86.6 Genome Biology 2007, Volume 8, Issue 5, Article R86 Zhang et al. />Genome Biology 2007, 8:R86
sues evolve under stronger evolutionary constraint compared
with genes that are expressed in one or a small number of tis-
sues [33,34]. This observation was interpreted to reflect the
greater number of evolutionary constraints imposed by the
need to optimize function in multiple tissues relative to the
functional constraints of expression in a single tissue.
By using a comparison of human-chimpanzee-rhesus orthol-
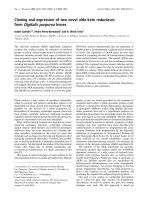
The number of predicted human OR genes whose expression was detected (at P < 0.05) in one or more of the three olfactory epithelium (OE) samplesFigure 3
The number of predicted human OR genes whose expression was detected (at P < 0.05) in one or more of the three olfactory epithelium (OE) samples.
As can be seen, there is a substantial difference in the expressed OR gene repertoire of each of the three OE samples.
249
38
22
16 42
41
21
Table 2
Number of expressed OR genes in non-olfactory epithelium tissues
Liver Heart Kidney Testis Lung
Enriched compared to non OE* 14 44 13 21 56
Enriched compared to OE
†
510 8 410
*Detected as expressed in each tissue based on elevated expression relative to all the other non-olfactory epithelium samples (at an adjusted P <
0.05).
†
Detected as expressed in each tissue based on elevated expression relative to the olfactory epithelium samples (at an adjusted P < 0.05)
Genome Biology 2007, Volume 8, Issue 5, Article R86 Zhang et al. R86.7
comment reviews reports refereed researchdeposited research interactions information
Genome Biology 2007, 8:R86
ogous OR genes (see Materials and methods), we found that
human OR genes that are also ectopically expressed do not
evolve under greater evolutionary constraint on the human
lineage (median Dn/Ds on the human lineage = 0.62) than
OR genes expressed exclusively in the olfactory epithelium
(median Dn/Ds = 0.64; Mann-Whitney U; one tailed P =
0.60). This observation suggests that ectopic expression of
human OR genes may not impose additional functional con-
straints on the odorant receptor protein. In addition, no sig-
nificant differences in Dn/Ds ratios were found when we used
protein domains (for example, specific trans-membrane
domains or the putative binding sites [35]), rather than the
entire coding region in our comparison (P > 0.32 for all com-
parisons). We note, however, that the individual protein
domains are short (17-45 residues), and hence did not accu-
mulate many substitutions along the human lineage; as a
result, the analysis of individual protein domains may be
underpowered to identify differences in selective pressures.
When we focused on homologous human and mouse OR
genes (we use the term 'homologs' instead of 'orthologs'
because determining orthology between human and mouse
gene families is not straight-forward; see Materials and meth-
ods for details), we further found that they are no more likely
to be ectopically expressed in the same tissue than expected
by chance. Specifically, we could not reject the null hypothesis
that homologous OR genes are expressed in heart, lung and
testis (the tissues included both in our study and in [16]) at
random (P = 0.55, P = 0.06, and P = 0.64 for a comparison of
OR genes expressed in heart, lung, and testis, respectively,
using a hyper-geometric distribution). Together, these obser-
vations suggest that the ectopic expression profiles of individ-
ual OR genes are not conserved across mammalian species. In
summary, although we cannot exclude the possibility that a
subset of OR genes have additional functions, overall, our
results point to the random expression of a large number of
mammalian OR genes in non-olfactory tissues with no func-
tional significance, possibly due to leaky promoters. Thus, our
results are consistent with the neutral explanation for ectopic
expression of OR genes proposed by [14]. The comparison of
ectopic OR gene expression variation within and between
species would help to test this hypothesis more directly
(reviewed in [36]).
Conclusion
We detected the expression of 437 predicted human OR genes
in olfactory epithelium, in support of their functional annota-
tion as odorant receptors. In contrast, at least 32 predicted
human OR genes may not be odorant receptors, as they
appear to be expressed exclusively in non-olfactory tissues. A
caveat is that, given the observed inter-individual variability
in OR gene expression, a subset of these 32 OR genes may be
expressed in other individuals. We also described abundant
ectopic expression of human OR genes. However, our evolu-
tionary analysis of ectopically expressed OR genes does not
lend support to the hypothesis that odorant receptors have
additional functions.
Materials and methods
The human OR gene microarray
We designed a custom Affymetrix human OR gene micro-
array with 1,561 probe-sets for 578 predicted human OR
genes. Each probe-set contains 11 perfect match probes of 25-
mers each, and 11 mismatch probes (in which a mismatch
nucleotide is introduced at the center of the probe). This
design is the same as for the commercially available Affyme-
trix genome-wide expression microarrays.
Since many OR genes are similar to each other at the coding
region level, cross hybridization may be an issue. In order to
avoid this problem, the expression of each human OR gene is
measured by an average of 2.7 probe-sets (range 1-10), with at
least one probe-set designed in predicted 3' untranslated
regions of the OR genes. Given their level of similarity, the
untranslated regions of OR genes are not expected to be
affected by cross-hybridization more than any random probe-
set on an Affymetrix array (Additional data file 5). In addi-
tion, we excluded from our analysis probes that Affymetrix
identified as more likely to be susceptible to cross-hybridiza-
tion, based on a whole genome search (this procedure did not
result in the exclusion of OR genes from the analysis).
The 578 OR genes that are represented on the array include
366 of the 379 (97%) predicted human OR genes with intact
full length (>270 residues) coding regions. The remaining 212
probe-sets were designed for human OR pseudogenes. Of the
212, eight are short sequences (less than 270 residues) that
contain no stop codon, and 120 contain only one stop codon
in the first 270 residues or more. If the mutation that causes
the stop codon is segregating in human populations (as is the
case for 26 of these single disruption OR pseudogenes [30]),
annotated pseudogenes may in fact be functional odorant
receptors in some individuals [30,37].
In addition to probes for OR genes, the microarray contains
probe-sets for 33 'house keeping' genes that can be used as
controls for hybridization quality, and for the normalization
of the arrays (Additional data file 6).
Hybridization and pre-processing of the data
Hybridizations and scanning of the arrays were performed at
the University of Chicago Functional Genomics Facility using
an Affymetrix GeneArray Scanner 3000. Since OR genes are
expected to be expressed mainly in olfactory epithelium, the
overall intensity of hybridizations with RNA from olfactory
epithelium is expected to be higher than the overall intensity
of hybridizations of RNA from other tissues. As a result,
standard normalization methods [38,39] would have the
effect of artificially inflating the estimates of the non-olfac-
tory epithelium expression levels to those seen in olfactory
R86.8 Genome Biology 2007, Volume 8, Issue 5, Article R86 Zhang et al. />Genome Biology 2007, 8:R86
epithelium [16]. Instead, we proceeded by performing a quan-
tile normalization on the raw intensity values of either the
olfactory epithelium or the non-olfactory epithelium tissues
separately, followed by an experiment-wide normalization,
based only on the Affymetrix control probe-sets and 20
probe-sets for non-OR genes (Additional data file 6). We then
used the robust multi-array average (RMA) algorithm [38] to
obtain one expression estimate for each probe-set (see Addi-
tional data file 6 for more details). RMA values for all human
OR gene probe-sets are available in Additional data file 3.
Statistical analysis
We fit the following linear mixed effects model:
R
ijk
=
α
i
+
β
j
+ ε
ijk
where we have suppressed the probe-set labels. Here, R
ijk
is
the normalized log transformed RMA value (of a particular
probe-set) for technical replicate k of a particular tissue sam-
ple j; the label i is used to indicate the tissue(s) used in the
comparison (for example, olfactory epithelia compared to
non-olfactory tissues). The term
β
is a random effect for the
tissue sample j, assumed to be uncorrelated with mean zero
and variance . The term
ε
ijk
is the residual error term
(technical variance), and is assumed to be uncorrelated with
mean zero and variance . We used this model to estimate
whether the difference in gene expression,
α
1
-
α
2
, between
olfactory epithelium and non-olfactory tissues is significantly
greater than zero (using a one-tailed t-test). We used the same
procedure to compare gene expression only among the non-
olfactory tissues (see Additional data file 6 for more details).
Analysis of OR gene orthologs
To identify human-chimpanzee-rhesus ortholog trios, we first
obtained the collection of rhesus OR genes. To do so, we used
117 representative OR protein sequences from human and
mouse [35] in tblastn [40] searches against the entire rhesus
genome sequence (downloaded from the human genome
sequencing center at Baylor college of medicine [41] on Feb-
ruary 17th 2006), and collected all results with an E-value
cutoff of 10
-4
. We then merged overlapping results and
obtained a set of 756 putative rhesus OR gene sequences
which were at least 300 bp long (YG and Orna Man, unpub-
lished results).
Human-rhesus reciprocal best hits were obtained by using
blastx [42] searches of each of the 756 rhesus OR gene
sequences (since a reliable translation of the rhesus
sequences could only be obtained at a later stage - see below)
against the human OR protein sequences (obtained from
build 41 of the HORDE database [43]), and by using tblastn
for the reciprocal searches. Human-chimpanzee reciprocal
best hits were obtained using two-way blastp [44] searches of
the two protein collections [45]. Finally, 360 human-chim-
panzee-rhesus clear ortholog trios were determined by merg-
ing human-chimpanzee and human-rhesus ortholog pairs
with a common human gene. The nucleotide sequences of
each trio were aligned using clustalW [46] with default
parameters, and the human protein sequence was used to cre-
ate an in-frame alignment that excludes stop codons and
insertions/deletions in the other species [45]. Using the
ortholog sequences of the three species, lineage-specific Dn/
Ds ratios were estimated using the codeml program from the
PAML package [47], with model number 1 (allowing a sepa-
rate Dn/Ds value for each lineage).
In contrast to the result for primates, only 218 human-mouse
clear orthologs [35] could be identified by using the reciprocal
best hit approach (because of the many gene duplications and
deletions since the human-mouse common ancestor). Of the
218, only 33 were shown to have ectopic expression in mice
[16]. This number is too small for an analysis of shared
expression profiles across species (see results). Instead, for
each of the mouse OR genes that were ectopically expressed
in [16], we identified the human OR gene with the highest
sequence similarity. While this analysis does not yield clear
orthologs, it reveals the most similar sets of human-mouse
homologous OR genes. In the absence of reciprocal best hits,
the same human gene might be assigned as the homolog of
more than one mouse OR gene. The consequence is that we
are less likely to observe common expression profiles between
mouse and human genes than if we could obtain a list of true
orthologs.
Electronic database information
All expression data and original CEL files were submitted to
the GEO database under the series accession number
[GSE5969].
Additional data files
The following additional data are available with the online
version of this paper. Additional data file 1 is a table of P val-
ues for all OR genes in all tissues. Additional data file 2
includes the calculation for the overlap of ectopically
expressed genes in our study and that of Feldmesser et al.
Additional data file 3 is a table of RMA values (in log scale) for
all probe sets from all hybridizations. Additional table 4 is a
figure of the RT-PCR validation of the microarray results.
Additional data file 5 is a figure of the analysis of co-similarity
of either the untranslated or the coding region probe-sets.
Additional data file 6 provides supplementary materials and
methods.
Additional data file 1P values for all OR genes in all tissuesP values for all OR genes in all tissues.Click here for fileAdditional data file 2Calculation for the overlap of ectopically expressed genes in our study and that of Feldmesser et al. [14]Calculation for the overlap of ectopically expressed genes in our study and that of Feldmesser et al. [14].Click here for fileAdditional data file 3RMA values (in log scale) for all probe sets from all hybridizationsRMA values (in log scale) for all probe sets from all hybridizations.Click here for fileAdditional data file 4RT-PCR validation of the microarray resultsRT-PCR validation of the microarray results.Click here for fileAdditional data file 5Analysis of co-similarity of either the untranslated or the coding region probe-setsAnalysis of co-similarity of either the untranslated or the coding region probe-sets.Click here for fileAdditional data file 6Supplementary materials and methodsSupplementary materials and methods.Click here for file
Acknowledgements
We thank O Man for her help with the analysis of rhesus sequences and A
Oshlack and M Przeworski for comments on the manuscript.
σ
β
2
σ
ε
2
Genome Biology 2007, Volume 8, Issue 5, Article R86 Zhang et al. R86.9
comment reviews reports refereed researchdeposited research interactions information
Genome Biology 2007, 8:R86
References
1. Buck L, Axel R: A novel multigene family may encode odorant
receptors: a molecular basis for odor recognition. Cell 1991,
65:175-187.
2. Ben-Arie N, Lancet D, Taylor C, Khen M, Walker N, Ledbetter DH,
Carrozzo R, Patel K, Sheer D, Lehrach H, et al.: Olfactory receptor
gene cluster on human chromosome 17: possible duplication
of an ancestral receptor repertoire. Hum Mol Genet 1994,
3:229-235.
3. Rouquier S, Taviaux S, Trask BJ, Brand-Arpon V, van den Engh G,
Demaille J, Giorgi D: Distribution of olfactory receptor genes in
the human genome. Nat Genet 1998, 18:243-250.
4. Glusman G, Bahar A, Sharon D, Pilpel Y, White J, Lancet D: The
olfactory receptor gene superfamily: data mining, classifica-
tion, and nomenclature. Mamm Genome 2000, 11:1016-1023.
5. Glusman G, Yanai I, Rubin I, Lancet D: The complete human
olfactory subgenome. Genome Res 2001, 11:685-702.
6. Zozulya S, Echeverri F, Nguyen T: The human olfactory receptor
repertoire. Genome Biol 2001,
2():research0018.1-research0018.12.
7. Young JM, Friedman C, Williams EM, Ross JA, Tonnes-Priddy L, Trask
BJ: Different evolutionary processes shaped the mouse and
human olfactory receptor gene families. Hum Mol Genet 2002,
11:535-546.
8. Zhang X, Firestein S: The olfactory receptor gene superfamily
of the mouse. Nat Neurosci 2002, 5:124-133.
9. Quignon P, Kirkness E, Cadieu E, Touleimat N, Guyon R, Renier C,
Hitte C, Andre C, Fraser C, Galibert F: Comparison of the canine
and human olfactory receptor gene repertoires. Genome Biol
2003, 4:R80.
10. Olender T, Fuchs T, Linhart C, Shamir R, Adams M, Kalush F, Khen
M, Lancet D: The canine olfactory subgenome. Genomics 2004,
83:361-372.
11. Sosinsky A, Glusman G, Lancet D: The genomic structure of
human olfactory receptor genes. Genomics 2000, 70:
49-61.
12. Parmentier M, Libert F, Schurmans S, Schiffmann S, Lefort A, Egger-
ickx D, Ledent C, Mollereau C, Gerard C, Perret J, et al.: Expression
of members of the putative olfactory receptor gene family in
mammalian germ cells. Nature 1992, 355:453-455.
13. Vanderhaeghen P, Schurmans S, Vassart G, Parmentier M: Molecular
cloning and chromosomal mapping of olfactory receptor
genes expressed in the male germ line: evidence for their
wide distribution in the human genome. Biochem Biophys Res
Commun 1997, 237:283-287.
14. Feldmesser E, Olender T, Khen M, Yanai I, Ophir R, Lancet D: Wide-
spread ectopic expression of olfactory receptor genes. BMC
Genomics 2006, 7:121.
15. Spehr M, Gisselmann G, Poplawski A, Riffell JA, Wetzel CH, Zimmer
RK, Hatt H: Identification of a testicular odorant receptor
mediating human sperm chemotaxis. Science 2003,
299:2054-2058.
16. Zhang X, Rogers M, Tian H, Zou DJ, Liu J, Ma M, Shepherd GM, Firest-
ein SJ: High-throughput microarray detection of olfactory
receptor gene expression in the mouse. Proc Natl Acad Sci USA
2004, 101:14168-14173.
17. Mombaerts P: Odorant receptor gene choice in olfactory sen-
sory neurons: the one receptor-one neuron hypothesis
revisited. Curr Opin Neurobiol 2004, 14:31-36.
18. National Disease Research Interchange [ire
source.org/]
19. Briand L, Eloit C, Nespoulous C, Bezirard V, Huet JC, Henry C, Blon
F, Trotier D, Pernollet JC: Evidence of an odorant-binding pro-
tein in the human olfactory mucus: location, structural char-
acterization, and odorant-binding properties. Biochemistry
2002, 41:7241-7252.
20. Buiakova OI, Krishna NS, Getchell TV, Margolis FL: Human and
rodent OMP genes: conservation of structural and regula-
tory motifs and cellular localization. Genomics 1994,
20:452-462.
21. Eisen MB, Brown PO: DNA arrays for analysis of gene
expression. Methods Enzymol 1999,
303:179-205.
22. Quackenbush J, Irizarry RA: Response to Shields: 'MIAME, we
have a problem'. Trends Genet 2006, 22:471-472.
23. Schadt EE, Li C, Ellis B, Wong WH: Feature extraction and nor-
malization algorithms for high-density oligonucleotide gene
expression array data. J Cell Biochem Suppl 2001:120-125.
24. Bolstad BM, Irizarry RA, Astrand M, Speed TP: A comparison of
normalization methods for high density oligonucleotide
array data based on variance and bias. Bioinformatics 2003,
19:185-193.
25. Draghici S, Khatri P, Eklund AC, Szallasi Z: Reliability and repro-
ducibility issues in DNA microarray measurements. Trends
Genet 2006, 22:101-109.
26. Chang YF, Imam JS, Wilkinson MF: The nonsense-mediated decay
RNA surveillance pathway. Annu Rev Biochem in press.
27. Serizawa S, Miyamichi K, Nakatani H, Suzuki M, Saito M, Yoshihara Y,
Sakano H: Negative feedback regulation ensures the one
receptor-one olfactory neuron rule in mouse. Science 2003,
302:2088-2094.
28. Shykind BM, Rohani SC, O'Donnell S, Nemes A, Mendelsohn M, Sun
Y, Axel R, Barnea G: Gene switching and the stability of odor-
ant receptor gene choice. Cell 2004, 117:801-815.
29. Gilad Y, Wiebe V, Przeworski M, Lancet D, Paabo S: Loss of olfac-
tory receptor genes coincides with the acquisition of full tri-
chromatic vision in primates. PLoS Biol 2004, 2:E5.
30. Menashe I, Man O, Lancet D, Gilad Y: Different noses for different
people. Nat Genet 2003, 34:143-144.
31. Menashe I, Lancet D: Variations in the human olfactory recep-
tor pathway. Cell Mol Life Sci 2006, 63:1485-1493.
32. Kouros-Mehr H, Pintchovski S, Melnyk J, Chen YJ, Friedman C, Trask
B, Shizuya H: Identification of non-functional human VNO
receptor genes provides evidence for vestigiality of the
human VNO. Chem Senses
2001, 26:1167-1174.
33. Winter EE, Goodstadt L, Ponting CP: Elevated rates of protein
secretion, evolution, and disease among tissue-specific
genes. Genome Res 2004, 14:54-61.
34. Khaitovich P, Hellmann I, Enard W, Nowick K, Leinweber M, Franz H,
Weiss G, Lachmann M, Paabo S: Parallel patterns of evolution in
the genomes and transcriptomes of humans and
chimpanzees. Science 2005, 309:1850-1854.
35. Man O, Gilad Y, Lancet D: Prediction of the odorant binding site
of olfactory receptor proteins by human-mouse
comparisons. Protein Sci 2004, 13:240-254.
36. Gilad Y, Oshlack A, Rifkin SA: Natural selection on gene
expression. Trends Genet 2006, 22:456-461.
37. Gilad Y, Lancet D: Population differences in the human func-
tional olfactory repertoire. Mol Biol Evol 2003, 20:307-314.
38. Irizarry RA, Hobbs B, Collin F, Beazer-Barclay YD, Antonellis KJ,
Scherf U, Speed TP: Exploration, normalization, and summa-
ries of high density oligonucleotide array probe level data.
Biostatistics 2003, 4:249-264.
39. Yang YH, Dudoit S, Luu P, Lin DM, Peng V, Ngai J, Speed TP: Nor-
malization for cDNA microarray data: a robust composite
method addressing single and multiple slide systematic
variation. Nucleic Acids Res 2002, 30:e15.
40. Altschul SF, Gish W, Miller W, Myers EW, Lipman DJ: Basic local
alignment search tool. J Mol Biol 1990, 215:403-410.
41. Human Genome Sequencing Center at Baylor College of
Medicine [ />42. Koonin EV, Altschul SF, Bork P: BRCA1 protein products: func-
tional motifs. Nat Genet 1996, 13:266-268.
43. Olender T, Feldmesser E, Atarot T, Eisenstein M, Lancet D: The
olfactory receptor universe - from whole genome analysis to
structure and evolution. Genet Mol Res 2004, 3:545-553.
44. Altschul SF, Madden TL, Schaffer AA, Zhang J, Zhang Z, Miller W, Lip-
man DJ: Gapped BLAST and PSI-BLAST: a new generation of
protein database search programs. Nucleic Acids Res 1997,
25:3389-3402.
45. Gilad Y, Man O, Glusman G: A comparison of the human and
chimpanzee olfactory receptor gene repertoires. Genome Res
2005, 15:224-230.
46. Chenna R, Sugawara H, Koike T, Lopez R, Gibson TJ, Higgins DG,
Thompson JD: Multiple sequence alignment with the Clustal
series of programs. Nucleic Acids Res 2003, 31:3497-3500.
47. Yang Z: PAML: a program package for phylogenetic analysis
by maximum likelihood. Comput Appl Biosci 1997, 13:555-556.
48. Eisen MB, Spellman PT, Brown PO, Botstein D: Cluster analysis
and display of genome-wide expression patterns. Proc Natl
Acad Sci USA 1998, 95:14863-14868.
49. Irizarry RA, Bolstad BM, Collin F, Cope LM, Hobbs B, Speed TP:
Summaries of Affymetrix GeneChip probe level data. Nucleic
Acids Res 2003, 31:e15.
50. Irizarry RA, Hobbs B, Collin F, Beazer-Barclay YD, Antonellis KJ,
Scherf U, Speed TP: Exploration, normalization, and summa-
ries of high density oligonucleotide array probe level data.
R86.10 Genome Biology 2007, Volume 8, Issue 5, Article R86 Zhang et al. />Genome Biology 2007, 8:R86
Biostatistics 2003, 4:249-264.
51. Gautier L, Cope L, Bolstad BM, Irizarry RA: affy - analysis of
Affymetrix GeneChip data at the probe level. Bioinformatics
2004, 20:307-315.
52. Gentleman RC, Carey VJ, Bates DM, Bolstad B, Dettling M, Dudoit S,
Ellis B, Gautier L, Ge Y, Gentry J, et al.: Bioconductor: open soft-
ware development for computational biology and
bioinformatics. Genome Biol 2004, 5:R80.
53. Gregersen PL, Brinch-Pedersen H, Holm PB: A microarray-based
comparative analysis of gene expression profiles during grain
development in transgenic and wild type wheat. Transgenic Res
2005, 14:887-905.
54. Bolstad BM, Irizarry RA, Astrand M, Speed TP: A comparison of
normalization methods for high density oligonucleotide
array data based on variance and bias. Bioinformatics 2003,
19:185-193.
55. Cui X, Churchill GA: Statistical tests for differential expression
in cDNA microarray experiments. Genome Biol 2003, 4:210.
56. Hedges LV, Olkin I: Statistical Methods for Meta-analysis Orlando, FL:
Academic Press Inc; 1985.