Báo cáo y học: " Gene expression variation in Down''''s syndrome mice allows prioritization of candidate genes" potx
Bạn đang xem bản rút gọn của tài liệu. Xem và tải ngay bản đầy đủ của tài liệu tại đây (621.29 KB, 14 trang )
Genome Biology 2007, 8:R91
comment reviews reports deposited research refereed research interactions information
Open Access
2007Sultanet al.Volume 8, Issue 5, Article R91
Research
Gene expression variation in Down's syndrome mice allows
prioritization of candidate genes
Marc Sultan
*
, Ilaria Piccini
*
, Daniela Balzereit
*
, Ralf Herwig
*
,
Nidhi G Saran
†
, Hans Lehrach
*
, Roger H Reeves
†‡
and Marie-Laure Yaspo
*
Addresses:
*
Max Planck Institute for Molecular Genetics, Ihnestr.63/73, 14195, Berlin, Germany.
†
Department of Physiology, Johns Hopkins
University School of Medicine, 725 N. Wolfe St., Baltimore, Maryland 21205, USA.
‡
McKusick-Nathans Institute of Genetic Medicine, 733 Nth.
Broadway, Johns Hopkins University School of Medicine, Baltimore, Maryland 21205, USA.
Correspondence: Marc Sultan. Email:
© 2007 Sultan et al.; licensee BioMed Central Ltd.
This is an open access article distributed under the terms of the Creative Commons Attribution License ( which
permits unrestricted use, distribution, and reproduction in any medium, provided the original work is properly cited.
Variation in Down syndrome genes<p>RNA from eight Ts65Dn mice (a model of Down syndrome) and eight euploid mice were analysed by real-time PCR to examine inter-individual gene expression levels as a function of trisomy.</p>
Abstract
Background: Down's syndrome (DS), or trisomy 21, is a complex developmental disorder that
exhibits many clinical signs that vary in occurrence and severity among patients. The molecular
mechanisms responsible for DS have thus far remained elusive. We argue here that normal
variation in gene expression in the population contributes to the heterogeneous clinical picture of
DS, and we estimated the amplitude of this variation in 50 mouse orthologs of chromosome 21
genes in brain regions of Ts65Dn (a mouse model of DS). We analyzed the RNAs of eight Ts65Dn
and eight euploid mice by real-time polymerase chain reaction.
Results: In pooled RNAs, we confirmed that trisomic/euploid gene expression ratios were close
to 1.5. However, we observed that inter-individual gene expression levels spanned a broad range
of values. We identified three categories of genes: genes with expression levels consistently higher
in Ts65Dn than in euploids (9, 17, and 7 genes in cerebellum, cortex, and midbrain, respectively);
genes whose expression levels partially overlap between the two groups (10, 9, and 14 genes); and
genes with intermingled expression, which cannot be used to differentiate trisomics from euploids
(12, 5 and 9 genes). Of the genes in the first category, App, Cbr1, and Mrps6 exhibited tight
regulation in the three tissues and are therefore attractive candidates for further research.
Conclusion: This is the first analysis addressing inter-individual gene expression levels as a
function of trisomy. We propose a strategy allowing discrimination between candidates for the
constant features of DS and those genes that may contribute to the partially penetrant signs of DS.
Background
Down's syndrome (DS) is caused by the presence of an extra
copy of chromosome 21 (Hsa21) and is the leading genetic
cause of mental retardation in the human population. More
than 80 clinical features can occur in DS [1-3] that affect vir-
tually all organs of the body. The majority of these features
are not present simultaneously in all individuals with DS, and
their severity varies considerably from one individual to
another.
Published: 25 May 2007
Genome Biology 2007, 8:R91 (doi:10.1186/gb-2007-8-5-r91)
Received: 18 July 2006
Revised: 23 February 2007
Accepted: 25 May 2007
The electronic version of this article is the complete one and can be
found online at />R91.2 Genome Biology 2007, Volume 8, Issue 5, Article R91 Sultan et al. />Genome Biology 2007, 8:R91
Analyses of partial trisomies in DS were instrumental in
establishing genotype-phenotype correlations [4-6]; how-
ever, the notion of a DS critical region (DSCR) has been chal-
lenged [7], and this approach failed to identify the genes and
associated pathways that contribute to the pathogenesis of
DS. Because of inherent problems that limit the use of human
samples, a number of molecular and behavioral studies have
made use of mouse genetic models of trisomy 21 that reflect
some critical phenotypic aspects of DS. The widely studied
Ts65Dn model [8,9] parallels several brain-related defects,
including quantitative cellular changes in regions of the hip-
pocampus [10,11], reduction in asymmetric synapses in the
temporal cortex [12], reduced volume and neuronal density in
the cerebellum [13], age-related degeneration of basal fore-
brain cholinergic neurons [14], and cognitive impairments,
especially in tasks mediated by the hippocampus [9,15-17].
It is reasonable to postulate that changes in expression levels
of the genes encoded on Hsa21 are primarily responsible for
triggering the pathogenesis observed in trisomy. By analyzing
RNAs pooled from several Ts65Dn mice in order to minimize
inter-individual variation, we and others demonstrated an
overall elevation in expression of approximately 1.5-fold for
nearly all transcripts of trisomic genes across multiple tissues
[18-20]. Bearing in mind that different methodologies were
used in these studies (cDNA arrays versus real-time polymer-
ase chain reaction [PCR] with TaqMan or Sybergreen) and
that mice at different developmental stages were analyzed,
this 1.5-fold elevation in expression is well established as a
consistent level in pooled RNAs. A similar magnitude of pri-
mary transcript effects was seen in human DS brain and heart
for averaged sample values [21]. This level of over-expression
is expected under the simplest model of gene regulation, in
which transcript level is directly proportional to the gene copy
number. More complex patterns could be expected in the case
of a trisomic gene that is regulated by a feedback mechanism
that involves a downstream product of that gene, or when it is
involved in regulatory circuits with the products of other tri-
somic genes.
Given that changes in gene dosage affect the expression levels
of virtually all genes present in three copies, it is reasonable to
assume that some of those genes will be neutral for organism
fitness, whereas others will exert pathological effects when
expression reaches a critical threshold above basal level.
However, it is not straightforward to predict which genes will
be deleterious when they are over-expressed modestly, even
with knowledge of the genes' functions. Among the most
pressing questions in DS research are as follows: which genes
contribute to specific, constant DS phenotypes (and which do
not), and what are the genetic factors that contribute to the
phenotypic variability between individuals? Identifying those
phenotypes that are associated with differences in gene
expression is essential to elucidating the molecular basis of
complex traits and disease susceptibility. A recent study [22]
showed that as many as 25% of all genes exhibit different
expression levels between ethnic groups. Quantitative analy-
ses of gene expression, such as microarrays and quantitative
PCR (qPCR), are frequently performed using pooling
schemes whose design masks the natural variation of gene
expression (sometimes referred as expression phenotype)
among individuals. It was previously hypothesized that tri-
somic genes that exhibit wide variation in expression among
individuals with DS would have less impact on the penetrance
of the phenotype, which is sin contrast to genes with a mod-
erate variation of expression [23]. Although a few studies con-
ducted in human or mouse have used RNA from individuals
rather than from pools [18,20,24,25], this issue of inter-indi-
vidual variation in gene expression has never directly been
addressed from the perspective of candidate genes for DS.
Here, we examine inter-individual differences in expression
for 50 mouse orthologs of Hsa21 genes (referred to herein as
'mmu21' genes) in three brain regions of Ts65Dn mice and
control littermates (euploids) by means of real-time PCR.
This analysis allowed prioritization of the candidate genes for
trisomic phenotypes.
Results
Expression of mmu21 genes in brain
Transcript levels of mmu21 genes were measured by qPCR in
the cerebellum, midbrain, and cortex of eight Ts65Dn and
eight control adult mice. Fifty mmu21 genes were tested, of
which 33 are triplicated and 17 are disomic in Ts65Dn. Exper-
iments were done in triplicate using two non-mmu21 refer-
ence genes that were previously tested for stability in each
tissue. For each gene, we calculated a normalized expression
value relative to the two reference genes (Additional data file
1).
A large majority of the mmu21 transcripts was found to be
active in brain. Forty-two genes (31 trisomic and 11 disomic)
were expressed in all three of the brain regions tested.
Whereas some of those genes were expressed at high levels in
all brain regions (for example, App, Son, S100b, Itsn, and
Dyrk1a), others were differentially expressed (for instance,
higher expression of Sh3bgr, Col18a1, Tiam1, Pde9a, and
S100b in cerebellum, and lower expression of Ncam2 in cere-
bellum; data not shown). Eight genes (Prss7, Cryaa, Kcne1,
Fam3b, Tff3, Tff2, Tmprss3, and C21orf56) were excluded
from further analysis because they had very low or undetect-
able levels of expression (for example, Ct > 34 cycles).
Gene dosage effects in Ts65Dn
For each mmu21 gene, we estimated the gene dosage effect in
a given tissue by comparing the ratio of the arithmetic mean
of the normalized expression values obtained for the eight
Ts65Dn mice with that of the mean of the eight euploids. This
value is referred to here as 'electronic' pool (e-pool). We con-
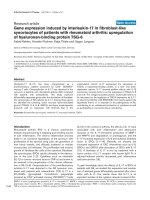
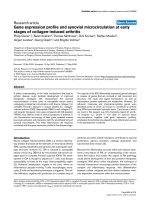
firmed a trend of 1.5-fold over-expression for the trisomic
genes (Figure 1), as reported previously for pooled RNAs from
Genome Biology 2007, Volume 8, Issue 5, Article R91 Sultan et al. R91.3
comment reviews reports refereed researchdeposited research interactions information
Genome Biology 2007, 8:R91
Ts65Dn and controls using arrays or real-time PCR [19].
Assuming that the ratio for diploid genes in trisomic mice ver-
sus euploid should be close to 1, the level of over-expression
was corrected by the value of slope obtained for the dupli-
cated genes. The global over-expression level of triplicated
genes in Ts65Dn was 1.44-fold in cerebellum, 1.37-fold in cor-
tex, and 1.39-fold in midbrain (Figure 1). We also performed
a direct measurement of expression levels for RNAs pooled
from the eight Ts65Dn and euploid mice, respectively (bio-
logic pools referred as b-pools). We observed a nearly perfect
correlation of the b-pools with the e-pools, suggesting that
experimental measurement errors are minimal (Figures 2b,
3b, and 4b and Additional data file 2).
Data presented here compare well with previously published
findings in Ts65Dn, in which investigations were performed
in an independent set of mice and with different chemistry
(TaqMan versus SYBR green or cDNA arrays) [19]. Indeed,
we observed a global correlation of 80% between the two
studies comparing the Ts65Dn/euploid ratios for pooled
RNAs using binned value ranges (see Materials and Meth-
ods). A direct comparison could not be made with the study of
Lyle and coworkers [18] because they measured expression
profiles in whole brain of RNAs from Ts65Dn mice at a differ-
ent age. However, they also reported an overall over-expres-
sion close to 1.5-fold for the trisomic genes in Ts65Dn.
We used pooling schemes with eight individual Ts65Dn and
control mice as a prerequisite to assess the robustness of our
measurements comparing e-pools and b-pools. We validated
the 1.5-fold over-expression of trisomic genes in Ts65Dn.
However, this value represents a global trend that does not
exhibit potential variations in gene expression between indi-
viduals. In the next step, we investigated the variation of
expression levels for the mmu21 genes in the eight trisomic
and control mice.
Variation of gene expression in the brains of Ts65Dn
and control mice
Analysis of individual samples allows recovery of important
information that cannot be determined from pooled samples.
We estimated the variation of gene expression between indi-
vidual mice by using the coefficient of variation (CV). We then
assessed whether the two populations (Ts65Dn and euploid)
differ significantly in terms of this variance by using the F-
test, and we applied the Wilcoxon test to judge whether the
differences in expression levels between Ts65Dn and euploid
animals were significant. Data are summarized in Additional
data file 3.
It was first important to evaluate the potential influence of
technical variation as compared with that of biological varia-
tion. We calculated technical variance based on the experi-
mental replicates and biological variance measured between
individuals in each group (Ts65Dn or euploid; see Materials
and methods [below] and Additional data file 3), similar to
analysis of variance estimations. We considered the percent-
age of technical variance over the total variance (technical +
Linear regression plots comparing trisomic and control animalsFigure 1
Linear regression plots comparing trisomic and control animals. For each plot corresponding to a given tissue, the linear regression for the triplicated
genes is in red, and that for the duplicated genes is in blue. Each gene was plotted using the average of its normalized expressions obtained from the
individuals of a group (Ts65Dn on the y-axis and euploid on the x-axis).
Cerebellum Cortex Midbrain
Triplicated genes (31)
Correlation: 0.9973
Slope: 1.44
Duplicated genes (11)
Correlation:0.9992
Slope: 1.00
Triplicated genes (31)
Correlation: 0.9995
Slope: 1.42
Duplicated genes (11)
Correlation:0.9911
Slope: 1.04
Triplicated genes (31)
Correlation: 0.9995
Slope: 1.38
Duplicated genes (11)
Correlation:0.9995
Slope: 0.99
Mean (euploid samples)
Mean (Ts65Dn samples)
Mean (euploid samples)
Mean (Ts65Dn samples)
Mean (euploid samples)
Mean (Ts65Dn samples)
R91.4 Genome Biology 2007, Volume 8, Issue 5, Article R91 Sultan et al. />Genome Biology 2007, 8:R91
Figure 2 (see legend on next page)
-9
-8 -7
-6
-5 -4 -3
-2 -1
1234
Nrip1
Usp25
Ncam2
Pde9a
Wdr4
Cbs
aa0179
Cstb
Col18a1
Lss
S100b
Mrpl39
Jam2
Gabpa
App
damts5
Usp16
Cct8
C21orf7
Cldn8
Tiam1
Ifnar2
Il10rb
Ifnar1
Ifngr2
Gart
Son
Itsn
Mrps6
Kcne2
21orf51
Runx1
Cbr1
C21orf5
Hlcs
Dyrk1a
Ets2
Dscr2
Sh3bgr
B3galt5
Bace2
Znf295
0.0 0.5 1.0 1.5 2.0 2.5
Nrip1
Usp25
Ncam2
Pde9a
Wdr4
Cbs
Kiaa0179
Cstb
Col18a1
Lss
S100b
Mrpl39
Jam2
Gabpa
App
Adamts5
Usp16
Cct8
C21orf7
Cldn8
Tiam1
Ifnar2
Il10rb
Ifnar1
Ifngr2
Gart
Son
Itsn
Mrps6
Kcne2
C21orf51
Runx1
Cbr1
C21orf5
Hlcs
Dyrk1a
Ets2
Dscr2
Sh3bgr
B3galt5
Bace2
Znf295
Nrip1
Usp25
Ncam2
Pde9a
Wdr4
Cbs
Kiaa0179
Cstb
Col18a1
Lss
S100b
Mrpl39
Jam2
Gabpa
App
Adamts5
Usp16
Cct8
C21orf7
Cldn8
Tiam1
Ifnar2
Il10rb
Ifnar1
Ifngr2
Gart
Son
Itsn
Mrps6
Kcne2
C21orf51
Runx1
Cbr1
C21orf5
Hlcs
Dyrk1a
Ets2
Dscr2
Sh3bgr
B3galt5
Bace2
Znf295
Cerebellum
(a) (b)
Genome Biology 2007, Volume 8, Issue 5, Article R91 Sultan et al. R91.5
comment reviews reports refereed researchdeposited research interactions information
Genome Biology 2007, 8:R91
biologic variance) as a quality measure. The inter-individual
variation in gene expression observed here can be attributed
mostly to biologic differences because for most genes the bio-
logical variance contributes to more than 90% of the total var-
iance (Additional data file 3). We could reliably detect
expression differences as small as 1.3-fold for nearly all of the
assays, because the average standard error of the mean for the
relative expression measurements was 0.14 in the 95% confi-
dence intervals.
We used the CV (see Materials and methods [below] and
Additional data file 3) as an indicator of the variation in gene
expression among individual mice in each group (Ts65Dn or
euploid). The CV, in contrast to the variance, is independent
of the gene expression level and thus enables inter-gene com-
parison. To group the CVs, we set arbitrary cut-offs defined as
a very low (CV < 0.1), low (CV < 0.2), moderate (CV between
0.2 and 0.5), and high (CV > 0.5) variation in gene expres-
sion. In control mice six genes exhibited a CV < 0.1, suggest-
ing that they are tightly regulated (Jam2 in cerebellum; App,
in midbrain; and App, Wdr4, S100b, Gabpa, and Mrps6 in
cortex). App was previously reported to exhibit highly varia-
ble expression in lymphoblastoid cell lines [26], but it appears
here to be tightly regulated, with a CV of 0.18 in cerebellum,
0.1 in cortex, and 0.09 in midbrain. Few genes (three, five,
and nine genes in cortex, midbrain, and cerebellum, respec-
tively) exhibit highly variable expression levels (CV > 0.5). In
Ts65Dn mice, 24 out of the 31 triplicated genes have CVs
below 0.2, suggesting that although their expression is ele-
vated, it remains relatively tightly regulated. None of the trip-
licated genes had CVs below 0.1. Only four triplicated genes
(Kcne2, C21orf7, Cldn8, and Sh3bgr) exhibit a systematic
high fluctuation in expression levels (CV > 0.5) across indi-
viduals and tissues. Among the disomic genes, two were
tightly regulated (CV < 0.1) in cortex (Wdr4 and Lss) and one
in the midbrain (Cstb). One disomic gene (Col18a1) exhibited
high variation in expression levels (CV > 0.5) among all brain
regions and in both groups (Ts65Dn and euploid).
For all of the trisomic genes, we plotted CVs for the Ts65Dn
population against the CVs for the euploid population (Addi-
tional data file 4). For most of the tested genes there is no sig-
nificant difference in the variation of expression levels
between trisomic and euploid mice, because 85 out of 93 data
points do not differ by more than 20% in CVs between the two
groups. On average, 90% of the trisomic genes exhibit low or
moderate variation in expression among groups. A few out-
liers, such as Kcne2 and C21orf7, exhibit dramatic variations
in expression among mice. Kcne2
, for example, was found to
be highly variable in all three brain tissues and in both groups
(Ts65Dn and euploid).
The variance in expression levels increases as gene expression
increases. This obscures the fact that, in proportion, the level
of variation is not greater. To determine statistically whether
the presence of an extra copy of a gene influences its variation
in expression level, we used the CV calculated with the F-test
to circumvent this artefact. We observed that, overall, the
amplitude of variation of gene expression did not differ signif-
icantly (P > 0.05) between euploid and Ts65Dn mice (Addi-
tional data file 3). The basal level of expression of a given gene
follows a Gaussian distribution of similar width in trisomic
and in euploid mice. This result confirms earlier findings in
fetal cortex of human trisomy 21 [24], at least as far as mmu21
genes are concerned. Three trisomic genes appeared to
exhibit variation that was significantly greater (P < 0.05) in
Ts65Dn than in euploid mice (Gabpa and Ifnar2 in the cor-
tex, B3galt5 in the cerebellum). Contrary to our expectations,
however, the CV was significantly smaller (P < 0.05) in tri-
somic mice for five trisomic genes (Ifnar2 and Kcne2 in cere-
bellum, Ets2 in cortex, and Usp16 and Cldn8 in midbrain).
Moreover, we see few disomic genes with significant differ-
ences in CV (P < 0.05) between the two groups in the cerebel-
lum; for S100b and Ncam2 the CV increases in Ts65Dn mice,
whereas it decreases for Lss.
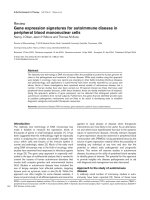
The expression levels of mmu21 genes in individual mice are
shown in Figures 2a, 3a and 4a, where we plotted for each tis-
sue the log ratios of the individual normalized gene expres-
sion values over the mean expression across all of the eight
mice. For the purposes of direct comparison, the correspond-
ing Ts65Dn/euploid gene expression ratios obtained from e-
pools and b-pools are indicated on the same figure for each
tissue (Figures 2b, 3b, and 4b). The figures enable identifica-
tion of the genes with expression that varies substantially
from those that are tightly regulated, and they demonstrate
whether the corresponding mean ratio reflects the variability
in gene expression in each tissue.
Finally, we evaluated the significance of the differences in
expression levels between Ts65Dn and euploid mice by apply-
ing the nonparametric Wilcoxon test, which is robust against
outlier values (Additional data file 3). For instance, in the
midbrain the Ts65Dn/euploid ratio values of two trisomic
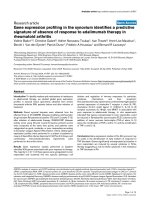
Relative expression and mean Ts65Dn/euploid ratio plots in cerebellumFigure 2 (see previous page)
Relative expression and mean Ts65Dn/euploid ratio plots in cerebellum. (a) For each of eight Ts65Dn mice (red crosses) and eight euploid mice (black
dashes), the log2 ratio of the individual normalized expression over the mean expression across all individuals is plotted on the x-axis. When values for
different individuals of a given population are very close, they cannot be distinguished on the graph. On the y-axis each expressed gene is represented in
chromosomal order. (b) We plotted the mean Ts65Dn/euploid ratios obtained by electronic pooling (red dashes) and the mean Ts65Dn/euploid ratio
obtained from a biologic pool (green dashes). The fold changes are given on the x-axis and the gene names on the y-axis. When values for different
individuals of a given population are the same, they cannot be distinguished on the graph. Names of genes that are triplicated in Ts65Dn are in bold and
disomic genes in grey.
R91.6 Genome Biology 2007, Volume 8, Issue 5, Article R91 Sultan et al. />Genome Biology 2007, 8:R91
Figure 3 (see legend on next page)
-9 -8 -7 -6 -5 -4 -3 -2 -1 1 2 3 4
Nrip1
Usp25
Ncam2
Pde9a
Wdr4
Cbs
a0179
Cstb
ol18a1
Lss
S100b
Mrpl39
Jam2
Gabpa
App
amts5
Usp16
Cct8
21orf7
Cldn8
Tiam1
Ifnar2
Il10rb
Ifnar1
Ifngr2
Gart
Son
Itsn
Mrps6
Kcne2
1orf51
Runx1
Cbr1
21orf5
Hlcs
Dyrk1a
Ets2
Dscr2
Sh3bgr
3galt5
Bace2
Znf295
0.0 0.5 1.0 1.5 2. 0 2.5 3.0 3.5
Nrip1
Usp25
Ncam2
Pde9a
Wdr4
Cbs
Kiaa0179
Cstb
Col18a1
Lss
S100b
Mrpl39
Jam2
Gabpa
App
Adamts5
Usp16
Cct8
C21orf7
Cldn8
Tiam1
Ifnar2
Il10rb
Ifnar1
Ifngr2
Gart
Son
Itsn
Mrps6
Kcne2
C21orf51
Runx1
Cbr1
C21orf5
Hlcs
Dyrk1a
Ets2
Dscr2
Sh3bgr
B3galt5
Bace2
Znf295
Cortex
(a) (b)
Genome Biology 2007, Volume 8, Issue 5, Article R91 Sultan et al. R91.7
comment reviews reports refereed researchdeposited research interactions information
Genome Biology 2007, 8:R91
genes are downregulated; these genes are C21orf7 (e-pool:
×0.68; b-pool: ×0.37) and Cldn8 (e-pool: ×0.55; b-pool:
×0.35; Figure 4). However, the distribution of the expression
levels among single mice is broadly dispersed. In these partic-
ular cases, the high CV values in each group (Additional data
file 3) and the nonsignificant P values of the Wilcoxon test (P
> 0.05) confirmed that pooled Ts65Dn/euploid ratios did not
reflect a genuine trend toward down-regulation at the level of
individual mice. However, it should be noted that this gene,
like Cldn8, is expressed at very low levels in brain. Similar
effects are observed for these genes in cerebellum and cortex.
Three trisomic genes that were previously reported not to
conform to the 1.5× rule, namely Bace2 in the cortex (×2.15),
Kcne2 (×3.39), and Sh3bgr (×0.55) in midbrain [19], fall into
the 1.5-fold range when analyzed as either b-pool or e-pool
(Figures 2b, 3b, and 4b). Interestingly, these genes are among
those that exhibit high variability in expression levels among
groups in at least one tissue (Figures 2a, 3a, and 4a). The most
extreme case of inter-individual variation in expression was
observed for Kcne2, for which the CV values where always
above 0.5 in all groups and all tissues. Both b-pool and e-pool
ratios for Kcne2 are in the 1.5-fold range in the midbrain,
whereas the apparent higher order upregulation in the cortex
(e-pool: ×2.71; b-pool: ×3.34), does not reflect the individual
expression levels spanning the largest range (Figures 2, 3, and
4). We observed that genes for which Ts65Dn/euploid ratios
are skewed in pooled RNAs are most often those with high
expression variation differences between mice. We conclude
from this that the pool value is at best indicative of high vari-
ation in gene expression level across mice, but that it does not
necessarily reflect a genuine upregulation or downregulation.
Two of the mmu21 disomic genes exhibited altered expres-
sion in our analysis. As in our previous study [19], Cbs RNA
levels were reduced in cerebellum (e-pool: ×0.54; b-pool:
×0.58), midbrain (e-pool: ×0.62; b-pool: ×0.58), and cortex
(e-pool: ×0.66; b-pool: ×0.59). For Cbs, a consistent and sig-
nificant trend toward downregulation (Figures 2, 3, and 4)
can be observed in all three brain tissues in individual mice.
Cbs is involved in the transsulfuration pathway and converts
homocysteine to cystathionine. Cbs deficiency can cause
homocysteinuria, which affects the central nervous system
among many other organs. Our data strongly suggest that Cbs
is downregulated in response to trisomy in Ts65Dn, although
we cannot determine whether it is directly or indirectly regu-
lated by other mmu21 genes.
Pool data indicated that Col18a1 was reduced in cerebellum
(e-pool: ×0.64; b-pool: ×0.50) and in midbrain (e-pool:
×0.68; b-pool: ×0.77). However, individual gene expression
levels for Col18A1 were broadly dispersed in these tissues,
and the two groups (Ts65Dn and euploid) are not clearly dis-
tinguishable (P > 0.05).
Stratification of trisomic genes based on brain gene
expression profiles
Three main categories of trisomic genes can be distinguished
from the normalized expression levels: genes whose expres-
sion levels in the eight Ts65Dn mice are clearly above those in
their euploid littermates (for instance, App in cortex or
Mrlp39 in midbrain), enabling a clear distinction between the
two populations; genes whose expression levels partially
overlap between the two populations of mice (for example,
Runx1 or C21orf5 in cerebellum); and genes with intermin-
gled expression between the two populations (for instance,
Bace2 or Kcne2 in cerebellum), which do not distinguish
Ts65Dn from euploid animals. As expected, all of the 11 dis-
omic genes tested here were found to be in the latter category
except Cbs (see above).
Based on the distribution of expression levels in the brain, the
three categories of mmu21 genes at dosage imbalance are pre-
sented in Figure 5. The first category contains genes whose
expression in an individual trisomic mouse was always signif-
icantly higher than in any euploid animal tested (P < 0.01). It
should be noted that in this first category we observed that,
for some genes, one individual out of the trisomic or control
group exhibited a slight overlap in its transcript level with
that of the second genetic group, although it was still associ-
ated with consistent and significantly elevated expression lev-
els in one group of mice as compared with the other (P < 0.01;
for example, Jam2 in cerebellum; Figure 2). Across the three
brain tissues, 20 genes exhibit expression levels significantly
higher in trisomic than in euploid mice. We speculate that
genes in this first category may have a greater penetrance in
the cerebellar phenotypes observed in mouse models of DS
[27-29] and may also be important candidates in structural
and functional deficits in the DS brain. Notably, three genes
(App, Cbr1, and Mrps6) belong to this highly differentiated
category for all three brain regions. Furthermore, many genes
in this category (for instance, Jam2, App, Cbr1, Cct8, Itsn,
Mrps6, and C21orf5) are conserved at least in Caenorhabditis
elegans and Drosophila melanogaster, and are tightly regu-
lated with a CV below 20% in trisomic or euploid, or both,
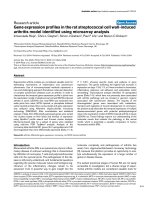
Relative expression and mean Ts65Dn/euploid ratio plots in cortexFigure 3 (see previous page)
Relative expression and mean Ts65Dn/euploid ratio plots in cortex. (a) For each of eight Ts65Dn mice (red crosses) and eight euploid mice (black
dashes), the log2 ratio of the individual normalized expression over the mean expression across all individuals is plotted on the x-axis. When values for
different individuals of a given population are very close, they cannot be distinguished on the graph. On the y-axis each expressed gene is represented in
chromosomal order. (b) We plotted the mean Ts65Dn/euploid ratios obtained by electronic pooling (red dashes) and the mean Ts65Dn/euploid ratio
obtained from a biologic pool (green dashes). The fold changes are given on the x-axis and the gene names on the y-axis. When values for different
individuals of a given population are the same, they cannot be distinguished on the graph. Names of genes that are triplicated in Ts65Dn are in bold and
disomic genes in grey.
R91.8 Genome Biology 2007, Volume 8, Issue 5, Article R91 Sultan et al. />Genome Biology 2007, 8:R91
Figure 4 (see legend on next page)
-9 -8 -7 -6 -5 -4 -3 -2 -1 1 2 3 4
Nrip1
Usp25
Ncam2
Pde9a
Wdr4
Cbs
Kiaa0179
Cstb
Col18a1
Lss
S100b
Mrpl39
Jam2
Gabpa
App
Adamts5
Usp16
Cct8
C21orf7
Cldn8
Tiam1
Ifnar2
Il10rb
Ifnar1
Ifngr2
Gart
Son
Itsn
Mrps6
Kcne2
C21orf51
Runx1
Cbr1
C21orf5
Hlcs
Dyrk1a
Ets2
Dscr2
Sh3bgr
B3galt5
Bace2
Znf295
0.0 0.5 1.0 1.5 2.0
Nrip1
Usp25
Ncam2
Pde9a
Wdr4
Cbs
Kiaa0179
Cstb
Col18a1
Lss
S100b
Mrpl39
Jam2
Gabpa
App
Adamts5
Usp16
Cct8
C21orf7
Cldn8
Tiam1
Ifnar2
Il10rb
Ifnar1
Ifngr2
Gart
Son
Itsn
Mrps6
Kcne2
C21orf51
Runx1
Cbr1
C21orf5
Hlcs
Dyrk1a
Ets2
Dscr2
Sh3bgr
B3galt5
Bace2
Znf295
Midbrain
(a) (b)
Genome Biology 2007, Volume 8, Issue 5, Article R91 Sultan et al. R91.9
comment reviews reports refereed researchdeposited research interactions information
Genome Biology 2007, 8:R91
indicating that these genes are important for development of
the organism. Two genes that are good candidates for neuro-
degenerative pathologies associated with DS are App, which
is mutated in some forms of Alzheimer's disease [30] and of
which the upregulation contributes substantially to degener-
ation of cholinergic neurons [31] and Itsn (Intersectin), which
is involved in clathrin-mediated endocytosis [32]. Jam2 is
associated with cell adhesion processes and Cct8 with protein
folding and degradation. C21orf5 is a new member of the
Dopey family and exhibits restricted regional brain expres-
sion [33].
The second category is populated by trisomic genes for which
expression levels are partially or totally intermingled between
the two populations of mice (P values between 0.01 and 0.05).
Overall, 22 genes are included in this category. However, of
these only two genes are found in all three brain tissues
(C21orf51 and Dscr2). In general, genes in this category
exhibit moderate variation in expression based on the CV. We
hypothesize that genes whose expression is more variable are
more likely to contribute to those pathogenic outcomes in DS
that exhibit variable expressivity.
The third class includes genes for which the expression levels
are intermingled between the two populations of mice (P >
0.05). Overall, 15 genes are included in this last category, and
among these five were found in the three tissues (Bace2,
C21orf7, Dyrk1a, Kcne2, and Sh3bgr). They all have moder-
ate to high expression variation based on the CV. Thus, those
genes may be less likely to contribute to constant trisomy-
related phenotypes. Genes whose expression levels vary
widely among individuals are more likely to reach a critical
threshold of over-expression in a subset of individuals, and
thus they might be more likely to be involved in phenotypes
that occur in some but not all individuals with trisomy 21. We
also observed notable behaviour differences between tissues.
Four genes (Ets2, Gabpa, Il10rb, and Tiam1) were found in
the first category for cortex, but were allocated to the third
category for cerebellum. Notably, in midbrain Ets2 was also
found in the first category whereas Gabpa, Il10rb, and Tiam1
were found in the second category. Either these genes are
tightly controlled in a tissue specific manner or more samples
must be analysed to assign them to one or the other group
with certainty.
Discussion
It is widely accepted that gene products at dosage imbalance
are the primary contributors to the trisomy phenotypes, act-
ing either directly or indirectly via disturbance of complex
regulatory networks. Characterizing these primary changes at
the transcriptome level is a first essential step toward the
identification of affected biochemical pathways associated
with trisomy 21.
We measured expression levels of 33 trisomic and 17 disomic
mmu21 genes in eight adult Ts65Dn and in eight euploid mice
to identify inter-individual variations in expression and
whether they were affected by trisomy. The simplest model of
trisomic gene actions predicts that expression level is propor-
tional to gene copy number. This '1.5× rule' was substantiated
by examining pooled RNAs in multiple tissues from several
individuals in independent analyses [18,19]. In the present
study we also assessed Ts65Dn/euploid gene expression
ratios in pools and corroborated previous findings using
pooled samples; specifically, most trisomic genes exhibit an
increased transcript level that is about 50% higher than in
euploid across tissues. Several specific instances of trisomic
genes that do not follow this rule were previously reported
[18,19]. Here we investigated the possibility that genes that
did not adhere to the expected 1.5-fold trend could arise from
the natural inter-individual gene expression variation by
evaluating the amplitude of gene expression at every tested
locus in RNA samples from individual mice.
Evaluation of individuals revealed variation of gene expres-
sion to fall in the range of 20% to 50% for most of the mmu21
genes, whereas only a few genes exhibit either tight regulation
(<20% variation in expression among individuals) or
dramatically different expression levels across individuals.
Consequently, Ts65Dn/euploid ratios must be interpreted
with caution. For instance, three genes that were previously
shown to escape the 1.5× rule, namely Bace2 in cortex and
Kcne2 and Sh3bgr in midbrain, exhibit wide inter-individual
variation, which could account for these skewed ratios.
Assessment of gene expression levels in individuals also pro-
vided further evidence for dysregulation of the disomic gene
Cbs in the three brain regions of Ts65Dn, regardless of the
inter-individual variation observed for Cbs.
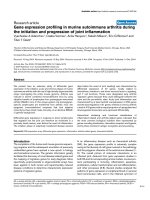
Relative expression and mean Ts65Dn/euploid ratio plots in midbrainFigure 4 (see previous page)
Relative expression and mean Ts65Dn/euploid ratio plots in midbrain. (a) For each of eight Ts65Dn mice (red crosses) and eight euploid mice (black
dashes), the log2 ratio of the individual normalized expression over the mean expression across all individuals is plotted on the x-axis. When values for
different individuals of a given population are very close, they cannot be distinguished on the graph. On the y-axis each expressed gene is represented in
chromosomal order. (b) We plotted the mean Ts65Dn/euploid ratios obtained by electronic pooling (red dashes) and the mean Ts65Dn/euploid ratio
obtained from a biologic pool (green dashes). The fold changes are given on the x-axis and the gene names on the y-axis. When values for different
individuals of a given population are the same, they cannot be distinguished on the graph. Names of genes that are triplicated in Ts65Dn are in bold and
disomic genes in grey.
R91.10 Genome Biology 2007, Volume 8, Issue 5, Article R91 Sultan et al. />Genome Biology 2007, 8:R91
Analyses of pooled RNAs minimize inter-individual varia-
tions and have been useful in providing an averaged measure
of over-expression level in trisomic tissues and to identify
possible outliers. Nonetheless, pooling schemes are also asso-
ciated with intrinsic errors (for instance, slight differences in
the RNA amount added to the pool), which may contribute to
additional variance. Even though methods have been
proposed for accurate analysis of data from large-scale DNA
pools [34], Ts65Dn/euploid ratios must be interpreted in
conjunction with the distribution of the gene expression val-
ues in trisomic and euploid individuals. We showed that lim-
itations to the technique (real-time PCR) were unlikely to be
a significant factor, because the techniques are sufficiently
sensitive to detect differences in expression values that are
substantially smaller than those observed.
As in most expression profiling studies, our data represent a
snapshot of the expression level in one individual at the time
of death. We cannot exclude the possibility that the expres-
sion of some genes may be sensitive to the local environment
(for example nutrition, temperature, stress, and light).
Inherent individual variations in the 'personal statistics' of
the mouse (weight, size, metabolite levels, for example), all of
which affect the number and proportions of cell types in tis-
sues and organs, may lead to changes in the RNA population
as well. Some of the variation in expression that we observe
may also reflect variation over time or cycling of gene expres-
sion levels. However, it is unlikely that cells are synchronized
throughout a complex tissue, and such effects are expected to
be averaged out for most genes. Ts65Dn is maintained as an
advanced intercross between the inbred B6 and C3H strains
and thus have some variability in genetic background. We
expect that the genetic contribution to differences in expres-
sion phenotypes is not large between strains of mice that are
relatively closely related (C3H and B6), and euploid/trisomic
variation in genetic background is further reduced by using
littermate pairs. Nonetheless, allelic variation between indi-
vidual Ts65Dn mice still represents a factor that must be
taken into account. At the same time, variations seen consist-
ently on the more robust genetic background are likely to be
representative of 'real' populations. Any or all of these factors
may contribute to the observed variation.
We, as have others previously [23], posit that this variation in
gene expression, which was masked in pools, may provide
insights into those genes that are involved in constant or var-
iable features of DS, especially when considered in light of a
threshold effect for gene dosage. Of course, the operative
mechanism will involve the actual quantity of a gene product
in a cell. This may become pathogenic once it passes a specific
threshold (or drops below a minimum concentration that is
necessary for its function). Although evolution has allowed
rather loose control of the expression of some genes, others
are under tight constraint. For example, it has been shown in
primates that expression level control is crucial during evolu-
tion, and that genes with higher inter-species and intra-spe-
cies variation will give rise to different functions and effects
more often than those that are very tightly controlled [35].
What is not clear, however, is the level of over-expression rel-
ative to the normal state that can be tolerated without ill
effects for a specific gene product, or how sharp the onset of
possible deleterious effects of over-expression could be.
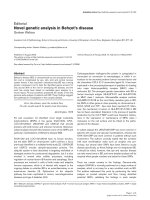
Gene categorization by phenotype penetranceFigure 5
Gene categorization by phenotype penetrance. Genes are grouped in
three categories, according to P value (Wilcoxon test) and the tissues in
which they were tested. The first category (left) shows genes with P <
0.01, meaning that the expression levels in Ts65Dn individual mice are
consistently different from euploids. The second category shows genes
with 0.01 <P < 0.05, for which the expression levels of Ts65Dn samples
partially overlap with euploids. The last category (P > 0.05) groups genes
for which the expression levels between Ts65Dn and euploid mice cannot
be distinguished. Genes in the first category might be responsible for the
fully penetrant signs in trisomy, genes in the second could contribute to
the variable signs, whereas the third category contains genes that may
make little or no contribution.
C
e
r
e
b
e
l
l
u
m
C
o
r
t
e
x
M
i
d
b
r
a
i
n
N
N
N
N
T
T
T
T
T
T
T
T
N
N
N
N
N
N
N
N
T
T
T
T
T
T
T
N
N
N
N
T
N
N
N
N
T
T
T
T
T
T
T
N
N
N
N
T
App
B3galt5
Cbr1
Cct8
Gart
Ifnar1
Itsn
Jam2
Mrps6
C21orf5 Usp16
C21orf51
Dscr2
Hlcs
Ifnar2
Ifngr2
Mrpl39
Runx1
Son
App B3galt5
Cct8 C21orf5
Ets2 Cbr1
Gabpa Il10rb
Hlcs Jam2
Ifnar1 Mrpl39
Ifnar2 Tiam1
Ifngr2 Usp16
Mrps6
Adamts5
C21orf51
Cldn8
Dscr2
Gart
Itsn
Runx1
Son
Znf295
Bace2
C21orf7
Dyrk1a
Kcne2
Sh3b
g
r
Mrpl39
Ifngr2
App
Cbr1
Ets2
Mrps6
C21orf5
B3galt5 Il10rb
C21orf51 Itsn
Cct8 Jam2
Dscr2 Tiam1
Gabpa Usp16
Gart
Hlcs
Ifnar1
Ifnar2
Adamts5 Znf295
Bace2
C21orf7
Cldn8
Dyrk1a
Kcne2
Runx1
Sh3bgr
Son
Adamts5 Sh3bgr
Bace2 Tiam1
C21orf7 Znf295
Cldn8
Dyrk1a
Ets2
Gabpa
Il10rb
Kcne2
Phenotypic penetrance
P < 0.01 P < 0.05 P > 0.05
Genome Biology 2007, Volume 8, Issue 5, Article R91 Sultan et al. R91.11
comment reviews reports refereed researchdeposited research interactions information
Genome Biology 2007, 8:R91
Our results demonstrate the importance of considering gene
expression in individuals, and this approach is even more
important in human samples, which exhibit greater genetic
background heterogeneity than do Ts65Dn mice. Normal var-
iation in gene expression plays a role in susceptibility to
complex diseases and likewise plays a potentially relevant
role in the phenotypic differences seen between individuals
with DS. Although DS presents highly variable clinical fea-
tures, some phenotypes are common to all, irrespective of
genetic background. We expect that these common features
derive from dysregulated gene expression that exhibits the
same pattern in all individuals. Here we identified three
classes of genes with different expression levels relative to
euploid. The first class is populated by genes whose expres-
sion levels are significantly higher in trisomic than in euploid
individuals. The second class is represented by genes with
partially overlapping expression levels between the two pop-
ulations, whereas genes with high degrees of intermingled
expression levels form the third class. We postulate that genes
in the first class represent good candidates for the constant
phenotypes of DS.
In this first, class Cct8 and Ifnar1 appeared to be tightly reg-
ulated in cerebellum and cortex. In a study investigating gene
expression variation in 40 human lymphoblastoid cells lines
[26], CCT8 and IFNAR1 also appeared to be tightly control-
led. This observation shows that, despite the fact that differ-
ent tissues were investigated, and given that lymphoblastoid
cell lines may not always reflect the situation in primary tis-
sues, the use of mouse tissue can be predictive of gene behav-
ior in human. However, we should keep in mind (as discussed
above) that even within a given organism, a specific gene may
appear tightly regulated in one tissue but not in another. Also,
we cannot exclude the possibility that this variation pattern
could change during development, but no data are currently
available to address this latter issue.
Three genes from the first category are common to cerebel-
lum, cortex, and midbrain (App, Cbr1, and Mrps6), identify-
ing these as strong candidate genes for Ts65Dn
neuroanatomic defects. Along this line, Salehi and colleagues
[31] recently reported evidence for a pathogenic mechanism
for DS in which increased expression of App (which encodes
the amyloid precursor protein) causes abnormal transport of
nerve growth factor, resulting in cholinergic neurodegenera-
tion in a mouse model of DS. In contrast, the genes whose tri-
somic expression levels overlap completely with euploid
appear less likely to be key players in the invariant features of
trisomy. Among those, we found that Kcne2 and Sh3bgr
exhibited a dramatic variation in expression level regardless
of ploidy. Expression levels for a number of genes fell between
these two extremes, as represented by the second category.
This may indicate the limit of precision for this method, but it
could also represent a pool of candidates for partially pene-
trant phenotypes. If the disomic level of a given gene is close
to a critical threshold, then elevated gene expression might be
deleterious only to those trisomic individuals with the highest
expression, contributing to variability in the occurrence of DS
features.
This approach provides a logical strategy for prioritizing can-
didate genes that are likely to contribute to the brain pheno-
types observed in Ts65Dn. The present analysis should be
consolidated further by an exhaustive expression analysis in a
large number of individuals at several stages of development.
It may be that the deleterious effect of overproduction of gene
products occurs mostly at a specific place and time during
development, when the level of the gene product is particu-
larly high. It also appears that variability in the levels of the
expression of a specific gene is a true characteristic of some
genes, which must be considered in a description of how ele-
vated expression of a particular gene contributes to pathogen-
esis in DS. The level of mRNA does not systematically reflect
the downstream protein amount but it is a good indicator.
Moreover, the lack of methods that are sensitive enough to
measure subtle differences in protein levels at a large scale
justifies the strategy used here.
Starting from the postulate that most of the trisomic genes are
over-expressed by a factor of 1.5, speculations on candidate
genes were initially based on the molecular function of the
genes. Favorite candidates include, for instance, tightly regu-
lated gene products that exert trans effects, such as the fol-
lowing: transcription factor complexes that establish
concentration gradients during development; molecules that
are involved in epigenetic mechanisms that modulate the
accessibility of DNA to the transcriptional machinery; recep-
tor-ligand-signal transduction systems; and proteins that
modulate the activity of other proteins. However, many genes
play a pivotal role in various cellular processes, and it is diffi-
cult to identify dosage-sensitive genes a priori. Dissection of
the molecular basis for aneuploid phenotypes will require a
massive body of information that is still largely incomplete,
including detailed gene expression patterns within develop-
ing organisms [33] and knowledge of genome-wide genetic
networks, as well as allelic contributions to variability in the
level, place and time of expression, and the variation in basal
gene expression levels in the population. An understanding of
the pathogenesis that produces features of DS will require
integration of this type of gene expression data with a quanti-
tative description of variable phenotypic outcomes in DS.
Mapping the regulators of Hsa21 genes in man and in mouse
is essential to elucidating the genetic basis of the variation of
gene expression and its contribution to pathogenesis in DS.
As shown here, stratification of populations by expression
profiling provides an essential dimension in the molecular
analysis of aneuploidy syndromes. Identifying the pathways
that are perturbed by trisomy will require thorough studies of
expression phenotypes at the level of a global transcriptome,
and integration of other large-scale experiments designed to
decipher gene regulatory networks.
R91.12 Genome Biology 2007, Volume 8, Issue 5, Article R91 Sultan et al. />Genome Biology 2007, 8:R91
Conclusion
The issue of natural gene expression variation in trisomy 21
has not previously been addressed directly, and to the best of
our knowledge this is the first report dealing with this impor-
tant issue, an appreciation of which is essential to our under-
standing of DS and aneuploidies in general. We describe a
strategy based on variation in gene expression to stratify the
chromosome 21 genes (or their orthologs), which are candi-
dates for the trisomy phenotypes. This is a novel dimension in
the search of culprit genes for DS that enables one to propose
a short list of putative candidates among the genes at dosage
imbalance.
Materials and methods
RNA extraction and reverse transcription
Total RNA was extracted from frozen tissues of Ts65Dn males
and their euploid male littermates using Trizol reagent (Inv-
itrogen, San Diego, CA, USA), following the manufacturer's
instructions. Animals were between 13 and 16 weeks old. RNA
was treated with RNase-free Dnase I, quantified by UV spec-
trophotometry, and its integrity was verified by gel electro-
phoresis. To create the sample pools, equal amounts of RNAs
from four euploid or four trisomic animals for each brain tis-
sue were pooled. RNA was transcribed into cDNA using ran-
dom hexamers and SuperscriptII reverse transcriptase
(Invitrogen). In total, 8 μg total RNA for each sample was
converted into cDNA in 8 × 1 μg reactions, pooled, and diluted
to 12.5 ng/μl equivalent total RNA.
Quantification strategy
For quantitative gene expression studies, we used pre-
designed, gene-specific TaqMan
®
probe and primer sets pro-
vided by Applied Biosystems (Foster City, CA, USA) (refer-
ences for each assay are given in Additional data file 1). All
assays met the amplification efficiency criteria of 100% ± 10%
(ApplicationNote 127AP05-02 [36]) and were comparable to
each other. For normalization purposes, 18 non-mmu21 con-
trol genes were tested on sample cDNA. We identified the
most stable genes across samples using the geNorm method
[37]. Thus, two genes (Hprt and Hmbs; Additional data file 1)
were selected and data were normalized to their geometric
mean. All assays were performed in triplicate. To minimize
intra-assay variation, the sample cDNA was premixed with
the PCR mastermix and distributed equally into each reac-
tion. For a given target gene all tissue samples were run on the
same reaction plate. This increases the accuracy of inter-indi-
vidual comparison, because the mRNA of interest is amplified
under the same PCR conditions in all tissue samples. To vali-
date the reproducibility of our system, one experiment
including two cDNA samples was duplicated. The correlation
between the two independent experiments was in excess of
99% (data not shown).
Real-time quantitative polymerase chain reaction
All reactions were set up in 10 μl volumes and used the Taq-
Man Universal PCR Master Mix (Applied Biosystems, Foster
City, CA, USA). Assays were processed with the ABI Prism
7900HT Sequence detection System (Applied Biosystems,
Foster City, CA, USA) under the following conditions: 50°C
for 2 min, 95°C for 10 min, and 40 cycles of 95°C for 15 s/60°C
for 1 min. Amplification plot and predicted threshold cycle
(Ct) values were obtained with the sequence Detection Soft-
ware (SDS 2.1; PE Applied Biosystems). Further calculations
and graphical representations were done using Excel 2000.
We verified that no correlation could be found between
threshold cycles (Ct) and expression ratios (Ts65Dn/
euploid), indicating that there was no systematic biases
within our real-time PCR results. Nonetheless, It should be
noted that when the Ct value increases above about 32, the
standard error also increases, indicating a loss of precision of
the replicate measurements.
Data analysis
A common threshold value was chosen for all genes and the
baseline was set manually for individual genes. The relative
expression calculation method relies on the principle of the
comparative Ct method (User Bulletin #2; Applied Biosys-
tems). Ct values were first normalized (ΔCt) to a geometric
mean of the two normalization genes and converted to a rela-
tive expression quantity (NE) using the formula NE = 2
-ΔCt
. A
given Ts65Dn/euploid ratio was calculated by dividing their
respective NE values. For electronic pool (e-pool) calculation,
the NE values for all individuals in a given group (Ts65Dn or
euploid) were averaged. For the analysis presented here, we
considered binned ratios of 0.8 to 1.2 to be neutral (no change
in expression), whereas binned values from 1.2 to 2.0 were
considered equivalent to 1.5-fold expression change.
In order to compute variation across a sample, we calculated
the coefficient of variation:
Here, is the mean expression and σ is the standard devi-
ation of eight samples in a group.
In order to estimate the technical variance (TechVar) and the
biological variance (BioVar) for each gene across the different
individuals and the different technical replicate measure-
ments, we used an analysis of variance-like approach:
CV
NE
=
σ
NE
TechVar NE NE
ij
i
j
J
i
I
=−
==
∑∑
(.)
1
2
1
BioVar J NEi. NE
i
I
=−
=
∑
()
2
1
Genome Biology 2007, Volume 8, Issue 5, Article R91 Sultan et al. R91.13
comment reviews reports refereed researchdeposited research interactions information
Genome Biology 2007, 8:R91
Where I is 8 (the size of the samples group), J is 3 (the tech-
nical replicate number), NE
ij
is the j-th replicate measure-
ment in the i-th individual, = mean NE for the ij-th
individual, and is the overall mean NE for all samples
and technical replicates.
The total variance (TotVar) is defined by the following
equations:
TotVar = TechVar + BioVar
For judging variance differences in the trisomic and euploid
samples, we applied an F-test for each gene. This test requires
the two samples to have a Gaussian distribution with the
same mean value. Therefore, we divided each individual
observation from a sample by the mean value of that sample
group prior to analysis. Small P values in the F-test indicate
whether there is a significant difference in expression
variation.
For each gene we performed statistical tests based on the rep-
licate signals in experiments with trisomic and euploid sam-
ples. Three standard tests were used in parallel: Student's t-
test, the Welch test, and Wilcoxon's rank-sum test. To evalu-
ate differential expression of the genes, P values of Wilcoxon's
rank-sum test were preferred as a reference because this test
does not depend for its validity on a specific distribution (for
example, Gaussian). Furthermore, this test is robust against
outlier values in the sample. A recursive function was imple-
mented to calculate the precise P values [38].
Additional data files
The following data are available with the online version of this
paper. Additional data file 1 provides a table listing the refer-
ences of the gene expression assay (Applied Biosystems) that
were used for quantitative RT-PCR experiments. Additional
data file 2 provides a figure of the correlation plot of intensi-
ties from electronic pools (y-axis) versus biologic pools (x-
axis) for each gene in the three brain tissues. Additional data
file 3 is a summary table listing the following information for
each gene and each brain tissue analyzed: gene names (tripli-
cated genes in Ts65Dn are in red), mean expressions (ME) of
Ts65Dn and euploid mice, standard errors of MEs, CVs of the
Ts65Dn and euploid samples, technical and biological vari-
ance, mean trisomic:euploid gene expression ratios from
electronic and RNA pools, and P values from t-test, tu-test,
Wilcoxon test, permutation test, and F-test. Additional data
file 4 is a scatter plot of CVs of euploid versus Ts65Dn mice in
brain tissues, in which the dotted lines represent the ± 20%
CV deviations from the ideal correlation (plain line).
Additional data file 1References of the gene expression assayProvided is a table listing the references of the gene expression assay (Applied Biosystems) that were used for quantitative RT-PCR experiments.Click here for fileAdditional data file 2Correlation plot of intensities from electronic versus biologic pools for each gene in the three brain tissuesProvided is a figure of the correlation plot of intensities from elec-tronic pools (y-axis) versus biologic pools (x-axis) for each gene in the three brain tissues.Click here for fileAdditional data file 3Summary table for each gene and each brain tissue analyzedProvided is a summary table listing the following information for each gene and each brain tissue analyzed: gene names (triplicated genes in Ts65Dn are in red), mean expressions (ME) of Ts65Dn and euploid mice, standard errors of MEs, CVs of the Ts65Dn and euploid samples, technical and biologic variance, mean tri-somic:euploid gene expression ratios from electronic and RNA pools, and P values from t-test, tu-test, Wilcoxon test, permutation test, and F-test.Click here for fileAdditional data file 4Scatter plot of CVs of euploid versus Ts65Dn mice in brain tissuesProvided is a scatter plot of CVs of euploid versus Ts65Dn mice in brain tissues. The dotted lines represent the ± 20% CV deviations from the ideal correlation (plain line).Click here for file
Acknowledgements
We thank Dr S Günther, Dr K Guegler, and Applied Biosystems for pro-
viding gene expression assays. This work was supported by the European
Union (EU; T21 target [QLG1-CT-2002-00816] and AnEUploidy [LSHG-
CT-2006-037627]), by the NGFN (National Genome Research Network),
by the US National Institutes of Health (HD038384 to RHR), and by the
Max Planck Society.
References
1. Epstein CJ: Down syndrome (trisomy 21). In The Metabolic and
Molecular Bases of Inherited Disease Edited by: Scriver CRE. New York,
NY: McGraw-Hill; 1995:749-794.
2. Van Cleve SN, Cannon S, Cohen WI: Part II: clinical practice
guidelines for adolescents and young adults with Down syn-
drome: 12 to 21 years. J Pediatr Health Care 2006, 20:198-205.
3. Van Cleve SN, Cohen WI: Part I: clinical practice guidelines for
children with Down syndrome from birth to 12 years. J Pediatr
Health Care 2006, 20:47-54.
4. Rahmani Z, Blouin JL, Creau-Goldberg N, Watkins PC, Mattei JF,
Poissonnier M, Prieur M, Chettouh Z, Nicole A, Aurias A, et al.: Crit-
ical role of the D21S55 region on chromosome 21 in the
pathogenesis of Down syndrome. Proc Natl Acad Sci USA 1989,
86:5958-5962.
5. Korenberg JR, Chen XN, Schipper R, Sun Z, Gonsky R, Gerwehr S,
Carpenter N, Daumer C, Dignan P, Disteche C, et al.: Down syn-
drome phenotypes: the consequences of chromosomal
imbalance. Proc Natl Acad Sci USA 1994, 91:4997-5001.
6. McCormick MK, Schinzel A, Petersen MB, Stetten G, Driscoll DJ,
Cantu ES, Tranebjaerg L, Mikkelsen M, Watkins PC, Antonarakis SE:
Molecular genetic approach to the characterization of the
'Down syndrome region' of chromosome 21. Genomics 1989,
5:325-331.
7. Olson LE, Richtsmeier JT, Leszl J, Reeves RH: A chromosome 21
critical region does not cause specific Down syndrome
phenotypes. Science 2004, 306:687-690.
8. Davisson MT, Schmidt C, Akeson EC: Segmental trisomy of
murine chromosome 16: a new model system for studying
Down syndrome. Prog Clin Biol Res 1990, 360:263-280.
9. Reeves RH, Irving NG, Moran TH, Wohn A, Kitt C, Sisodia SS,
Schmidt C, Bronson RT, Davisson MT: A mouse model for Down
syndrome exhibits learning and behaviour deficits. Nat Genet
1995, 11:177-184.
10. Insausti AM, Megias M, Crespo D, Cruz-Orive LM, Dierssen M, Vallina
IF, Insausti R, Florez J: Hippocampal volume and neuronal
number in Ts65Dn mice: a murine model of Down
syndrome. Neurosci Lett 1998, 253:175-178.
11. Lorenzi H, Reeves RH:
Hippocampal hypocellularity in the
adult Ts65Dn mouse begins early in development. Brain Res
in press.
12. Kurt MA, Davies DC, Kidd M, Dierssen M, Florez J: Synaptic deficit
in the temporal cortex of partial trisomy 16 (Ts65Dn) mice.
Brain Res 2000, 858:191-197.
13. Baxter LL, Moran TH, Richtsmeier JT, Troncoso J, Reeves RH: Dis-
covery and genetic localization of Down syndrome cerebel-
lar phenotypes using the Ts65Dn mouse. Hum Mol Genet 2000,
9:195-202.
14. Cooper JD, Salehi A, Delcroix JD, Howe CL, Belichenko PV, Chua-
Couzens J, Kilbridge JF, Carlson EJ, Epstein CJ, Mobley WC: Failed
retrograde transport of NGF in a mouse model of Down's
syndrome: reversal of cholinergic neurodegenerative
phenotypes following NGF infusion. Proc Natl Acad Sci USA 2001,
98:10439-10444.
15. Escorihuela RM, Fernandez-Teruel A, Vallina IF, Baamonde C, Lum-
breras MA, Dierssen M, Tobena A, Florez J: A behavioral assess-
ment of Ts65Dn mice: a putative Down syndrome model.
Neurosci Lett 1995, 199:143-146.
16. Holtzman DM, Santucci D, Kilbridge J, Chua-Couzens J, Fontana DJ,
Daniels SE, Johnson RM, Chen K, Sun Y, Carlson E, et al.: Develop-
mental abnormalities and age-related neurodegeneration in
a mouse model of Down syndrome. Proc Natl Acad Sci USA 1996,
93:13333-13338.
17. Demas GE, Nelson RJ, Krueger BK, Yarowsky PJ: Impaired spatial
working and reference memory in segmental trisomy
(Ts65Dn) mice. Behav Brain Res 1998, 90:199-201.
18. Lyle R, Gehrig C, Neergaard-Henrichsen C, Deutsch S, Antonarakis
NEi.
NE
TotVar NE NEi
ij
j
J
i
I
=−
==
∑∑
()
2
11
R91.14 Genome Biology 2007, Volume 8, Issue 5, Article R91 Sultan et al. />Genome Biology 2007, 8:R91
SE: Gene expression from the aneuploid chromosome in a
trisomy mouse model of Down syndrome. Genome Res 2004,
14:1268-1274.
19. Kahlem P, Sultan M, Herwig R, Steinfath M, Balzereit D, Eppens B,
Saran NG, Pletcher MT, South ST, Stetten G, et al.: Transcript level
alterations reflect gene dosage effects across multiple tis-
sues in a mouse model of Down syndrome. Genome Res 2004,
14:1258-1267.
20. Dauphinot L, Lyle R, Rivals I, Dang MT, Moldrich RX, Golfier G,
Ettwiller L, Toyama K, Rossier J, Personnaz L, et al.: The cerebellar
transcriptome during postnatal development of the Ts1Cje
mouse, a segmental trisomy model for Down syndrome.
Hum Mol Genet 2005, 14:373-384.
21. Mao R, Wang X, Spitznagel EL Jr, Frelin LP, Ting JC, Ding H, Kim JW,
Ruczinski I, Downey TJ, Pevsner J: Primary and secondary tran-
scriptional effects in the developing human Down syndrome
brain and heart. Genome Biol 2005, 6:R107.
22. Spielman RS, Bastone LA, Burdick JT, Morley M, Ewens WJ, Cheung
VG: Common genetic variants account for differences in
gene expression among ethnic groups. Nat Genet 2007,
39:226-231.
23. Antonarakis SE, Lyle R, Dermitzakis ET, Reymond A, Deutsch S:
Chromosome 21 and down syndrome: from genomics to
pathophysiology. Nat Rev Genet 2004, 5:725-738.
24. Mao R, Zielke CL, Zielke HR, Pevsner J: Global up-regulation of
chromosome 21 gene expression in the developing Down
syndrome brain. Genomics 2003, 81:457-467.
25. Saran NG, Pletcher MT, Natale JE, Cheng Y, Reeves RH: Global
disruption of the cerebellar transcriptome in a Down syn-
drome mouse model. Hum Mol Genet 2003, 12:2013-2019.
26. Deutsch S, Lyle R, Dermitzakis ET, Attar H, Subrahmanyan L, Gehrig
C, Parand L, Gagnebin M, Rougemont J, Jongeneel CV, et al.: Gene
expression variation and expression quantitative trait map-
ping of human chromosome 21 genes. Hum Mol Genet 2005,
14:3741-3749.
27. O'Doherty A, Ruf S, Mulligan C, Hildreth V, Errington ML, Cooke S,
Sesay A, Modino S, Vanes L, Hernandez D, et al.: An aneuploid
mouse strain carrying human chromosome 21 with Down
syndrome phenotypes. Science 2005, 309:2033-2037.
28. Olson LE, Roper RJ, Baxter LL, Carlson EJ, Epstein CJ, Reeves RH:
Down syndrome mouse models Ts65Dn, Ts1Cje, and
Ms1Cje/Ts65Dn exhibit variable severity of cerebellar
phenotypes. Dev Dyn 2004, 230:581-589.
29. Roper RJ, Baxter LL, Saran NG, Klinedinst DK, Beachy PA, Reeves
RH: Defective cerebellar response to mitogenic Hedgehog
signaling in Down [corrected] syndrome mice. Proc Natl Acad
Sci USA 2006, 103:1452-1456.
30. Selkoe DJ: Alzheimer's disease: genotypes, phenotypes, and
treatments. Science 1997, 275:630-631.
31. Salehi A, Delcroix JD, Belichenko PV, Zhan K, Wu C, Valletta JS, Taki-
moto-Kimura R, Kleschevnikov AM, Sambamurti K, Chung PP, et al.:
Increased App expression in a mouse model of Down's syn-
drome disrupts NGF transport and causes cholinergic neu-
ron degeneration. Neuron 2006, 51:29-42.
32. Keating DJ, Chen C, Pritchard MA: Alzheimer's disease and
endocytic dysfunction: clues from the Down syndrome-
related proteins, DSCR1 and ITSN1. Ageing Res Rev 2006,
5:388-401.
33. Gitton Y, Dahmane N, Baik S, Ruiz i Altaba A, Neidhardt L, Scholze
M, Herrmann BG, Kahlem P, Benkahla A, Schrinner S, et al.: A gene
expression map of human chromosome 21 orthologues in
the mouse. Nature 2002, 420:586-590.
34. Macgregor S, Visscher PM, Montgomery G: Analysis of pooled
DNA samples on high density arrays without prior knowl-
edge of differential hybridization rates. Nucleic Acids Res 2006,
34:e55.
35. Gilad Y, Oshlack A, Smyth GK, Speed TP, White KP: Expression
profiling in primates reveals a rapid evolution of human tran-
scription factors. Nature 2006, 440:242-245.
36. Applied Biosystems Homepage [liedbiosys
tems.com]
37. Vandesompele J, De Preter K, Pattyn F, Poppe B, Van Roy N, De
Paepe A, Speleman F: Accurate normalization of real-time
quantitative RT-PCR data by geometric averaging of multi-
ple internal control genes. Genome Biol 2002,
3:research0034.1-research0034.11.
38. Herwig R, Aanstad P, Clark M, Lehrach H: Statistical evaluation of
differential expression on cDNA nylon arrays with replicated
experiments. Nucleic Acids Res 2001, 29:E117.