Báo cáo y học: "Characterization and modeling of the Haemophilus influenzae core and supragenomes based on the complete genomic sequences of Rd and 12 clinical nontypeable strain" potx
Bạn đang xem bản rút gọn của tài liệu. Xem và tải ngay bản đầy đủ của tài liệu tại đây (763.43 KB, 18 trang )
Genome Biology 2007, 8:R103
comment reviews reports deposited research refereed research interactions information
Open Access
2007Hogget al.Volume 8, Issue 6, Article R103
Research
Characterization and modeling of the Haemophilus influenzae core
and supragenomes based on the complete genomic sequences of Rd
and 12 clinical nontypeable strains
Justin S Hogg
*†
, Fen Z Hu
*
, Benjamin Janto
*
, Robert Boissy
*
, Jay Hayes
*
,
Randy Keefe
*
, J Christopher Post
*
and Garth D Ehrlich
*
Addresses:
*
Allegheny General Hospital, Allegheny-Singer Research Institute, Center for Genomic Sciences, Pittsburgh, Pennsylvania 15212,
USA.
†
Joint Carnegie Mellon University - University of Pittsburgh Ph.D. Program in Computational Biology. 3064 Biomedical Science Tower
3, 3501 Fifth Avenue, Pittsburgh, Pennsylvania 15260, USA.
Correspondence: Fen Z Hu. Email: Garth D Ehrlich. Email:
© 2007 Hogg et al.; licensee BioMed Central Ltd.
This is an open access article distributed under the terms of the Creative Commons Attribution License ( which
permits unrestricted use, distribution, and reproduction in any medium, provided the original work is properly cited.
H. influenzae core-and supra-genome characterization<p>The genomes of 9 non-typeable <it>H. influenzae </it>clinical isolates were sequenced and compared with a reference strain, allowing the characterisation and modelling of the core-and supra genomes of this organism.</p>
Abstract
Background: The distributed genome hypothesis (DGH) posits that chronic bacterial pathogens
utilize polyclonal infection and reassortment of genic characters to ensure persistence in the face
of adaptive host defenses. Studies based on random sequencing of multiple strain libraries suggested
that free-living bacterial species possess a supragenome that is much larger than the genome of any
single bacterium.
Results: We derived high depth genomic coverage of nine nontypeable Haemophilus influenzae
(NTHi) clinical isolates, bringing to 13 the number of sequenced NTHi genomes. Clustering
identified 2,786 genes, of which 1,461 were common to all strains, with each of the remaining 1,328
found in a subset of strains; the number of clusters ranged from 1,686 to 1,878 per strain. Genic
differences of between 96 and 585 were identified per strain pair. Comparisons of each of the
NTHi strains with the Rd strain revealed between 107 and 158 insertions and 100 and 213
deletions per genome. The mean insertion and deletion sizes were 1,356 and 1,020 base-pairs,
respectively, with mean maximum insertions and deletions of 26,977 and 37,299 base-pairs. This
relatively large number of small rearrangements among strains is in keeping with what is known
about the transformation mechanisms in this naturally competent pathogen.
Conclusion: A finite supragenome model was developed to explain the distribution of genes
among strains. The model predicts that the NTHi supragenome contains between 4,425 and 6,052
genes with most uncertainty regarding the number of rare genes, those that have a frequency of
<0.1 among strains; collectively, these results support the DGH.
Background
Haemophilus influenzae is a Gram-negative bacterium that
colonizes the human nasopharynx and is also etiologically
associated with a spectrum of acute and chronic diseases.
There are six recognized capsular serotypes (a-f), but the
majority of clinical strains are unencapsulated and are
Published: 5 June 2007
Genome Biology 2007, 8:R103 (doi:10.1186/gb-2007-8-6-r103)
Received: 9 February 2007
Revised: 17 April 2007
Accepted: 5 June 2007
The electronic version of this article is the complete one and can be
found online at />R103.2 Genome Biology 2007, Volume 8, Issue 6, Article R103 Hogg et al. />Genome Biology 2007, 8:R103
referred to as nontypeable H. influenzae (NTHi). The type b
polysaccharide capsular variants (Hib) are associated with
invasive disease, particularly meningitis; however, the intro-
duction of a highly effective vaccine has nearly eliminated this
pathogen from developed countries. Recent studies have
demonstrated that the NTHi form biofilms on the respiratory
mucosa of humans and other mammals and it has been
hypothesized that this contributes to the chronicity of these
infections [1,2]. They are the most frequently detected patho-
gens associated with both the acute and chronic forms of oti-
tis media (OM) [3] and also are recognized as a seed pathogen
in a wide range of chronic polymicrobial infections of the res-
piratory mucosa, including the cystic fibrosis lung, chronic
obstructive pulmonary disease, tracheobronchitis, rhinosi-
nusitis, and mastoiditis [4,5].
The NTHi are naturally transformable and their genomes
demonstrate a high degree of plasticity among strains [4,6-
11]. Previous work from our laboratory has shown that
approximately 10% of the genes possessed by each clinically
isolated strain are novel with respect to the reference strain
Rd KW20 and that the distribution of these genes among the
strains is non-uniform [11]. Polyclonal NTHi populations
have been associated with chronic disease as well as with
nasopharyngeal carriage [4,12], while other researchers have
observed in situ horizontal gene transfer in diseased patients
[7,8,13]. The twin observations that the NTHi form biofilms
during chronic infections and that these infections are often
polyclonal suggests that multiple unique strains are co-local-
ized within an environment demonstrated to support greatly
elevated rates of horizontal gene transfer [14-18]. These cir-
cumstantial evidences suggest that a genetically diverse pop-
ulation may be important to the fitness of H. influenzae as a
human pathogen and that continuous horizontal gene trans-
fer among co-colonizing strains is the mechanism that gener-
ates the diversity observed in the population. It has been
hypothesized that this microbial diversity generation is the
counterpoint to the adaptive immune response of the mam-
malian host [19]. The distributed genome hypothesis (DGH)
states that the full complement of genes available to a patho-
genic bacterial species exists in a 'supragenome' pool that is
not contained by any particular strain, but is available
through a genically diverse population of naturally trans-
formable bacterial strains. The distributed genome is not a
phenomenon isolated to H. influenzae; comparative genomic
studies in other bacterial pathogens, including pneumococ-
cus and Pseudomonas aeruginosa, have demonstrated even
greater degrees of genomic plasticity among clinical strains
[20,21]. Moreover, evolutionary studies have demonstrated
that pneumococcus uses competence and transformation as a
pathogenic mechanism [22-24].
Testing of the DGH and its predictions will provide insight
into clinically relevant problems, such as antibiotic resist-
ance, chronic biofilm disease, and serotype-diverse species,
which readily adapt to standard vaccinations. Further charac-
terization of the H. influenzae supragenome is a prerequisite
to addressing these issues. In this regard we have sequenced
the genomes of 11 clinical NTHi isolates, 2 by standard clone-
based Sanger sequencing and 9 using the new 454-based
pyrosequencing technology. This dataset, combined with the
published genomic sequences of Rd and R2866, constitutes
the largest set of genomic data collected for H. influenzae to
date - the first step towards a characterization of the full com-
plement of genes that collectively define the H. influenzae
supragenome. In this paper we present a global comparative
analysis that characterizes the distribution of genetic diver-
sity among the strains.
Results
DNA sequence data
Table 1 lists the 12 H. influenzae clinical strains and the refer-
ence strain Rd, a largely non-pathogenic strain, used in the
comparative genomic studies described herein, their NCBI
locus tags, the location where the sequencing was performed,
and their clinical origins. Nine of the clinical strains were
sequenced using 454 LifeSciences novel pyrosequencing
technology [25]. The number of sequencing runs, the extent
of genomic coverage, and the number of contigs resulting
from first and in some cases second pass assemblies are tab-
ulated (Table 2).
Determination of gene clustering parameters
Gene clustering parameters for the grouping of homologs
were empirically determined by minimizing the change in the
number of clusters per change in the parameters (Figure 1).
We hypothesize that this minimum point coincides with the
best estimate threshold for distinguishing true orthologs
from functionally distinct homologs. Some homologs will be
more similar than 70%, while some orthologs will be more
divergent than 70%, but as a uniform criterion, the threshold
is optimized. Visual inspection of the clusters reveals that
most clusters are reasonable. Mosaic genes were particularly
difficult to cluster due to high levels of rearrangement. In the
remainder of the paper, genes in the same cluster are consid-
ered to be the same gene.
Enumeration of gene clusters and genic relationships
among NTHi strains
We identified 2,786 gene clusters among the 13 strains (Table
3). Of these, 52% were found in every strain (core genes) and
19% were found in only a single strain (unique genes). The
remaining 29% of genes were found in some combination of
two or more strains, but not all (distributed genes; Figure 2).
The number of clusters found per strain varied from 1,686 in
PittEE to 1,878 in PittII (Table 4). All strains possessed some
unique genes not seen in any of the other strains. A pair-wise
comparison was performed among all possible strain pairs,
which determined the mean number of genic differences
between any two strains was 395 with a standard deviation of
94 (Figure 3). This analysis also identified minimal and max-
Genome Biology 2007, Volume 8, Issue 6, Article R103 Hogg et al. R103.3
comment reviews reports refereed researchdeposited research interactions information
Genome Biology 2007, 8:R103
imal genic differences of 81 and 577, respectively, for the
strain pairs 2866:PittII and 2866:PittAA. The number of cod-
ing sequences identified per genome by AMIgene did not cor-
relate strongly with genome size. This is likely due to the
presence of split open reading frames (ORFs) in the 454
sequenced genomes as an analysis of the 4 completed
genomes showed a linear relationship between gene number
and genome size with an R
2
= 0.910. In contrast, the correla-
tion between total gene clusters and genome size is 0.86,
implying that the number of distinct genes found on the
genome is linearly related to the genome size.
A dendrogram based on non-core genic differences (Figure
4a) demonstrates the diversity in the NTHi population. A typ-
ical strain differs from its nearest neighbor by more than 200
genes. The strains collected from otitis media with effusion
(OME) patients at Children's Hospital in Pittsburgh (desig-
nated as Pitt strains) show that a genetically diverse popula-
tion can be isolated contemporaneously from a single
geographic location from patients with similar indications. In
contrast, two pairs of strains, PittEE/R2846 and PittII/
R2866 are relatively similar despite geographically distinct
points of isolation. Interestingly, the laboratory strain Rd
KW20 is not an outlier among the clinical strains. For com-
parison, a maximum likelihood tree was generated using
Table 1
Bacterial strains and sources used for whole genome sequencing, comparative genomics, and computation of the NTHi core and
supragenomes
NTHi strain NCBI locus tag prefix Sequence source Clinical source [reference]
Rd KW20 HI NCBI Lab strain, formerly serotype D [32]
86-028NP NTHI NCBI NP isolate from COM patient [33]
R2846 N/A SBRI OM isolate, St Louis [10,52]
R2866 N/A SBRI Blood isolate (meningitis), Seattle [10,53]
3655 CGSHi3655 CGS AOM isolate, Missouri [54, from A. Ryan]
PittAA CGSHiAA CGS OME isolate, Pittsburgh [11]
PittEE CGSHiEE CGS OME isolate, Pittsburgh [11]
PittGG CGSHiGG CGS Otorrhea isolate, Pittsburgh [11]
PittHH CGSHiHH CGS OME isolate, Pittsburgh [11]
PittII CGSHiII CGS Otorrhea isolate, Pittsburgh [11]
R3021 CGSHiR3021 CGS NP isolate [10]
22.4-21 CGSHi22421 CGS NP isolate, Michigan [12]*
22.1-21 CGSHi22121 CGS NP isolate, Michigan [12]*
AOM, acute otitis media; CGS, Center for Genomic Sciences; NP, nasopharyngeal; N/A, not available; OM, otitis media; OME, otitis media with
effusion; SBRI, Seattle Biomedical Research Institute.
Table 2
Sequencing data for the 9 Nthi strains sequenced with 454-technology
H. influenzae strain 40×70 plates
sequenced
454 read coverage No. of Newbler
contigs
PCR gap closure? 4 kb clone library? Final no. of contigs
3655 2 30× 59 No No 59
PittAA 1 23× 88 Yes No 38
PittEE 2 42× 49 Yes 4× cover 12
PittGG 1 21× 60 No Yes* 60
PittHH 2 48× 73 No No 73
PittII 1 16× 205 No Yes 205
22.4-21 1 19× 69 No No 69
R3021 2 35× 51 No No 51
22.1-21 1 19× 71 No No 71
*Clone library not incorporated in present analysis.
R103.4 Genome Biology 2007, Volume 8, Issue 6, Article R103 Hogg et al. />Genome Biology 2007, 8:R103
sequence from seven multi-locus sequence typing (MLST)
housekeeping genes for the same set of 13 strains (Figure 4b).
The topology of the trees is significantly different, both in
terms of pairwise groupings and overall structure.
The identified number of new genes and core genes found per
addition of each genome (as determined by incremental clus-
tering of the 13 strains) shows an exponentially decaying
trend in both cases (Figures 5 and 6). Qualitative inspection
suggests a diminishing return on new genes found in future
sequences, though it is expected that approximately 40 new
gene clusters will be found in each of the next few genomes
that are sequenced. The number of core genes appears to
trend towards a horizontal asymptote near 1,450 genes. A
quantitative analysis of these results is developed below in the
section 'Mathematical development of a finite supragenome
model'.
Whole genome alignments reinforce the great
diversity observed among gene clusters
Whole genome alignments were generated between Rd and
each of the 12 clinical strains to quantify genomic insertions
and deletions independently of gene identification (Table 5).
On average, each of the clinical strains had 127 genomic inser-
tions (>90 base-pairs (bp) in length) that did not correspond
to any Rd KW20 sequence. Similarly, each clinical strain con-
tained, on average, 147 genomic deletions (>90 bp) when
compared to the Rd KW20 strain. The average total length of
non-matching sequences between the 12 clinical strains and
Rd was 321 kb, approximately 18% of the genome. The quan-
tity of non-matching sequences reasonably accounts for the
average of 390 genic differences between strain pairs. Figure
7 shows a genomic region in which two different forms of an
insert, homologous to the plasmid ICEhin, have integrated
into the same site of two different genomes, but which is
wholly absent from the other strains in the alignment. Simi-
larly, a 40 kb contiguous region in Rd shows extensive dele-
tional diversity among seven of the clinical strains, with only
two of the clinical strains demonstrating the same local
genomic organization (Figure 8). Interestingly, the two
strains, PittAA and PittEE, that are similar in this region are
highly divergent overall (Figure 3). Genic diversity also exists
on a smaller scale. Figure 9 displays a 20 kb region from 7
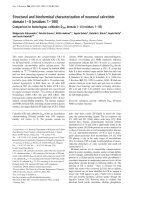
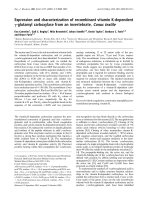
A plot of the total number of clusters as a function of clustering parameters shows an inflection point near 0.65 identity and 0.70 match lengthFigure 1
A plot of the total number of clusters as a function of clustering
parameters shows an inflection point near 0.65 identity and 0.70 match
length. The inflection, which minimizes the rate of change in the number of
clusters per change in parameters, suggests a set of parameters that
optimally segregates orthologs and paralogs.
0.3 0.4 0.5 0.6 0.7 0.8 0.9
1,800
2,000
2,200
2,400
2,600
2,800
3,000
3,200
0.3 match
length
0.5 match
length
0.7 match
length
0.9 match
length
Identity threshold
Total clusters
Table 3
Gene clustering results
Total gene clusters 2,786
Core gene clusters 1,461
Contingency clusters 1,325
Unique clusters 539
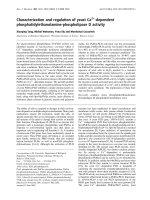
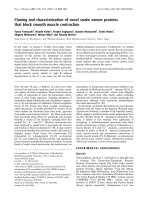
A histogram of gene clusters observed in exactly N of 13 H. influenzae strains compared to the expected number of genes estimated by the supragenome model (trained on all 13 strains)Figure 2
A histogram of gene clusters observed in exactly N of 13 H. influenzae
strains compared to the expected number of genes estimated by the
supragenome model (trained on all 13 strains). Over 1,400 genes were
observed in all 13 strains, indicating that there is a common core set of
genes. Distributed genes appear in variable numbers of strains, from 1 to
12. Overall, the model fits the data well, though it underestimated the
number of genes observed once and overestimated the number of genes
observed twice.
0
200
400
600
800
1,000
1,200
1,400
Predicted
Observed
Number of genomes in which gene is found
Number of genes
9
Genome Biology 2007, Volume 8, Issue 6, Article R103 Hogg et al. R103.5
comment reviews reports refereed researchdeposited research interactions information
Genome Biology 2007, 8:R103
clinical strains that shows 5 different combinations of posses-
sion and loss of the lic2C gene, the NTHI0683 gene, and the
UreABCEFGH operon.
Global genomic alignments of PittEE against R2846 and
R2866 were performed (Figures 10 and 11). PittEE and
R2846 are very similar at the global level and this is rein-
forced by the gene cluster analysis, which revealed only 96
genic differences. In contrast, R2866 has a large inversion
and several large insertions and deletions with respect to Pit-
tEE. This diversity at the global level corresponds to the 377
genic differences identified between these two strains by clus-
ter analysis (Figure 3). Global alignments were not visualized
for most strains since the ordering of the contigs had not been
determined.
Codon usage analysis
The codon usage of each gene cluster was compared to the
typical H. influenzae codon usage pattern by the epsilon-
score calculated by CodeSquare [26]. A low epsilon score indi-
cates that a gene's codon usage is similar to typical patterns of
the organism, while a high score indicates atypical codon
usage. Since the epsilon score is partially dependent on the
length of a coding sequence, all scores were normalized by
length. The average normalized score is 0 and low values con-
tinue to indicate typical codon usage. Figure 12 is a scatter
plot of the normalized epsilon scores versus the number of
strains in which the gene was found. The range of normalized
epsilon values is similar for core, distributed, and unique
genes, though the median values are slightly higher for dis-
tributed and unique genes (Tables 6 and 7). The Mann Whit-
ney U-test was employed to determine the significance of this
difference. To eliminate any remaining length bias, only
genes with lengths of 200-300 amino acids were analyzed.
The median normalized-epsilon value of core genes is signifi-
cantly smaller than the medians of distributed and unique
genes, and as a consequence, these non-core genes are more
likely to have foreign origins. Interestingly, there is no signif-
icant difference between distributed and unique genes and
most of these non-core genes display typical H. influenzae
codon usage.
Phage homology analysis
Phage insertion is a common origin of genomic diversity. The
influence of phage was quantified by a homology search
between all gene clusters and the NCBI NT database. A gene
cluster was said to be 'phage associated' if one of the top ten
significant matches was annotated as a sequence of phage ori-
gin. Overall, 9.3% of gene clusters were phage associated. The
distribution of these genes is not uniform among core and
non-core genes. Only 0.3% of core genes were phage associ-
ated, while 14.6% and 25.8% of distributed and unique genes,
respectively, were phage associated (Table 8).
Development of a finite supragenome model
The comparative genomic data presented above are support-
ive of the DGH and reinforces the concept that, at the species
level, there is an H. influenzae supragenome that is much
larger than the genome of any single individual strain, and
hence many strains must be sequenced to generate an accu-
rate picture of the species supragenome. Among the ques-
tions we may ask about the supragenome, the most obvious is,
how many strains must be sequenced to observe the entire (or
nearly all) of the supragenome?. The problem is similar to
determining the read coverage necessary to sequence an
entire individual genome using a random shotgun library
approach. Lander-Waterman statistics provide an answer in
the latter case by using the assumption that reads are inde-
pendently and randomly sampled from the genome with
equal probability. Previously, Tettelin et al. [27] developed a
Table 4
Gene identification and clustering results
H. influenzae strain Genome size (MB) No. of AMIgene CDSs found Total gene clusters Contingency gene clusters Unique gene clusters
Rd KW20 1.83 1,802 1,710 271 52
86028-NP 1.91 1,867 1,830 391 28
R2846 1.82 1,729 1,702 263 4
R2866 1.93 1,864 1,835 396 1
3655 1.85 1,880 1,819 380 62
PittAA 1.92 1,971 1,871 432 98
PittEE 1.80 1,762 1,686 247 19
PittGG 1.84 2,038 1,779 340 53
PittHH 1.83 1,931 1,783 344 45
PittHII 1.92 2,245 1,878 439 26
22.4-21 1.84 2,264 1,796 357 86
R3021 1.89 2,075 1,844 405 55
22.1-21 1.85 2,181 1,781 342 10
R103.6 Genome Biology 2007, Volume 8, Issue 6, Article R103 Hogg et al. />Genome Biology 2007, 8:R103
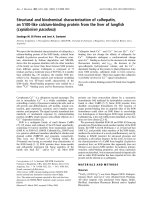
A pairwise genic comparison of 12 NTHi strains of H. influenzae and the reference strain Rd KW20Figure 3
A pairwise genic comparison of 12 NTHi strains of H. influenzae and the reference strain Rd KW20. The comparison of two strains is found at the
intersection of the row and column corresponding to the respective strains. Strains are compared based on the number of genes shared between the pair,
the number of genes found in one strain but not the other, and the number of shared genes that are unique to that pair of strains. A typical pair of strains
differs by 395 genes. Similar pairs of strains are shaded in yellow, while divergent strains are shaded orange.
86028 R2846 R2866 Hi3655 22.4-21 R3021 22.1-21
Category
1565 1564 1576 1567 1559 1553 1581 1571 1567 1557 1570 1576 Shared genes
145 146 134 143 151 157 129 139 143 153 414 339 ROW strain only
265 138 259 252 312 133 198 212 311 239 274 205 COL strain only
1 7 0 9 0 1 0 0 0 4 1 0 Pair unique
1584 1686 1594 1598 1589 1636 1591 1692 1594 1646 1654 Shared genes
246 144 236 232 241 194 239 138 236 184 176 ROW strain only
118 149 225 273 97 143 192 186 202 198 127 COL strain only
1 1 0 2 1 0 0 2 6 0 0 Pair unique
1578 1586 1584 1646 1565 1594 1571 1555 1588 1567 Shared genes
124 116 118 56 137 108 131 147 114 135 ROW strain only
257 233 287 40 214 189 307 241 256 214 COL strain only
0 0 0 12 2 0 0 0 13 0 Pair unique
1581 1568 1572 1602 1627 1816 1620 1669 1668 Shared genes
254 267 263 233 208 19 215 166 167 ROW strain only
238 303 114 177 156 62 176 175 113 COL strain only
0 0 0 0 0 46 0 3 0 Pair unique
1710 1581 1572 1611 1576 1566 1581 1571 Shared genes
109 238 247 208 243 253 238 248 ROW strain only
161 105 207 172 302 230 263 210 COL strain only
54 0 0 2 0 1 1 0 Pair unique
1581 1580 1612 1582 1570 1587 1588 Shared genes
290 291 259 289 301 284 283 ROW strain only
105 199 171 296 226 257 193 COL strain only
1 0 2 0 0 1 6 Pair unique
1563 1585 1562 1551 1573 1559 Shared genes
123 101 124 135 113 127 ROW strain only
216 198 316 245 271 222 COL strain only
1 0 0 0 0 0 Pair unique
1581 1606 1569 1597 1652 Shared genes
198 173 210 182 127 ROW strain only
202 272 227 247 129 COL strain only
Stats
3 0 4 0 0 Pair unique
Mean difference 395.3 1622 1605 1635 1597 Shared genes
Expected difference 389.9 161 178 148 186 ROW strain only
94.3 256 191 209 184 COL strain only
489.6 0 3 3 3 Pair unique
301.1 1620 1664 1689 Shared genes
258 214 189 ROW strain only
176 180 92 COL strain only
Color key
1 0 4 Pair unique
1599 1589 Shared genes
197 207 ROW strain only
245 192 COL strain only
7 1 Pair unique
Definitions
1592 Shared genes
Pair unique : genes present only in this pair of strains. 252 ROW strain only
Shared genes : genes present in both strains. 189 COL strain only
ROW strain only : genes present in the ROW strain, but not in column strain. 1 Pair unique
COL strain only
: total genes present in only one strain of the pair.
Strain
PittAA PittEE PittGG PittHH PittII
RD
86028
R2846
R2866
Hi3655
PittAA
PittEE
PittGG
PittHH
Stdev difference
Mean diff + 1 stdev
Mean diff - 1 stdev
PittII
Distant strains (diff > mean+1 stdev )
22.4- 21
Similar strains ( diff < mean-1 stdev )
: genes present in the COLumn strain, but not in row strain.
22.1- 21
Difference (diff)
No. of genes
supragenome model for S. agalactiae that, like Lander-
Waterman statistics, is based on the assumption that contin-
gency genes are independently sampled from the supragen-
ome with equal probability, except in the case of rare genes,
which are modeled as unique events that appear only once in
the entire global population. The model requires four param-
eters: the number of core genes, the number of contingency
genes, the probability of finding a contingency gene, and the
expected number of 'unique' genes found per strain. This
model predicted that the supragenome of S. agalactiae is infi-
nite in size (that is, the expected number of unique genes
found in each strain is non-zero). While the model is an
insightful attack on the problem, we question the assumption
that contingency genes are sampled in the population with
equal probability. It is important to compare the existing
model against a new model that does not rely on this assump-
tion.
The Supragenome is represented here by a generative model
that emits genomes according to a set of probabilistic rules.
Genome Biology 2007, Volume 8, Issue 6, Article R103 Hogg et al. R103.7
comment reviews reports refereed researchdeposited research interactions information
Genome Biology 2007, 8:R103
The supragenome contains N genes that are modeled as Ber-
noulli random variables with 'success' probabilities that cor-
respond to the population frequency of each gene. A genome
is generated by observing the Bernoulli variables: a gene is
present if the corresponding trial is a success and otherwise
absent. Each gene variable is assumed to be independent of
all other genes. This assumption is sometimes violated in real
H. influenzae genomes. For example, genomic islands are
sets of genes that are not independent. However, we proceed
with this assumption since it significantly reduces the com-
plexity of the model and is reasonable in many cases.
The true population frequencies are, in general, unknown.
Therefore, population frequencies are also treated in a prob-
abilistic fashion. It is assumed that there are K discrete
classes of genes. Each class k has an associated population
frequency, μ
k
. All genes in class k will have population fre-
quency μ
k
. Each of the N genes is assigned to a class according
to a probability distribution given by the vector π, where π
k
is
the probability that a gene is assigned to class k. Conceptually,
π
k
is the percentage of genes in the supragenome that have
population frequency μ
k
. The assignment of a gene to a class
is independent of all other gene assignments.
The complete model is depicted in plate notation in Figure 13.
'Z' is the hidden class variable in which z
n
corresponds to the
class of gene n. 'X' is the observed gene variable, where x
n,s
corresponds to the presence or absence of gene n in strain s.
The outer plate represents the supragenome, while the inner
plate represents instances of specific genomes. The model
requires 2 × K + 2 parameters: N, K, a mixture coefficient π
k
for each class, and a Bernoulli probability μ
k
for each class.
The number of gene classes, K, and their associated Bernoulli
probabilities, μ
k
, are fixed in advance. Care must be taken to
choose classes that represent low and high population fre-
quencies. Seven classes were selected for this study (K = 7)
with associated probabilities μ = <0.01, 0.1, 0.3, 0.5, 0.7, 0.9,
1.0>. The class with probability 1.00 represents 'core' genes
that appear in all strains.
The remaining parameters, N and π
k
, are selected under a
maximum likelihood scheme. Suppose that |S| genomes have
been sequenced and a particular gene from class k was
observed in n of the |S| strains. The probability of this obser-
vation is given by a binomial probability since this result is the
sum of independent Bernoulli variables. As a function of π
k
and N, the probability is given by:
However, we do not know the true gene class, so we must con-
sider a mixture of binomial probabilities:
Px nz k
S
nSn
kk
n
k
Sn
==
()
=
−
()
−
()
−
|,
!
!!
μμμ
1
Px n Px nz k Pz k
S
nSn
kk
k
K
k
k
K
=
()
===
()
⋅=
()
=
−
()
==
∑
|, | , |
!
!!
GG
πμ μ π π
11
∑∑
−
()
−
μμ
k
n
k
Sn
1
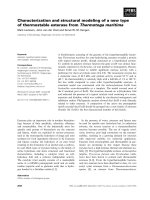
Plotting of relationships among the sequenced NTHi strains by gene sharing and multi-locus sequence typingFigure 4
Plotting of relationships among the sequenced NTHi strains by gene sharing and multi-locus sequence typing. (a) A dendrogram based on genic differences
among the 13 strains of H. influenzae. While several pairs of strains appear to be closely related, there is not a well-defined clade structure. The
dendrogram was generated using the unweighted pair group method with arithmetic mean (UPGMA) method [44-46]. The number on each branch
corresponds to the number of genic differences from the previous branch point. (b) A dendrogram based on sequence alignments of the seven MLST loci.
The tree was built using the maximum likelihood method implemented in fastDNAml. The number on each branch corresponds to the number of point
mutations per kilobase from the previous branch point. The topologies of the genic and MLST based trees are different. Most notably, strains PittEE and
R2846 are closely related in the genic dendrogram, but are separated in the MLST dendrogram. In other instances, such as PittII and R2866, the strains are
closely related in both trees.
PittEE
PittHH
R2846
Rd
PittAA
3655
22.4-21
22.1-21
PittGG
PittII
R2866
86-028NP
R3021
PittAA
3655
R2846
22.1-21
PittII
R2866
Rd
R3021
22.4.21
PittEE
86-028NP
PittGG
PittHH
12
10
10
4
8
12
11
6
6
5
13
4
6
43
4
2
5
3
1
2
2
3
144
96
158
33
127
135
135
204
128
128
43
114
41
41
191
154
(a)(b)
R103.8 Genome Biology 2007, Volume 8, Issue 6, Article R103 Hogg et al. />Genome Biology 2007, 8:R103
Table 5
Analysis of inserted and deleted Sequence in 12 strains with respect to Rd KW20
Reference: Rd KW20 86-028 R2846 R2866 3655 PittAA PittEE PittGG PittHH PittII 22.4-21 22.1-21 R3021
Number of insertions 118 107 115 139 136 136 119 124 158 131 128 118
Median insert length
(bp)
310 250 315 191 360 290 192 237 167 179 215 260
Mean insert length (bp) 2,076 1,199 2,041 1,248 1,245 961 1,419 1,408 879 1,274 959 1,869
Max insert length (bp) 55,275 13,119 53,044 15,789 20,222 9,796 28,306 32,587 11,085 14,983 10,810 58,706
Total insert length (bp) 244,946 128,290 234,704 173,459 169,310 130,683 168,840 174,636 138,906 166,923 122,721 220,535
Number of deletions 120 100 106 178 129 110 158 169 213 172 156 159
Median deleted length
(bp)
276 268 359 274 288 264 195 205 246 317 357 340
Mean deleted length
(bp)
1,254 1,354 1,128 900 1,339 1,340 816 874 708 990 898 938
Max deleted length
(bp)
41,022 34,677 41,021 17,858 38,501 33,544 38,506 38,367 41,021 41,022 41,021 41,022
Total deleted length
(bp)
150,491 135,377 119,612 160,262 172,723 147,451 128,936 147,689 150,857 170,262 140,021 149,079
All results are quantified with respect to Rd KW20.
The observed and expected number of new gene clusters found at the addition of each genome to the clustering datasetFigure 6
The observed and expected number of new gene clusters found at the
addition of each genome to the clustering dataset. Modeling predictions
are based on the eight strain training set (see 'Mathematical development
of a finite supragenome model').
12345678910111213
0
180
360
540
720
900
1,080
1,260
1,440
1,620
1,800
New
(model)
New (data)
Number of genomes
Number of genes
The expected number of total gene clusters and core gene clusters identified at the addition of each genome to the clustering datasetFigure 5
The expected number of total gene clusters and core gene clusters
identified at the addition of each genome to the clustering dataset.
Modeling predictions are based on the eight strain training set (see
'Mathematical development of a finite supragenome model'). The number
of genes observed in all strains levels off to an asymptote that corresponds
to a core set of genes. The rate of increase in total genes decreases, but
does not level off due to the discovery of rare genes.
1 2 3 4 5 6 7 8 9 10 11 12 13
1,400
1,650
1,900
2,150
2,400
2,650
2,900
core
(model)
total
(model)
core (data)
total (data)
Number of genomes
Number of genes
Core (model)
Core (data)
Total (model)
Total (data)
Genome Biology 2007, Volume 8, Issue 6, Article R103 Hogg et al. R103.9
comment reviews reports refereed researchdeposited research interactions information
Genome Biology 2007, 8:R103
Now consider the complete set of genes. Let c = <c
0
, c
1
, , c
S
>,
where c
n
is the number of genes observed that appear in
exactly n of |S| strains. The probability of the total observa-
tion is given by a multinomial distribution:
The parameters N and π can be determined by maximizing
the log-likelihood of the observation c:
The log-likelihood function was maximized by fixing N and
maximizing with respect to π. The maximization was per-
formed using the MATLAB function fmincon with the con-
straint:
and requiring that the coefficients are between 0 and 1. The
maximization was performed for values of N starting at the
minimum possible value (the number of genes actually
observed) to 6,000. The combination of N and π that maxi-
mized the overall log-likelihood was selected as the best
parameter estimate.
Supragenome modeling validation and results
The model was validated by training the supragenome
parameters using only the first 8 sequenced genomes and
Pc N
N
cc c
px n
N
cc c
s
n
S
C
s
n
G
GG
"
GG
"
|,,
!
!! !
|,
!
!! !
πμ πμ
()
==
()
=
=
∏
01
0
01
ππμμ
k
k
K
k
n
k
Sn
n
S
C
S
nSn
n
!
!!−
()
−
()
⎛
⎝
⎜
⎜
⎞
⎠
⎟
⎟
=
−
=
∑
∏
1
0
1
log log log logPc N N c c
S
nSn
n
n
S
n
n
S
k
G
GG
|,, ! !
!
!
πμ π
()
=−
()
+
−
()
==
∑∑
00
!!
k
K
k
n
k
Sn
=
−
∑
−
()
⎛
⎝
⎜
⎜
⎞
⎠
⎟
⎟
1
1
μμ
π
k
k
K
=
∑
=
1
1
A 40 kb region present in Rd KW20 shows two blocks of genomic variation among other strainsFigure 8
A 40 kb region present in Rd KW20 shows two blocks of genomic variation among other strains. The upstream block is bounded on the right by a frame-
shifted insertion sequence (IS) element (HI1018). The downstream block (HI1024-HI1032) includes genes with likely roles in sugar transport and
metabolism. Rd is used as a reference for the alignment, and sequence present in other strains without homology to Rd is not shown.
lspA thiP bioB tktA
lytB glpR gntP glpF tbpA araD lyx serB corA
1070kb 1075kb 1080kb 1085kb 1090kb 1095kb 1100kb
Rd KW20
22.1-21
R3021
PittGG
22.4-21
R2866
PittEE
22-1.21
A multi-sequence alignment using 86-028NP as a reference shows varying degrees of homology among 6 strains to a 50 kb region homologous to the plasmid ICEhin1056Figure 7
A multi-sequence alignment using 86-028NP as a reference shows varying degrees of homology among 6 strains to a 50 kb region homologous to the
plasmid ICEhin1056. The plasmid is integrated in 86-028NP and is partially present in R2866, but absent from the other strains in the alignment. Sequences
present in other strains without homology to 86-028NP are not shown.
86-028NP
PittAA
R2866
PittEE
R2846
Rd KW20
90kb 100kb 110kb 120kb 130kb 140kb 150kb
nrdD cysS metB ssb2 topB2 pilL thrA
tesB ppiB trxA dnaB2 radC2 tnpA tnpR thrC grk
ddh traC thrB
R103.10 Genome Biology 2007, Volume 8, Issue 6, Article R103 Hogg et al. />Genome Biology 2007, 8:R103
comparing the predictions with the observed results for 13
strains. The maximum likelihood number of genes was 3,078.
Of these genes, 1,423 are core genes, 417 are contingency
genes with population frequency >0.1, and 1,238 are contin-
gency genes with 0.1 population frequency. No genes were
predicted in the 0.01 population frequency class. Predictions
for the 0.01 class may be inaccurate due to the small sample
of 8 genomes. The 1/100 maximum likelihood confidence
interval for total genes ranged from 2,975 to 3,681. Figure 14
shows the distribution of the genes among the seven classes.
Figure 5 compares model predictions based on 8 strains to
actual observations of core genes (shared among the first N
strains) and total genes found after sequencing the 9th
through 13th strains. In both cases the model predictions fol-
low the observed trends. Figure 6 compares predictions to
observations of the number of new genes found in the Nth
sequenced strain. Again the model predictions follow the
Global alignment of R2866 and PittEE shows a large inversion and several regions unique to each strainFigure 11
Global alignment of R2866 and PittEE shows a large inversion and several
regions unique to each strain. The strains are similar across the majority of
the genome; however, there is one large inversion as well as several
regions unique to each strain.
0 0.2 0.4 0.6 0.8 1.0 1.2 1.4 1.6 1.8 Mb
PittEE
R2866
0 0.2 0.4 0.6 0.8 1.0 1.2 1.4 1.6 1.8 Mb
A 20 kb region that demonstrates strain diversity at the level of an individual gene (lic2C), a pair of genes (NTHi0683/4), and a group of seven functionally related genes (urease system)Figure 9
A 20 kb region that demonstrates strain diversity at the level of an individual gene (lic2C), a pair of genes (NTHi0683/4), and a group of seven functionally
related genes (urease system). 86-028NP is used as a reference for the alignment, and sequence present in other strains without homology to 86-028NP is
not shown.
rpoD aspA ureH ureG ureF ureC ureA groEL rplI priB infA ksgA apaH gnd zwf cysQ
ureE ureB groES rpsR rpsF lic2C lic2A devB
625k 630k 635k 640k 645k
86-028NP
PittAA
3655
Rd KW20
PittEE
PittHH
R2846
22-1.21
A global alignment of R2846 and PittEE as visualized by MummerplotFigure 10
A global alignment of R2846 and PittEE as visualized by Mummerplot. A
point is placed at the (x,y) coordinate if the x-coordinate of R2846
matches the y-coordinate of PittEE. Green matches indicate a reverse
complement match. It can be seen that PittEE and R2846 are similar at the
global level.
0 0.2 0.4 0.6 0.8 1.0 1.2 1.4 1.6 1.8 Mb
0
0
.2
0.4
0.6 0.8 1.0 1.2 1.4 1.6 1.8 Mb
Pitt EE
R2846
Genome Biology 2007, Volume 8, Issue 6, Article R103 Hogg et al. R103.11
comment reviews reports refereed researchdeposited research interactions information
Genome Biology 2007, 8:R103
observed trend. Figure 2 compares the best-fit gene distribu-
tion (based on 8 strain models) to the observed distribution of
genes found in exactly N of 13 strains. Overall, the predicted
trends follow the observed distribution; however, the predic-
tions were too low for genes seen in 1 of 13 strains, and too
high for genes seen in 2 of 13 strains. This bias may be due to
the small sample size (eight strains) used to train the suprage-
nome model. Predictions for genes seen in four to seven
strains were also somewhat lower than observed.
The supragenome model predicted an average of 1,776 genes
per strain with a standard deviation of 14 genes. Of the 13
strains, the average number of genes was 1,793 with a stand-
ard deviation of 62 genes. The model predicted an average of
373 different genes when comparing any two strains with a
standard deviation of 17 genes. Among the 13 sequenced
strains, the average was 395 with a standard deviation of 91
genes. In both cases the model predication for average was
reasonable, while the standard deviation was underestimated
by about four-fold. This suggests that the assumptions used
for the supragenome model may omit important sources of
variation. Genomic islands and other genes that appear
together in the genome likely contribute to the total variance.
Altogether, the above results show that the supragenome
model generates reasonable predictions for the average prop-
erties of the supragenome. To obtain improved predictions,
the model was re-trained on all 13 strains. The supragenome
class distribution for the extended model is shown in Figure
14. The results are similar to the model trained on 8 strains,
except that the class with population frequency 0.01 is now
predicted to contain 2,609 genes, while the 0.10 frequency
class was reduced in size to 590 genes. This large change is
due to improved resolution of rare genes in the 13 strain train-
ing set. The model now predicts 5,230 genes, with a 1/100
likelihood interval ranging from 4,425 to 6,052 (Table 9).
Nearly all of the increase over the eight strain model is due to
the class of rarest genes. Of these genes, 1,437 are core genes,
594 are contingency genes with population frequency >0.1,
and 3,199 genes are rare contingency genes with population
frequency <0.1. Figures 15 and 16 show the prediction trends
for total, core, and new genes observed after sequencing N
strains (up to 30 strains).
Discussion
Comparative genomic analyses were performed on 13 H.
influenzae strains, 12 clinical isolates and Rd, an acapsular
strain derived from a serotype d strain that is not typically
associated with disease. The results of these studies demon-
strated great genic diversity among the strains on average.
This genic diversity is visualized by a dendrogram con-
structed from the genic differences among strains (Figure 4).
A typical pair of strains varied by nearly 400 genes. A phylog-
eny constructed from MLST housekeeping genes also demon-
Table 7
Codon usage comparison of core, contingency and unique genes
Group Median epsilon Median length (amino acids)
Core -0.57 243
Contingency -0.01 252
Unique 0.16 248
Median epsilon scores and protein coding length for each category of
genes (includes genes of all lengths).
Table 6
Codon usage comparisons of core, contingency and unique genes
Group 1 Group 2 P value
Core Unique 5.34E-16
Core Distributed 4.95E-16
Core Non-core 6.55E-25
Contingency Unique 0.17
The Mann Whitney U-test for significant differences in median of
epsilon scores for each pair of gene groups. Only genes with a protein
coding length of 200-300 amino acids were tested to minimize length
bias. Median core epsilon scores are significantly different among the
three gene groups.
Codon usage of genes is quantified by a normalized epsilon score [26]Figure 12
Codon usage of genes is quantified by a normalized epsilon score [26].
Low epsilon scores indicate that a gene's codon usage is similar to the
typical H. influenzae codon usage pattern. The range of epsilon scores is
similar for all three classes of genes: unique, distributed and core.
However, the median scores are significantly different among the classes.
The observation that the distributions for non-core genes overlap with the
core genes suggests that many of the non-core genes have been evolving in
the same pool with the core genes.
012345678910111213
-2
-1
0
1
2
3
4
5
6
7
8
Number of strains which contain gene
N
or
malized epsilon score
R103.12 Genome Biology 2007, Volume 8, Issue 6, Article R103 Hogg et al. />Genome Biology 2007, 8:R103
strates a high degree of allelic diversity. However, the
topologies of the MLST and genic trees differ significantly.
This indicates that the genic sharing of non-core genes among
strains is not always related to the phylogenetic relationships
inferred from housekeeping genes. Rd was not an outlier in
either tree, suggesting that encapsulated strains share the
same supragenome. This reinforces previous research that
arrived at the same conclusion using other methods [11].
Cluster analysis revealed nearly 2,800 distinct genes among
these 13 strains, while modeling predicts that the species-
level supragenome will contain 5,000 or more genes and
require the analysis of several hundred strains to be complete.
A supragenome containing approximately 5,000 genes would
possess nearly three times the number of genes observed in
any single strain.
Slightly over half (1,437) of the gene clusters identified are
predicted to constitute a necessary set of core genes. The non-
core genes in each strain (356 on average) are composed of
distributed genes (present in more than one strain, but not all
strains) and unique genes that are not represented in any
The distribution of genes among gene classes in the supragenome model trained on 8 or 13 strainsFigure 14
The distribution of genes among gene classes in the supragenome model
trained on 8 or 13 strains. The only significant difference occurs in the rare
gene categories with frequency 0.01 and 0.10. A small sample of eight
strains is not expected to generate accurate predictions for these
categories.
0.01 0.10 0.30 0.50 0.70 0.90 1.00
0
300
600
900
1,200
1,500
1,800
2,100
2,400
2,700
8 strains
13 strains
Gene class population frequency
N
umber
of genes
Table 8
Percentage of genes with probable phage origin per category
Category Total genes Phage derived Percent phage
Unique genes (1 strain) 539 139 25.8%
Distributed genes (2-12 strains) 786 115 14.6%
Core genes (all strains) 1,461 4 0.3%
Totals 2,786 258 9.26%
A plate diagram of the H. influenzae supragenome modelFigure 13
A plate diagram of the H. influenzae supragenome model. Each node in the
diagram represents a random variable, and the arrows indicate
dependence between the variables. Independent, identically distributed
(IID) nodes appear in boxes with an index listed in the corner.
z
n
x
n,s
n,s
1 ≤ n ≤ N
Genome Biology 2007, Volume 8, Issue 6, Article R103 Hogg et al. R103.13
comment reviews reports refereed researchdeposited research interactions information
Genome Biology 2007, 8:R103
other H. influenzae strains. Genes in the core genome are
more likely to display typical H. influenzae codon usage pat-
terns and are rarely homologous to phage-related genes. In
contrast, the distributed genes and unique genes are more
likely to display atypical codon usage patterns for H. influen-
zae and are more likely to share homology with phage and
other bacterial species, but still the majority of these non-core
genes possess codon usage statistics similar to core genes. In
fact, out of a total of 736 distributed genes observed among
the 13 strains, less than 15% displayed any significant phage
homology. Hence, the core genome is wholly specific to H.
influenzae, while non-core H. influenzae-specific genes are
likely mixed with genes of foreign origin. The subset of con-
tingency genes with typical codon usage patterns and without
phage homology will be important candidates for functional
studies.
Among the 13 strains examined, 539 unique genes were iden-
tified. Our model predicts that most of these 'unique' genes
are derived from a pool of approximately 3,000+ low fre-
quency genes. Of these, 25% demonstrate sequence homology
to phage genes. The codon usage of these genes is often typi-
cal, but more likely than core and distributed genes to diverge
from H. influenzae patterns. The origin and importance of the
remaining 75% of the unique genes is unclear. Since these
genes have not been enriched in the population by positive
selection, it is uncertain whether these genes correspond to a
functional role in H. influenzae; however, previous studies
have demonstrated that 100% of the unique genes examined
are expressed as RNA transcripts [11]. It is possible that high
levels of horizontal gene transfer between organisms in the H.
influenzae environmental niche results in a number of
uncommon genes stranded at any particular time point in any
given strain. Evolutionary processes will remove genes not
providing a selective advantage over time, but this may be a
slow process in comparison to the acquisition of genes by hor-
izontal gene transfer. In other words, evolutionary processes
may be unable to 'empty the trash' quickly enough to elimi-
nate all non-useful genes simultaneously. The energetics pen-
Table 9
Maximum likelyhood estimate for size of supragenome and 1/100
likelihood intervals based on 8 and 13 strain training sets
Training set
8 strains 13 strains
Lower bound 2,975 4,425
MLE 3,078 5,229
Upper bound 3,681 6,052
A theoretical plot of the number of total genes and core genes expected among N sequenced H. influenzae genomes for future sequencing projectsFigure 16
A theoretical plot of the number of total genes and core genes expected
among N sequenced H. influenzae genomes for future sequencing projects.
The extrapolation may not hold for strains isolated outside of North
America since the plot was constructed using only North American
isolates. The number of core genes approaches an asymptote, which
reflects a common set of genes present in all natural isolates.
0 5 10 15 20 25 30
1,400
1,600
1,800
2,000
2,200
2,400
2,600
2,800
3,000
3,200
3,400
Number of genomes
Number of genes
Core
Total
A theoretical plot of the number of new genes expected to be found in the Nth genome for future H. influenzae sequencing projectsFigure 15
A theoretical plot of the number of new genes expected to be found in the
Nth genome for future H. influenzae sequencing projects. The plot was
generated using strains isolated in North America, and the extrapolation
may not hold for isolates from other geographic locales if some distributed
genes are geographically isolated. The model predicts that the number of
new genes found in a strain will diminish 20 after sequencing 30 strains,
and the number will trend toward 0 as the number of sequences becomes
large.
0 5 10 15 20 25 30
0
25
50
75
100
125
150
175
200
225
250
275
300
New genes
Number of genomes
Number of genes
R103.14 Genome Biology 2007, Volume 8, Issue 6, Article R103 Hogg et al. />Genome Biology 2007, 8:R103
alty imposed by a single non-useful gene is likely to be small,
yet the cumulative effect of many such genes could be signifi-
cant. A balance between the rate of gene acquisition by HGT
and negative selection due to energetics is a likely mechanism
contributing to the maintenance of the overall genome size. It
is also possible that many of these unique genes are recent
functional additions to the NTHi supragenome, but have not
yet had time to become widely dispersed. There are a number
of environmental factors that have been profoundly altered
over the past half century that could account for this, includ-
ing widespread antibiotic usage and high density human day-
care for infants, which results in much higher rates of
polymicrobial respiratory infections.
Our clustering methods were designed to minimize bias due
to frame shifts and assembly gaps. Nonetheless, the number
of clusters identified with these methods may contain some
such bias. Sequencing errors may induce frame shifts that
split a gene into two fragments. Clusters of orthologous genes
(COGs) is a common method for identifying gene orthologs
across a wide range of species. The COG method is able to dis-
criminate between closely related paralogs by using only bi-
direction best homology matches (BBH) while constructing
clusters [28,29]. Since the COG method requires BBH, if a
split ORF is present, only one of the fragments will cluster
with the full length gene. This results in orphaned 'genes',
which inflate the number of gene clusters observed. To
resolve this issue, we implemented a less restrictive clustering
algorithm that uses uni-direction homology matches above a
minimum sequence identity and a minimum fraction of the
length of the shorter gene. Furthermore, six-frame gapped
translations are used during homology searches to minimize
the impact of sequencing errors. The disadvantage of our
approach is that paralogs may cluster together if the sequence
identity is above the threshold. However, since the genes
under consideration are from the same species, the orthologs
are expected to be highly homologous in comparison to para-
logs.
Accurate clustering depends on careful selection of parame-
ters. We started with the observation that sequence identity
among orthologs is higher, on average, than among paralogs.
To find the best parameters, we examined a plot of the
number of clusters as a function of the parameters (Figure 1).
In the case of the identity parameter, a low threshold will
cause all paralogs to group together, which results in a small
number of clusters. As the threshold increases, the number of
clusters increases as paralogs are segregated into distinct
ortholog classes. When the threshold passes the peak of the
paralog distribution, the rate at which clusters split is
reduced. But, as the threshold increases further, ortholog
clusters begin to split, and the number of clusters increases
more rapidly. At 100% identity threshold, all but the most
highly conserved orthologous clusters have been split apart.
Figure 1 reveals an inflection point in the region between 60%
and 70% identity where the slope is decreasing and then
starts to increase. The inflection point suggests that an iden-
tity threshold of 70% defines the best partition between para-
logs and orthologs. Analogous reasoning was employed in
determining the match length threshold.
Another bias may be introduced by the use of unfinished
genomes in this study. Despite assembly gaps, the likelihood
that an entire gene is missing from the sequence is low due to
the high coverage (>25×, on average) generated by the 454
sequencing method. Lander-Waterman statistics predict that
more than 99.9% of each genome was sequenced. Most gaps
are due, therefore, not to missing sequences but rather the
difficulty of assembling repeat sequences. On average, 1,769
gene clusters were found per completed genome versus 1,804
for unfinished genomes. This difference is most likely due to
real genomic differences as supported by metabolomic stud-
ies (data not shown), but in the worst case the difference is an
upper bound on the error.
An important consequence of our supragenome model is that
the observed diversity among the H. influenzae strains can be
adequately explained by a finite model. This contrasts with
conclusions drawn from models built for the pathogen S. aga-
lactiae [27]. Our study does not contradict previous analysis,
but emphasizes that conclusions are dependent on modeling
assumptions and the species in question. While it is tempting
to assume the supragenome of a naturally transformable spe-
cies draws from the nearly infinite pool of genomic diversity
found in nature, several factors make it likely the pool is quite
restricted. The first barrier is environment. In the case of H.
influenzae, only species that co-habitate in the human respi-
ratory mucosa are available for genetic exchange on a regular
basis. The second barrier is a set of mechanistic restrictions
built into the transformation system. Uptake of DNA is
enriched by the presence of uptake signal sequences, which
are commonly present in H. influenzae genomic DNA but are
not common in other species [30,31]. After uptake, sequence
homology is necessary for efficient incorporation of DNA into
the chromosome via homologous recombination. Conse-
quently, most HGT events among H. influenzae are expected
to derive from its own population and to a lesser degree from
genetically similar species residing in the same environmen-
tal niche. Our model predicts a pool of rare genes in the range
of approximately 2,700 genes - this may reflect the number of
genes available to the organism from genetically similar spe-
cies living in the same environmental niche. This reasoning
does not exclude the potential importance of rare HGT events
between distantly related species on an evolutionary time-
scale.
While a global analysis of the supragenome is important, the
ultimate goal is an understanding of the phenotypes associ-
ated with individual genes and combinations of genes and
how these contribute to the process of disease. The sequence
data obtained from this study will serve as a valuable tool in
this endeavor. The collection of genes identified here will be
Genome Biology 2007, Volume 8, Issue 6, Article R103 Hogg et al. R103.15
comment reviews reports refereed researchdeposited research interactions information
Genome Biology 2007, 8:R103
used to construct a supragenome hybridization (SGH) chip,
analogous to a eukaryotic comparative genomic hybridization
(CGH) chip. The SGH chip will be used as a low-cost genome
screening tool for a large number of clinical NTHi isolates for
which disease phenotype data are available. The resultant
data will be used to generate gene association studies for the
identification of genes and gene combinations that contribute
to various disease processes.
Conclusion
The results reported herein provide evidence of a significant
population-based supragenome among clinical strains of the
NTHi, as well as substantive support for the DGH. The obser-
vation that, on average, every clinical strain varies from every
other clinical strain by the presence or absence of over 300
genetic loci is highly suggestive that there is enormous heter-
ogeneity among NTHi strains with respect to their pathogenic
potential. These findings point the way toward future studies
in which statistical genetic approaches could be brought to
bear on the identification of associations between particular
sets of genes within the supragenome, and the discrete clini-
cal disease phenotypes of the individual strains. As these
genic association data become available, it should be possible
to develop next-generation molecular diagnostics to help with
the prediction of disease treatment and outcome based upon
the particular infecting population.
Materials and methods
DNA sequencing
Complete or nearly complete genomic sequences of 11 unique
clinical strains of H. influenzae were generated and used in
comparative genomic analyses with the two published NTHi
genomes [32,33] in the development of a supragenome
model. Genomic sequence of nine clinically isolated NTHi
strains was generated at The Center for Genomic Sciences by
the 454 Life Sciences GS-20 sequencer using standard proto-
cols [25]. Strains were sequenced to a depth of 16×, or greater,
and assembled de novo by the 454 Newbler assembler to 81
contigs, on average. Lander-Waterman statistics predict that
greater than 99.9% of each genome was sequenced. Regions
of duplicated sequence caused most of the assembly gaps.
Informal comparison between high-quality Sanger reads and
454 data suggest an error rate of less than 1 in 1,000 bases.
Most base call errors are single base insertions or deletions in
homonucleotide repeats that can result in frame-shift arti-
facts. The other two clinical NTHi isolates (R2846 and
R2866) included in the comparison were sequenced at the
University of Washington Genome Center (Alice Erwin, per-
sonal communication). The complete genomic sequences of
H. influenzae strain Rd KW20 and 86-028NP and the incom-
plete sequences of strains R2846 and R2866 were accessed
through the Microbial Genomes Database of NCBI.
Accession numbers
The most recent versions of the genome assemblies were
deposited with GenBank, with the following accession num-
bers for the indicated strains: CP000671
(CGSHiEE);
CP000672
(CGSHiGG); AAZD00000000 (CGSHi22121);
AAZJ00000000 (CGSHi22421); AAZF00000000
(CGSHi3655); AAZG00000000 (CGSHiAA);
AAZH00000000
(CGSHiHH); AAZI00000000 (CGSHiII);
and AAZE00000000
(CGSHiR3021).
Partial genomic assembly of 454-based genomic
sequences
The 454-assembled PittEE strain genomic contigs were scaf-
folded against all four of the completed H. influenzae
genomes using Nucmer [34], which indicated the greatest
similarity to strain 86-028NP. Using a maximum parsimony
approach, the PittEE genome was reduced to 12 contigs by a
combination of: sequencing PCR amplicons targeted to fill
gaps between neighboring contigs, as inferred by the scaffold-
ing; and sequencing a 4 kb clone library and searching for
clones that spanned gaps in the 454 sequence. Gap closure
experiments were designed by a custom Perl script, and PCR
primers were designed by Primer3 [35]. Similarly, PittAA was
reduced to 47 contigs by sequencing of PCR amplicons gener-
ated following scaffolding. Clones and PCR amplicons were
assembled along with 454 contigs by a modified Phred-
Phrap-Consed pipeline where 454 contigs were converted to
PHD format files and input to Phrap as long reads [36-39].
Gene identification
Coding sequences for all 13 strains, including those previ-
ously annotated, were identified by the AMIgene microbial
gene finder adjusted to low-GC parameters and trained on the
Rd KW20 genome [40]. AMIgene builds three Markov mod-
els to identify coding sequences with different codon usage
statistics. This provides increased sensitivity for genes of pos-
sible foreign origin. Prior to gene calling, all contigs were arti-
ficially stitched together using a linker
(NNNNNCATTCCATTCATTAATTAATTAATGAATGAAT-
GNNNNN) that provided start and stop codons in all six read-
ing frames, permitting the identification of genes that extend
past the ends of a contig [27].
Gene clustering
Each pair of genes was examined for protein homology by
alignment of six-frame nucleotide translations to predicted
protein sequences. Alignments were generated by tfasty34,
part of the Fasta v3.4 package [41]. Six-frame translations
were employed to minimize the impact of frame-shift arti-
facts. Each gene was also aligned against the full nucleotide
sequence of the 13 genomes by fasta34 (also part of the Fasta
package): Fasta34 parameters, fasta34 -H -E 1 -m 9 -n -Q -d
0; Tfasty34 parameters, fasty34 -H -E 1 -m 9 -p -Q -d 0. Genes
were clustered based on homology using a single-linkage
algorithm. A link was defined by a significant tfasty match
between genes that exceeded an identity threshold of 70%
R103.16 Genome Biology 2007, Volume 8, Issue 6, Article R103 Hogg et al. />Genome Biology 2007, 8:R103
and covered at least 70% of the shorter gene (a detailed dis-
cussion of parameter selection is found in the supplementary
materials at [42]). The asymmetric length criterion was cho-
sen to insure that fragmented genes would cluster with the
full length version of the gene. A side-effect of this criterion is
that multi-domain proteins may fuse with proteins that are
composed of a subset of those domains. Significant fasta
matches between genes and genomic sequence were used to
identify sequence conservation between a gene cluster and a
strain. In the event of a significant match (70% identity/70%
length), the matching genome was considered to possess the
gene cluster for purposes of quantifying the number of strains
that contain the gene cluster. See supplementary materials
for a comparison of our clustering methods and the COG
method [42].
Multi-alignments were generated for each cluster using poa
(partial order alignment) in order to visually and computa-
tionally verify the integrity of the clusters [43]. If the multi-
alignment of a cluster was less than 120 bp in length, the clus-
ter was filtered as a likely false-positive gene. Finally, an
attempt was made to split false clusters formed by multi-
domain proteins by searching for point of partition in the
multi-alignment that divided the majority of genes into two
non-overlapping sets. The algorithm was implemented using
a custom Perl script.
Phylogenetic tree building
Two types of dendrograms were generated and compared. A
gene possession-based phylogenetic tree of the 13 NTHi
strains was constructed by defining the distance between a
pair of genomes i and k to be:
where g
n,i
= 1 if gene n is present in strain i and 0 otherwise.
The strains were clustered based on the distance metric by the
unweighted group average method implemented in the
Phylip package [44-46]. A tree was also generated using
sequence alignments of seven housekeeping genes used in
multi-locus sequence typing [47]. The tree was constructed
using the maximum likelihood method implemented in
fastDNAml as part of the Phylip package [48,49].
Whole genome alignment
Whole genome alignments were generated by Nucmer and
visualized by Mummerplot [34]. MUMmer parameters were
set to -maxmatch -l 16 -o. The order of PittEE contigs was
inferred from optical restriction fragment maps generated by
Opgen (Madison, WI, USA) [50]. Whole genome alignments
were not built for most strains since the ordering of the con-
tigs was not determined.
Insertion-deletion analysis
Inserted and deleted genomic sequence, in comparison to the
Rd KW20 genome, was identified by maximal sequence
matching performed by Nucmer [34] with the settings -max-
match -l 16 -o. Non-matching sequence was identified and
quantified by a custom Perl script.
Multistrain local sequence alignments
Multistrain local sequence alignments against reference
sequences (86-028NP or Rd KW20) were generated using
BLASTn [51] by querying the reference sequence against a
database containing the genomic sequence of all 13 strains.
Alignments were then visualized using BioPerl scripts. By the
nature of this alignment procedure, sequence that is present
only in non-reference strains is not visualized. Gene annota-
tions for reference strains were obtained from GenBank.
Phage homology analysis
Phage derived gene clusters were identified by selecting a rep-
resentative sequence from each gene cluster to use as a
BLASTx query against the NCBI NR (non-redundant) protein
database. GenBank records of the top ten significant protein
matches with e-value >1e-8 were queried for the keyword
'phage'. If the keyword was identified among the matches, the
gene cluster was flagged as 'phage derived'.
Codon usage analysis
The codon usage of a representative sequence from each clus-
ter was analyzed by CodeSquare using Rd KW20 mean codon
usage as a reference [26]. The epsilon statistic reported by
CodeSquare was normalized for ORF length dependence
using a best-fit power function for the mean and variance (as
a function of length). Gene clusters were divided into three
categories: core (gene found in all 13 strains), contingency (2-
12 strains), and unique (1 strain). To minimize length bias,
codon usage analyses were limited to genes with lengths
between 200 and 300 amino acids. Significant differences in
the median epsilon statistic were calculated using the non-
parametric Mann-Whitney U test.
Acknowledgements
The authors thank N. Luisa Hiller for valuable discussions and data check-
ing; Alice Erwin and Arnold Smith of the Seattle Biomedical Research Insti-
tute and Maynard V Olson, Rajinder K Kaul and Yang Zhou of the
University of Washington Genome Center for sharing the completely
assembled sequences of the NTHi strains R2846 and R2866 in advance of
publication. NTHi strain 3655 isolated from a patient with otitis media was
provided by Allen Ryan at UCSD. This work was supported by Allegheny
General Hospital, Allegheny Singer Research Institute, Seattle Biomedical
Research Institute, and grants from the Health Resources and Services
Administration and the NIH-NIDCD: DC02148 (GDE), DC04173 (GDE),
DC00129 (AR) and DC05659 (JCP). The authors thank Mary O'Toole for
help with the preparation of this manuscript.
References
1. Ehrlich GD, Veeh R, Wang X, Costerton JW, Hayes JD, Hu FZ, Daigle
BJ, Ehrlich MD: Mucosal biofilm formation on middle-ear
mucosa in the chinchilla model of otitis media. JAMA 2002,
gg
ni nk
n
,,
−
∑
Genome Biology 2007, Volume 8, Issue 6, Article R103 Hogg et al. R103.17
comment reviews reports refereed researchdeposited research interactions information
Genome Biology 2007, 8:R103
287:1710-1715.
2. Hall-Stoodley L, Hu FZ, Giesecke A, Nistico L, Nguyen D, Hayes J,
Forbes M, Greenberg DP, Dice B, Burrows A, et al.: Direct detec-
tion of bacterial biofilms on the middle-ear mucosa of chil-
dren with chronic otitis media. JAMA 2006, 296:202-211.
3. Post JC, Preston RA, Aul JJ, Larkins-Pettigrew M, Rydquist-White J,
Anderson KW, Wadowsky RM, Reagan DR, Walker ES, Kingsley LA,
et al.: Molecular analysis of bacterial pathogens in otitis media
with effusion. JAMA 1995, 273:1598-1604.
4. Murphy TF, Sethi S, Klingman KL, Brueggemann AB, Doern GV:
Simultaneous respiratory tract colonization by multiple
strains of nontypeable Haemophilus influenzae in chronic
obstructive pulmonary disease: implications for antibiotic
therapy. J Infect Dis 1999, 180:404-409.
5. Starner TD, Zhang N, Kim G, Apicella MA, McCray PB Jr: Haemo-
philus influenzae forms biofilms on airway epithelia: implica-
tions in cystic fibrosis. Am J Respir Crit Care Med 2006,
174:213-220.
6. Smith-Vaughan HC, Sriprakash KS, Mathews JD, Kemp DJ: Long
PCR-ribotyping of nontypeable Haemophilus influenzae. J Clin
Microbiol 1995, 33:1192-1195.
7. Smith-Vaughn HC, Leach AJ, Shelby-James TM, Kemp K, Kemp DJ,
Mathews JD: Carriage of multiple ribotypes of non-encapsu-
lated Haemophilus influenzae in Aboriginal infants with otitis
media. Epidemiol Infect 1996, 116:177-183.
8. Smith-Vaughn HC, Sriprakash KS, Mathews JD, Kemp DJ: Nonen-
capsulated Haemophilus influenzae in Aboriginal infants with
otitis media: prolonged carriage of P2 porin variants and evi-
dence for horizontal P2 gene transfer. Infect Immun 1997,
65:1468-1474.
9. Gilsdorf JR, Marrs CF, Foxman B: Haemophilus influenzae: genetic
variability and natural selection to identify virulence factors.
Infect Immun 2004, 72:2457-2461.
10. Erwin AL, Nelson KL, Mhlanga-Mutangadura T, Bonthuis PJ, Geelhood
JL, Morlin G, Unrath WC, Campos J, Crook DW, Farley MM: Char-
acterization of genetic and phenotypic diversity of invasive
nontypeable Haemophilus influenzae. Infect Immun 2005,
73:5853-5863.
11. Shen K, Antalis P, Gladitz J, Sayeed S, Ahmed A, Yu S, Hayes J, Johnson
S, Dice B, Dopico R, et al.: Identification, distribution, and
expression of novel genes in 10 clinical isolates of nontypea-
ble Haemophilus influenzae. Infect Immun 2005, 73:3479-3491.
12. Farjo RS, Foxman B, Patel MJ, Zhang L, Pettigrew MM, McCoy SI,
Marrs CF, Gilsdorf JR: Diversity and sharing of Haemophilus
influenzae strains colonizing healthy children attending day-
care centers. Pediatr Infect Dis J 2004, 23:41-46.
13. Hiltke TJ, Schiffmacher AT, Dagonese AJ, Sethi S, Murphy TF: Hori-
zontal transfer of the gene encoding outer membrane pro-
tein P2 of nontypeable Haemophilus influenzae, in a patient
with chronic obstructive pulmonary disease. J Infect Dis 2003,
188:114-117.
14. Ghigo JM: Natural conjugative plasmids induce bacterial bio-
film development. Nature 2001, 412:442-445.
15. Lamont RJ, Bryers JD: Biofilm-induced gene expression and
gene transfer. Methods Enzymol 2001, 336:84-94.
16. Roberts AP, Mullany P, Wilson M: Gene transfer in bacterial bio-
films. Methods Enzymol 2001, 336:60-65.
17. Wuertz S, Hendrickx L, Kuehn M, Rodenacker K, Hausner M: In situ
quantification of gene transfer in biofilms. Methods Enzymol
2001, 336:129-143.
18. Molin S, Tolker-Nielsen T: Gene transfer occurs with enhanced
efficiency in biofilms and induces enhanced stabilisation of
the biofilm structure. Curr Opin Biotechnol
2003, 14:255-261.
19. Ehrlich GD, Hu FZ, Shen K, Stoodley P, Post JC: Bacterial plurality
as a general mechanism driving persistence in chronic infec-
tions. Clin Orthop Relat Res 2005, 437:20-24.
20. Shen K, Antalis P, Gladitz J, Dice B, Janto B, Keefe R, Hayes J, Ahmed
A, Dopico R, Ehrlich N, et al.: Characterization, distribution and
expression of novel genes among eight clinical isolates of
Streptococcus pneumoniae. Infect Immun 2006, 74:321-330.
21. Shen K, Sayeed S, Antalis P, Gladitz J, Ahmed A, Dice B, Janto B, Dop-
ico R, Keefe R, Hayes J, et al.: Extensive genomic plasticity in
Pseudomonas aeruginosa revealed by identification and distri-
bution studies of novel (nonPAO1) genes among clinical iso-
lates. Infect Immun 2006, 74:5272-5283.
22. Lee MS, Morrison DA: Identification of a new regulator in Strep-
tococcus pneumoniae linking quorum sensing to competence
for genetic transformation. J Bacteriol 1999, 181:5004-5016.
23. Morrison DA, Lee MS: Regulation of competence for genetic
transformation in Streptococcus pneumoniae: a link between
quorum sensing and DNA processing genes. Res Microbiol
2000, 151:445-451.
24. Prudhomme M, Attaiech L, Sanchez G, Martin B, Claverys JP: Antibi-
otic stress induces genetic transformability in the human
pathogen Streptococcus pneumoniae. Science 2006, 313:89-92.
25. Margulies M, Egholm M, Altman WE, Attiya S, Bader JS, Bemben LA,
Berka J, Braverman MS, Chen YJ, Chen Z, et al.: Genome sequenc-
ing in microfabricated high-density picolitre reactors. Nature
2005, 437:376-380.
26. Gladitz J, Antalis P, Hu FZ, Post JC, Ehrlich GD: Codon usage com-
parison of novel genes in clinical isolates of Haemophilus
influenzae. Nucleic Acids Res 2005,
33:3644-3658.
27. Tettelin H, Masignani V, Cieslewicz MJ, Donati C, Medini D, Ward
NL, Angiuoli SV, Crabtree J, Jones AL, Durkin AS, et al.: Genome
analysis of multiple pathogenic isolates of Streptococcus aga-
lactiae: implications for the microbial "pan-genome". Proc
Natl Acad Sci USA 2005, 102:13950-13955.
28. Tatusov RL, Koonin EV, Lipman DJ: A genomic perspective on
protein families. Science 1997, 278:631-637.
29. Deonier RC, Tavaré S, Waterman MS: Computational Genome Analysis:
an Introduction Springer; New York; 2005.
30. Danner DB, Deich RA, Sisco KL, Smith HO: An eleven base-pair
sequence determines the specificity of DNA uptake in Hae-
mophilus transformation. Gene 1980, 11:311-318.
31. Smith HO, Tomb JF, Dougherty BA, Fleischmann RD, Venter JC: Fre-
quency and distribution of DNA uptake signal sequences in
the Haemophilus influenzae Rd genome. Science 1995,
269:538-540.
32. Fleischmann RD, Adams MD, White O, Clayton RA, Kirkness EF,
Kerlavage AR, Bult CJ, Tomb JF, Dougherty BA, Merrick JM, et al.:
Whole-genome random sequencing and assembly of Haemo-
philus influenzae Rd. Science 1995, 269:496-512.
33. Harrison A, Dyer DW, Gillaspy A, Ray WC, Mungur R, Carson MB,
Zhong H, Gipson J, Gipson M, Johnson LS, et al.: Genomic
sequence of an otitis media isolate of nontypeable Haemo-
philus influenzae: comparative study with H. influenzae sero-
type d, strain KW20. J Bacteriol 2005, 187:4627-4636.
34. Delcher AL, Kasif S, Fleischmann RD, Peterson J, White O, Salzberg
SL: Alignment of whole genomes. Nucleic Acids Res 1999,
27:2369-2376.
35. Rozen S, Skaletsky H: Primer3 on the WWW for general users
and for biologist programmers. In
Bioinformatics Methods and Pro-
tocols Volume 132. Edited by: Krawetz S, Misener S. Totowa, New Jer-
sey: Humana Press; 2000:365-386. [Methods in Molecular Biology]
36. Ewing B, Hillier L, Wendl M, Green P: Base-calling of automated
sequencer traces using phred. I. Accuracy assessment.
Genome Res 1998, 8:175-185.
37. Ewing B, Green P: Base-calling of automated sequencer traces
using phred. II. Error probabilities. Genome Res 1998,
8:186-194.
38. Gordon D, Abajian C, Green P: Consed: a graphical tool for
sequence finishing. Genome Res 1998, 8:195-202.
39. Gordon D: Viewing and editing assembled sequences using
consed. In Current Protocols in Bioinformatics Edited by: Baxevanis AD,
Davison DB. New York: John Wiley & Co; 2004:11.2.1-11.2.43.
40. van Hijum SA, Zomer AL, Kuipers OP, Kok J: AMIgene. Nucleic Acids
Res 2003, 31:e144.
41. Pearson WR, Lipman DJ: Improved tools for biological sequence
comparison. Proc Natl Acad Sci USA 1988, 85:2444-2448.
42. Supplementary Material [terforgenomic sci-
ences.org/doc_frame/index-old.html]
43. Lee C, Grasso C, Sharlow MF: Multiple sequence alignment
using partial order graphs. Bioinformatics 2002, 18:452-464.
44. Jain AK, Dubes RC: Algorithms for Clustering Data Englewood Cliffs,
New Jersey: Prentice Hall; 1988.
45. PHYLIP (Phylogeny Inference Package) [http://evolu
tion.genetics.washington.edu/phylip.html]
46. Felsenstein J: PHYLIP (Phylogeny Inference Package) version
3.2. Cladistics 5:164-166.
47. Meats E, Feil EJ, Stringer S, Cody A, Goldstein R, Kroll JS, Popovic T,
Spratt BG: Characterization of encapsulated and noncapsu-
lated Haemophilus influenzae and determination of phyloge-
netic relationships by multilocus sequence typing. J Clin
Microbiol 2003, 41:1623-1636.
48. Olsen GJ, Matsuda H, Hagstrom R, Overbeek R:
fastDNAml: a tool
for construction of phylogenetic trees of DNA sequences
R103.18 Genome Biology 2007, Volume 8, Issue 6, Article R103 Hogg et al. />Genome Biology 2007, 8:R103
using maximum likelihood. Comput Appl Biosci 1994, 10:41-48.
49. Felsenstein J: Evolutionary trees from DNA sequences: A max-
imum likelihood approach. J Mol Evol 1981, 17:368-376.
50. Schwartz DC, Li X, Hernandez LI, Ramnarain SP, Huff EJ, Wang YK:
Ordered restriction maps of Saccharomyces cerevisiae chro-
mosomes constructed by optical mapping. Science 1993,
262:110-114.
51. Altschul SF, Gish W, Miller W, Myers EW, Lipman DJ: Basic local
alignment search tool. J Mol Biol 1990, 215:403-410.
52. Barenkamp SJ, Leininger E: Cloning, expression, and DNA
sequence analysis of genes encoding nontypeable Haemo-
philus influenzae high-molecular-weight surface-exposed
proteins related to filamentous hemagglutinin of Bordetella
pertussis. Infect Immun 1992, 60:1302-1313.
53. Nizet V, Colina KF, Almquist JR, Rubens CE, Smith AL: A virulent
nonencapsulated Haemophilus influenzae. Infect Immun 2001,
69:695-705.
54. Musser JM, Barenkamp SJ, Granoff DM, Selander RK: Genetic rela-
tionships of serologically nontypeable and serotype b strains
of Haemophilis influenzae. Infect Immun 1986, 52:183-191.